River Forest: Fire Incidents, Illinois (IL)
Where are fire incidents reported in River Forest, IL
Something went wrong! Please refresh the page.
| Fire incidents reported | |
|---|---|
| Sreet name | Count |
| DIVISION ST | 144 |
| PARK AVE | 126 |
| AUGUSTA ST | 120 |
| ASHLAND AVE | 116 |
| FRANKLIN AVE | 96 |
| LATHROP AVE | 90 |
| LAKE ST | 80 |
| MONROE AVE | 74 |
| THATCHER AVE | 70 |
| WILLIAM ST | 70 |
| AUGUSTA | 62 |
| FOREST AVE | 60 |
| HARLEM AVE | 58 |
| KEYSTONE AVE | 58 |
| JACKSON AVE | 54 |
| NORTH AVE | 46 |
| OAK AVE | 44 |
| BONNIE BRAE PL | 30 |
| GALE AVE | 30 |
| EDGEWOOD PL | 28 |
| WILLIAM | 24 |
| DIVISION | 20 |
| CLINTON PL | 18 |
| BONNIE BRAE | 16 |
| LATHROP | 16 |
| PARK | 16 |
| FRANKLIN | 14 |
| KEYSTONE | 14 |
| LAKE | 14 |
| WASHINGTON | 14 |
2002 - 2018 National Fire Incident Reporting System (NFIRS) incidents
- Incident types reported to NFIRS in River Forest, IL
- 4,88845.4%Rescue & EMS
- 1,56814.6%Good Intent Call
- 1,20711.2%Hazardous Condition
- 1,12610.5%False Alarm
- 1,0529.8%Service Call
- 9058.4%Fire
- 170.2%Overpressure Rupture
- Fire incident types reported to NFIRS in River Forest, IL
- 71879.3%Structure Fires
- 13214.6%Outside Fires
- 535.9%Mobile Property/Vehicle Fires
- 20.2%Other
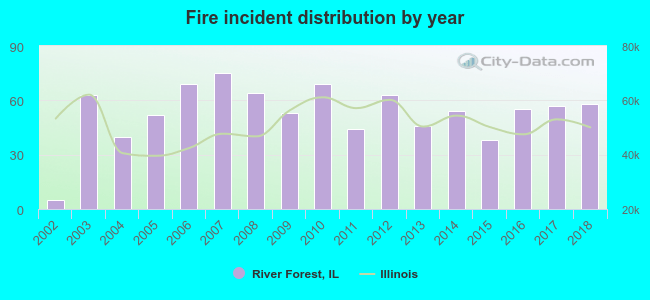 Based on the data from the years 2002 - 2018 the average number of fires per year is 53. The highest number of reported fire incidents - 75 took place in 2007, and the least - 5 in 2002. The data has a growing trend.
The average number of yearly fire incidents per 10k residents in River Forest, IL compared to nearest cities:
(Note: Based on data for the last 3 years, including only cities with population 5,000 and above)
| River Forest: | 50.6 |
| Forest Park: | 45.8 |
| Oak Park: | 26.3 |
| Maywood: | 58.8 |
| Elmwood Park: | 26.3 |
| Melrose Park: | 35.1 |
| River Grove: | 29.2 |
| Broadview: | 57.0 |
| Bellwood: | 43.3 |
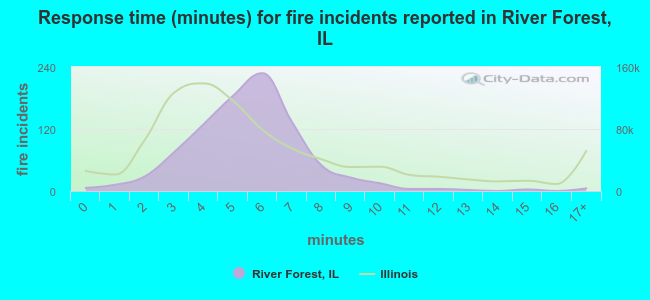 The median response time based on all reported fire incidents is 6 minutes. This is close to the state median value.
The median response time in River Forest, IL compared to nearest cities:
(Note: Based on data for all years, including only cities with at least 500 fire incidents)
| River Forest: | 6 minutes |
| Forest Park: | 5 minutes |
| Oak Park: | 5 minutes |
| Maywood: | 3 minutes |
| Elmwood Park: | 5 minutes |
| Melrose Park: | 4 minutes |
| River Grove: | 4 minutes |
| Broadview: | 3 minutes |
| Bellwood: | 3 minutes |
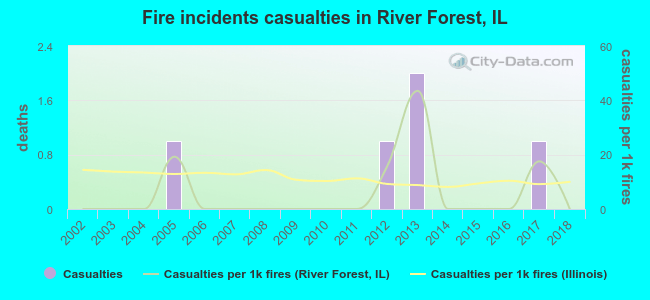 According to the reports from the years 2002 - 2018 the average number of fire-related yearly casualties is 0. The highest number of injuries - 2 took place in 2013, and the lowest - 0 in 2002. The data has a constant trend.
The average number of casualties per 1,000 fire incidents is 6. This indicator was the highest - 43 in 2013, and the lowest 0 in 2002. The trend for casualties per 1,000 fire incidents is constant. Compared to the Illinois value the number of casualties per 1,000 fire incidents is much lower.
According to the reports from the years 2002 - 2018 the average number of fire-related yearly casualties is 0. The highest number of injuries - 2 took place in 2013, and the lowest - 0 in 2002. The data has a constant trend.
The average number of casualties per 1,000 fire incidents is 6. This indicator was the highest - 43 in 2013, and the lowest 0 in 2002. The trend for casualties per 1,000 fire incidents is constant. Compared to the Illinois value the number of casualties per 1,000 fire incidents is much lower.Casualties per 1,000 incidents in River Forest, IL compared to nearest cities:
(Note: Based on data for all years, including only cities with at least 500 fire incidents)
| River Forest: | 5.5 |
| Forest Park: | 8.3 |
| Oak Park: | 11.2 |
| Maywood: | 6.1 |
| Elmwood Park: | 3.5 |
| Melrose Park: | 12.3 |
| River Grove: | 3.1 |
| Broadview: | 17.9 |
| Bellwood: | 5.1 |
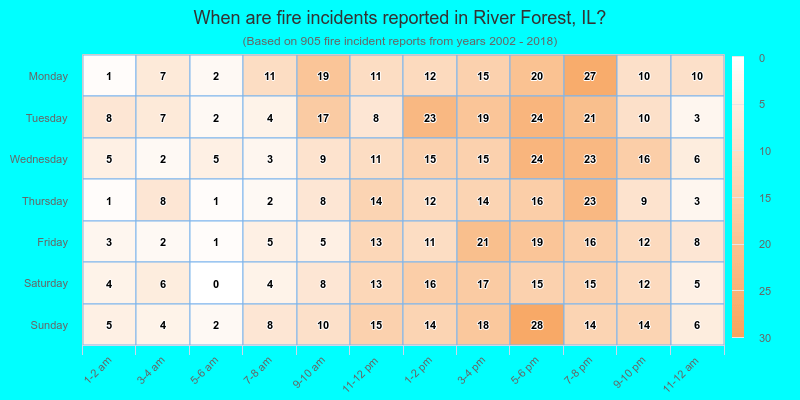
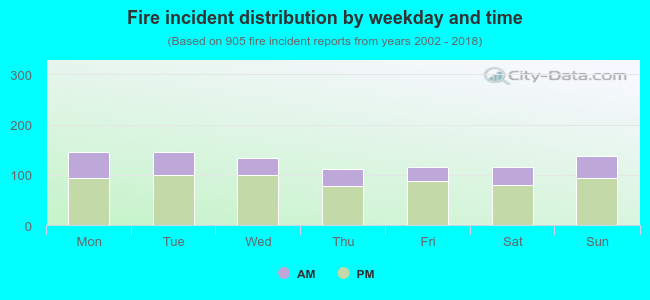 30.3% incidents where reported in the morning and 69.7% in the evening. The most fires (16.1%) took place on Tuesday, and the least (12.3%) on Thursday.
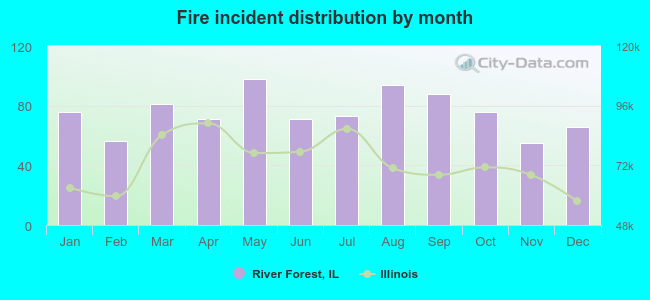 Based on the 905 reports from years 2002 - 2018 most fires (10.8%) took place during May, and the least (6.1%) in November.
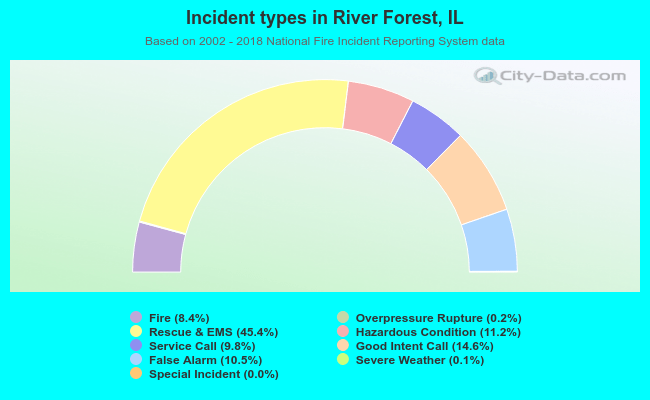 Out of all 10,775 cases reported during the years 2002 - 2018, the most belonged to the categories: Rescue & EMS (45.4%), Good Intent Call (14.6%), and Hazardous Condition (11.2%).
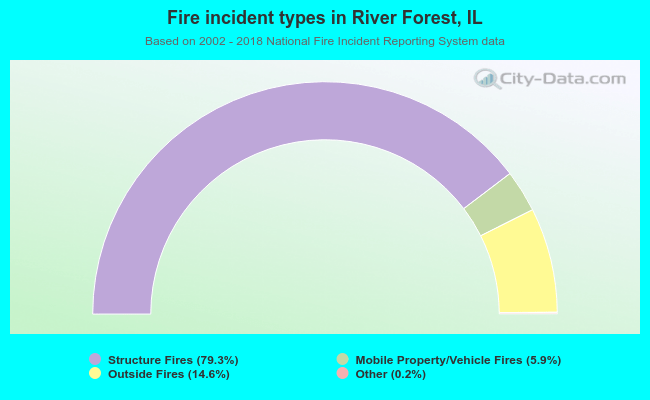 When looking into fire subcategories, the most reports belonged to: Structure Fires (79.3%), and Outside Fires (14.6%).