San Leandro: Fire Incidents, California (CA)
Where are fire incidents reported in San Leandro, CA
Something went wrong! Please refresh the page.
| Fire incidents reported | |
|---|---|
| Sreet name | Count |
| 14TH ST | 378 |
| DAVIS ST | 138 |
| I880 | 96 |
| DOOLITTLE DR | 80 |
| HESPERIAN | 78 |
| WILLIAMS ST | 58 |
| E 14TH ST | 50 |
| I580 | 50 |
| MARINA BL | 48 |
| ALVARADO ST | 46 |
| WASHINGTON AV | 44 |
| WASHINGTON AV | 44 |
| BANCROFT AV | 42 |
| DAVIS ST | 42 |
| HESPERIAN BLVD | 42 |
| MARINA | 42 |
| SAN LEANDRO BL | 42 |
| SAN LEANDRO BL | 42 |
| FAIRMONT DR | 40 |
| MONARCH BAY DR | 40 |
| ESTABROOK ST | 38 |
| LIBERTY ST | 38 |
| SWEETWATER DR | 38 |
| WASHINGTON AVE | 38 |
| HESPERIAN BL | 36 |
| MARCELLA ST | 36 |
| MARINA BLVD | 34 |
| SAN LEANDRO | 34 |
| HESPERIAN BL | 32 |
| SAN LEANDRO BLVD | 32 |
| Other | 1,088 |
2005 - 2018 National Fire Incident Reporting System (NFIRS) incidents
- Incident types reported to NFIRS in San Leandro, CA
- 27,41267.6%Rescue & EMS
- 4,25310.5%Good Intent Call
- 2,8867.1%Fire
- 2,2515.6%Hazardous Condition
- 1,9504.8%Service Call
- 1,7204.2%False Alarm
- 430.1%Special Incident
- Fire incident types reported to NFIRS in San Leandro, CA
- 1,25143.3%Structure Fires
- 95333.0%Outside Fires
- 63522.0%Mobile Property/Vehicle Fires
- 471.6%Other
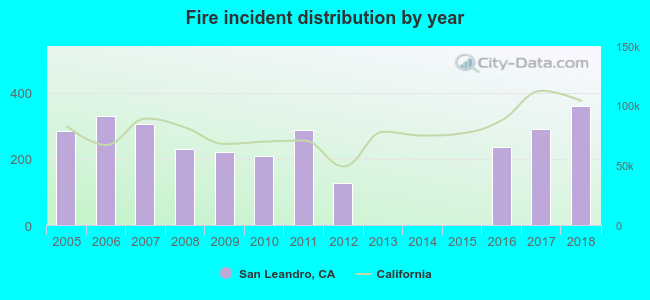 Based on the data from the years 2005 - 2018 the average number of fires per year is 206. The highest number of reported fire incidents - 361 took place in 2018, and the least - 0 in 2013. The data has an increasing trend.
The average number of yearly fire incidents per 10k residents in San Leandro, CA compared to nearest cities:
(Note: Based on data for the last 3 years, including only cities with population 5,000 and above)
| San Leandro: | 33.1 |
| San Lorenzo: | 27.3 |
| Castro Valley: | 14.8 |
| Hayward: | 3.3 |
| Alameda: | 20.8 |
| Oakland: | 37.6 |
| Piedmont: | 10.7 |
| Moraga: | 14.9 |
| Union City: | 18.2 |
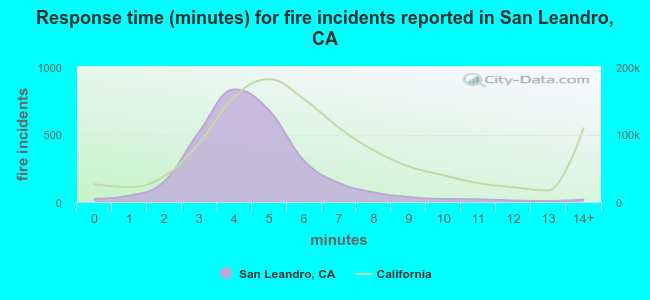 The median response time based on all reported fire incidents is 4 minutes. This is lower compared to the state median value.
The median response time in San Leandro, CA compared to nearest cities:
(Note: Based on data for all years, including only cities with at least 500 fire incidents)
| San Leandro: | 4 minutes |
| San Lorenzo: | 4 minutes |
| Castro Valley: | 5 minutes |
| Hayward: | 4 minutes |
| Alameda: | 4 minutes |
| Oakland: | 5 minutes |
| Union City: | 5 minutes |
| San Ramon: | 5 minutes |
| Danville: | 6 minutes |
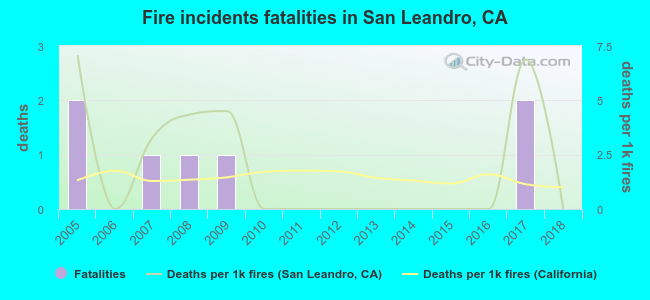 Based on the data from the years 2005 - 2018 the average number of fire-related yearly deaths is 1. The highest number of deaths - 2 took place in 2005, and the lowest - 0 in 2006. The data has a decreasing trend.
The average number of deaths per 1,000 fire incidents is 2. This indicator was the highest - 7 in 2005, and the lowest 0 in 2006. The trend for fatalities per 1,000 fire incidents is declining. Compared to the California value the number of deaths per 1,000 fires is higher.
Based on the data from the years 2005 - 2018 the average number of fire-related yearly deaths is 1. The highest number of deaths - 2 took place in 2005, and the lowest - 0 in 2006. The data has a decreasing trend.
The average number of deaths per 1,000 fire incidents is 2. This indicator was the highest - 7 in 2005, and the lowest 0 in 2006. The trend for fatalities per 1,000 fire incidents is declining. Compared to the California value the number of deaths per 1,000 fires is higher.
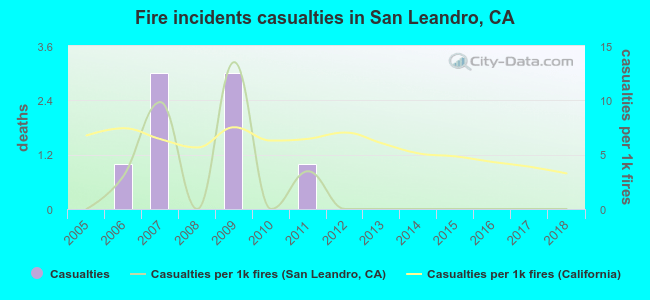 Based on the data from the years 2005 - 2018 the average number of fire-related casualties per year is 1. The highest number of casualties - 3 took place in 2007, and the lowest - 0 in 2005. The data has a constant trend.
The average number of casualties per 1,000 fires is 2. This indicator was the highest - 14 in 2009, and the lowest 0 in 2005. The trend for injuries per 1,000 incidents is constant. Compared to the California value the number of casualties per 1,000 fires is much lower.
Based on the data from the years 2005 - 2018 the average number of fire-related casualties per year is 1. The highest number of casualties - 3 took place in 2007, and the lowest - 0 in 2005. The data has a constant trend.
The average number of casualties per 1,000 fires is 2. This indicator was the highest - 14 in 2009, and the lowest 0 in 2005. The trend for injuries per 1,000 incidents is constant. Compared to the California value the number of casualties per 1,000 fires is much lower.Casualties per 1,000 incidents in San Leandro, CA compared to nearest cities:
(Note: Based on data for all years, including only cities with at least 500 fire incidents)
| San Leandro: | 2.8 |
| San Lorenzo: | 0.0 |
| Castro Valley: | 0.9 |
| Hayward: | 1.8 |
| Alameda: | 2.3 |
| Oakland: | 1.5 |
| Union City: | 1.4 |
| San Ramon: | 0.0 |
| Danville: | 0.0 |
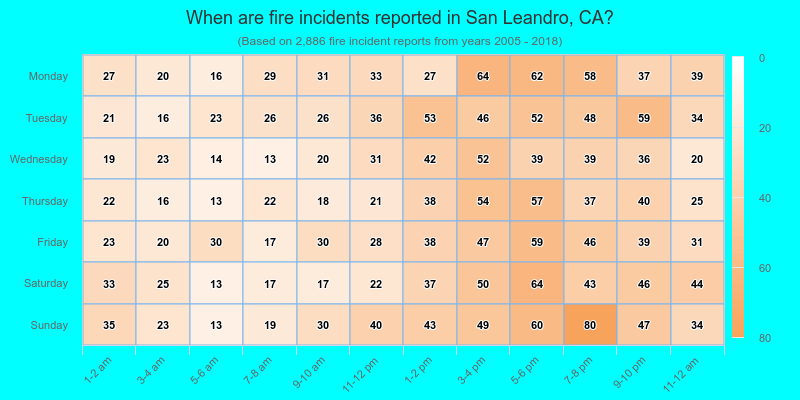
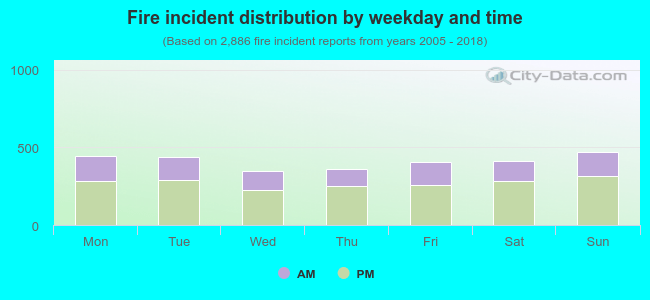 33.6% incidents where reported in the morning and 66.4% in the evening. The most fires (16.4%) took place on Sunday, and the least (12.1%) on Wednesday.
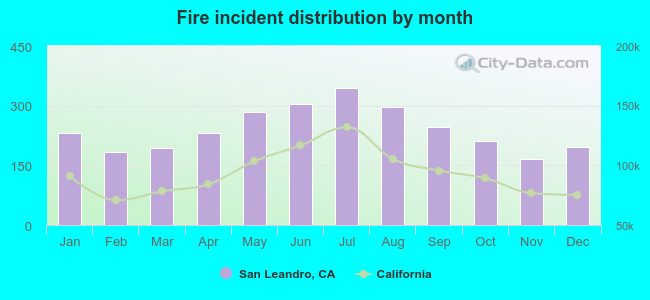 Based on the 2,886 reports from years 2005 - 2018 most fires (12.0%) took place during July, and the least (5.7%) in November.
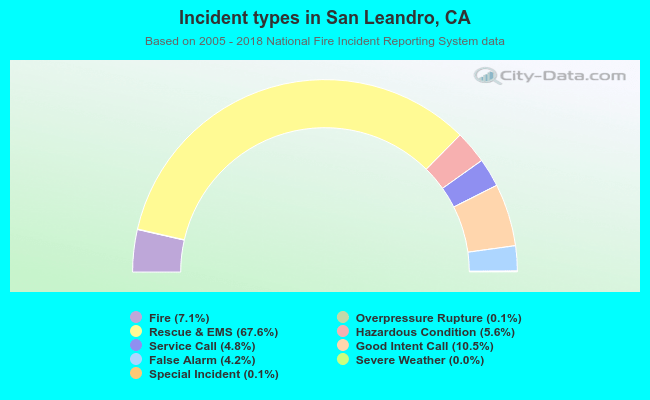 Out of all 40,546 cases reported during the years 2005 - 2018, the most belonged to the categories: Rescue & EMS (67.6%), Good Intent Call (10.5%), and Fire (7.1%).
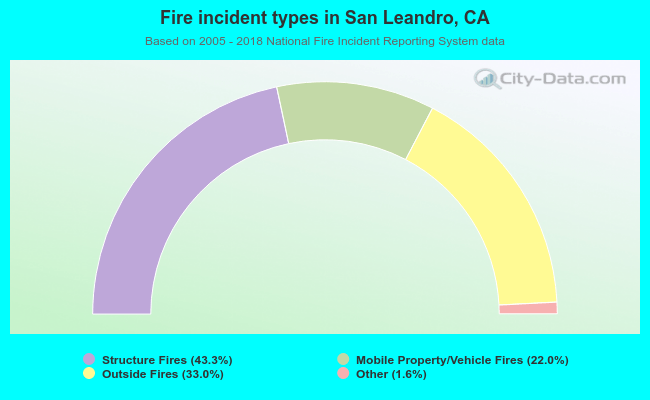 When looking into fire subcategories, the most incidents belonged to: Structure Fires (43.3%), and Outside Fires (33.0%).