Schulenburg: Fire Incidents, Texas (TX)
Where are fire incidents reported in Schulenburg, TX
Something went wrong! Please refresh the page.
|
| |||||||||||||||||||||||||||||||||||||||||||||||||||||||||||||||||||||||||||||||||||||||||||||||||||||||||||||
2002 - 2018 National Fire Incident Reporting System (NFIRS) incidents
- Incident types reported to NFIRS in Schulenburg, TX
- 77361.5%Fire
- 15312.2%Rescue & EMS
- 14111.2%Hazardous Condition
- 887.0%Service Call
- 524.1%Good Intent Call
- 483.8%False Alarm
- Fire incident types reported to NFIRS in Schulenburg, TX
- 51666.8%Outside Fires
- 13317.2%Structure Fires
- 11414.7%Mobile Property/Vehicle Fires
- 101.3%Other
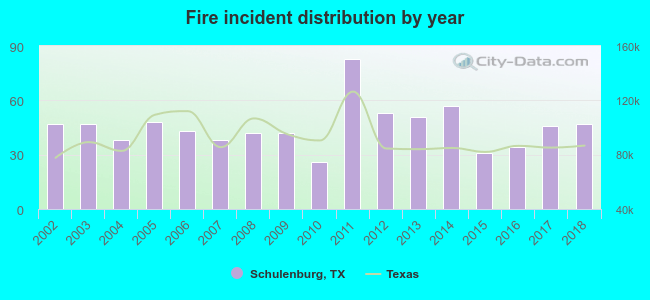 According to the data from the years 2002 - 2018 the average number of fire incidents per year is 45. The highest number of reported fire incidents - 83 took place in 2011, and the least - 26 in 2010. The data has a constant trend.
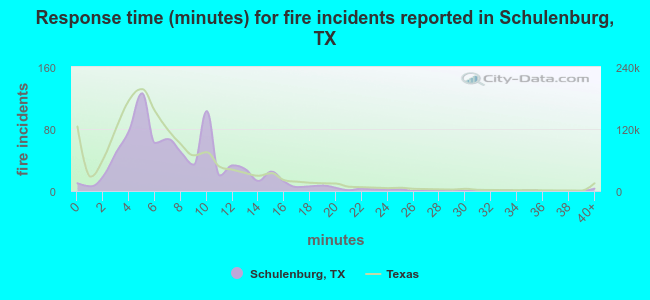 The median response time based on all reported fire incidents is 7 minutes. This is close to the state median value.
The median response time in Schulenburg, TX compared to nearest cities:
(Note: Based on data for all years, including only cities with at least 500 fire incidents)
| Schulenburg: | 7 minutes |
| Flatonia: | 0 minutes |
| La Grange: | 10 minutes |
| Hallettsville: | 11 minutes |
| Columbus: | 9 minutes |
| Smithville: | 10 minutes |
| Yoakum: | 6 minutes |
| Gonzales: | 9 minutes |
| Giddings: | 5 minutes |
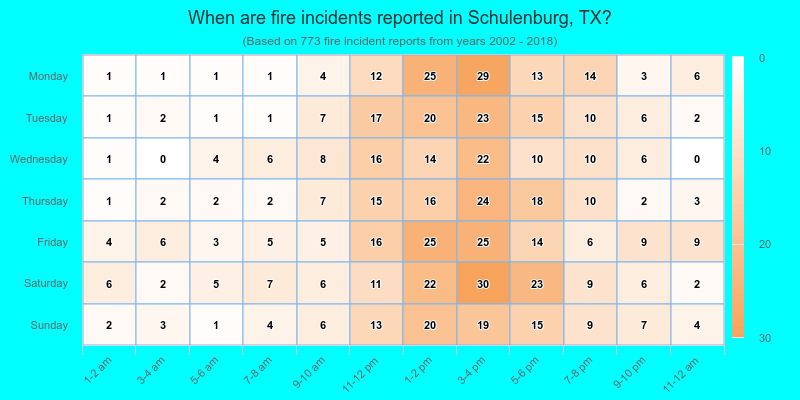
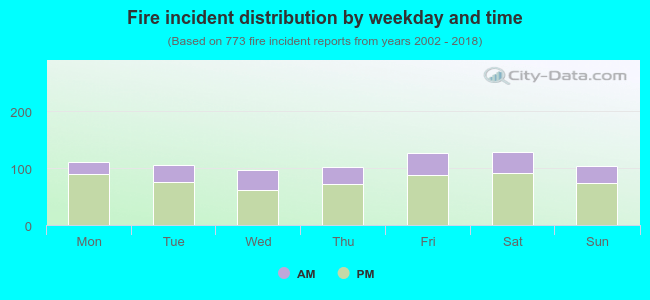 28.2% incidents where reported in the morning and 71.8% in the evening. The most fires (16.7%) took place on Saturday, and the least (12.5%) on Wednesday.
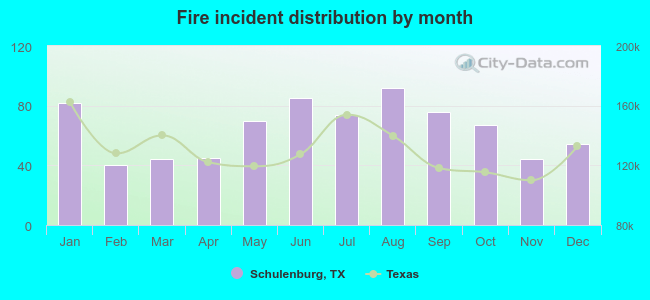 According to the 773 reports from years 2002 - 2018 most fires (11.9%) took place during August, and the least (5.2%) in February.
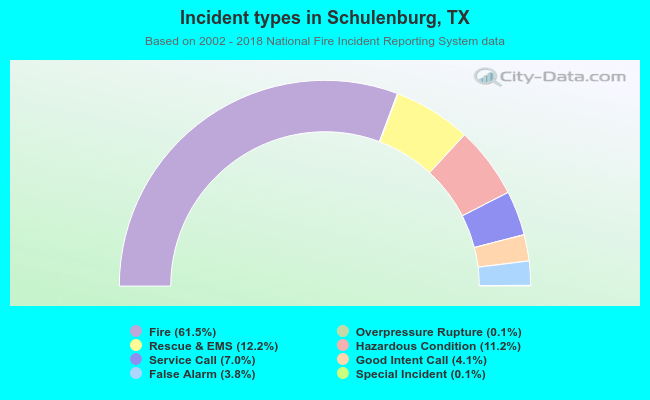 Out of all 1,257 cases reported during the years 2002 - 2018, the most belonged to the categories: Fire (61.5%), Rescue & EMS (12.2%), and Hazardous Condition (11.2%).
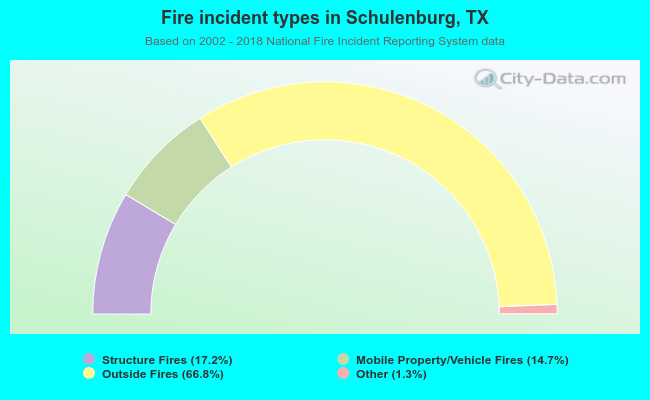 When looking into fire subcategories, the most reports belonged to: Outside Fires (66.8%), and Structure Fires (17.2%).