| Fire incidents reported |
|---|
| Sreet name | Count |
|---|
| MOHAWK TRL | 26 | | BARNARD RD | 12 | | MOHAWK TRAIL HWY | 12 | | LITTLE MOHAWK RD | 10 | | BROOK RD | 6 | | FRANK WILLIAMS ROAD RD | 6 | | PATTEN RD | 6 | | SHELBURNE CENTER RD | 6 | | TOWER RD | 6 | | BARDWELLS FERRY RD | 4 | | BRIDGE STREET | 4 | | FISKE MILL RD | 4 | | FRANK WILLIAMS RD | 4 | | HIGHLAND VILLAGE | 4 | | LUCY FISKE RD | 4 | | MERCY ANDERSON RD | 4 | | OLD ALBANY RD | 4 | | OLD GREENFIELD RD | 4 | | RT #2 MOHAWK TRAIL | 4 | | SHELBURNE RD | 4 | | SKINNER ROAD RD | 4 | | SOUTH SHELBURNE ROAD RD | 4 | | WILSON GRAVES RD | 4 | | 1179 ROUTE 2 | 2 | | 247 BERNARD ROAD | 2 |
| | | Fire incidents reported |
|---|
| Sreet name | Count |
|---|
| BARDWELLS FERRY RD | 2 | | BARDWELLS FERRY RD. RD | 2 | | BARDWELLS FERRY ROAD | 2 | | BARNARD RD RD | 2 | | BARWALL FAIRY RD | 2 | | COLRAIN SHELBURNE RD | 2 | | COLRAIN SHELBURNE ROAF | 2 | | COLRAIN-SHELBURNE RD RD | 2 | | COLRAINSHELBURNE RD | 2 | | COOPER | 2 | | COOPER LN | 2 | | FISKE MILL ROAD RD | 2 | | FOUNDRY VILLAGE RD | 2 | | LITTLE MOHAWK ROAD RD | 2 | | LUCY FISKE ROAD RD | 2 | | MAIN ST | 2 | | MAIN STREET ( RT112 NORTH) | 2 | | MECHANIC ST | 2 | | MECHANIC STREET | 2 | | MOHAWK TRAIL | 2 | | MOHAWKTRAIL HWY | 2 | | OLD GREENFIELD RD | 2 | | PATTEN ROAD RD | 2 | | PINNACLE LANE | 2 | | |
|
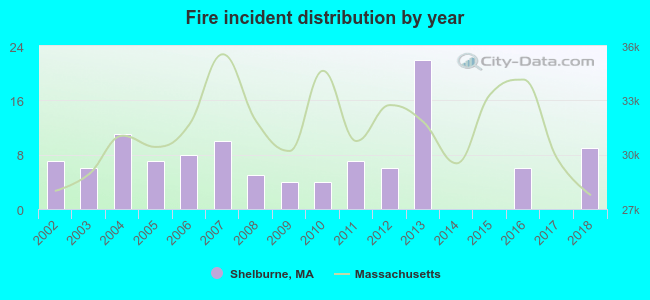 Based on the data from the years 2002 - 2018 the average number of fire incidents per year is 7. The highest number of fires - 22 took place in 2013, and the least - 0 in 2014. The data has a growing trend.
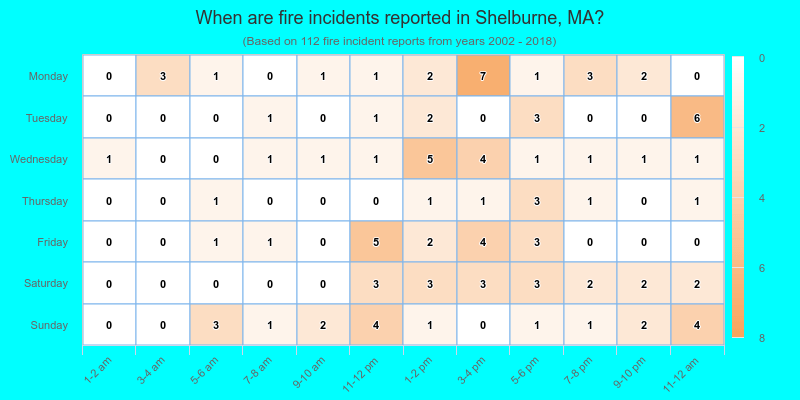
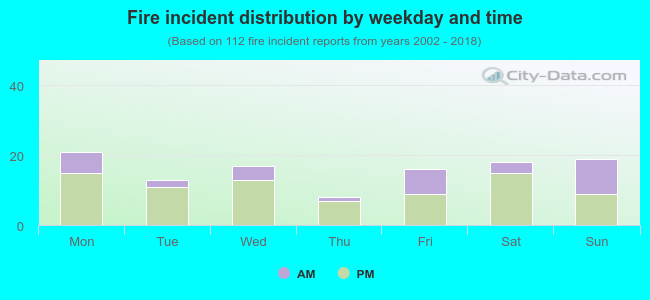 29.5% incidents where reported in the morning and 70.5% in the evening. The most fires (18.8%) took place on Monday, and the least (7.1%) on Thursday.
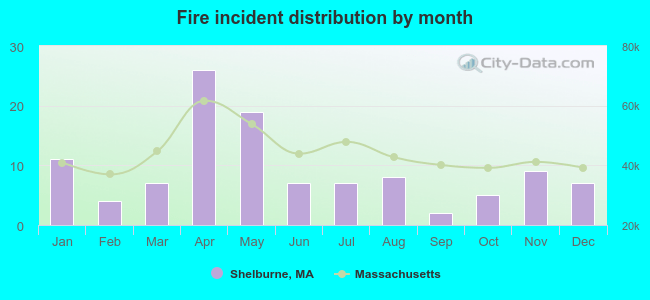 According to the 112 incident reports from years 2002 - 2018 most fires (23.2%) took place during April, and the least (1.8%) in September.
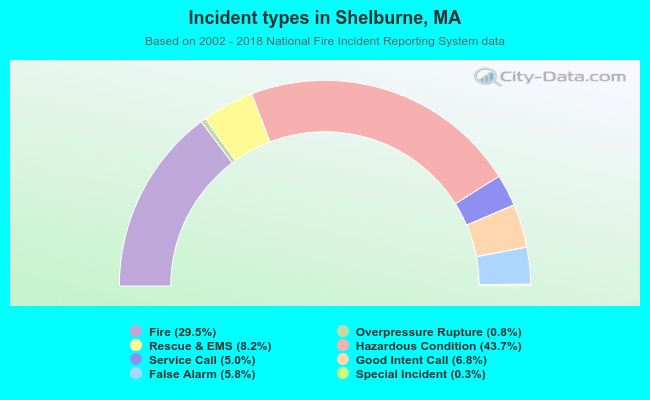 Out of all 380 cases reported during the years 2002 - 2018, the most belonged to the categories: Hazardous Condition (43.7%), Fire (29.5%), and Rescue & EMS (8.2%).
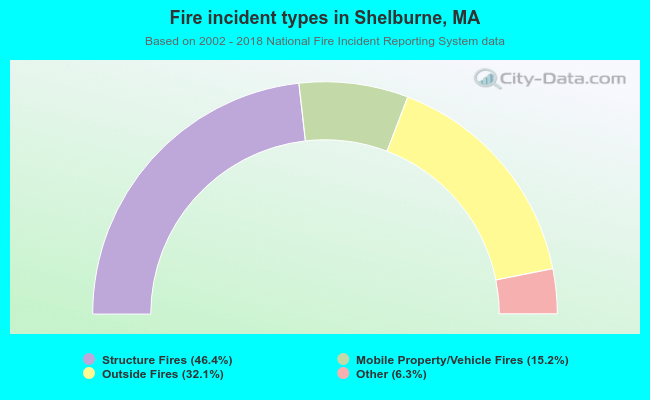 When looking into fire subcategories, the most incidents belonged to: Structure Fires (46.4%), and Outside Fires (32.1%).