Signal Hill: Fire Incidents, California (CA)
Where are fire incidents reported in Signal Hill, CA
Something went wrong! Please refresh the page.
|
| |||||||||||||||||||||||||||||||||||||||||||||||||||||||||||||||||||||||||||||||||||||||||||||||||||||||||||||
2005 - 2018 National Fire Incident Reporting System (NFIRS) incidents
- Incident types reported to NFIRS in Signal Hill, CA
- 3,46962.5%Rescue & EMS
- 1,05719.0%Good Intent Call
- 3446.2%Fire
- 3135.6%False Alarm
- 1963.5%Hazardous Condition
- 1663.0%Service Call
- Fire incident types reported to NFIRS in Signal Hill, CA
- 13138.1%Outside Fires
- 10731.1%Mobile Property/Vehicle Fires
- 8223.8%Structure Fires
- 247.0%Other
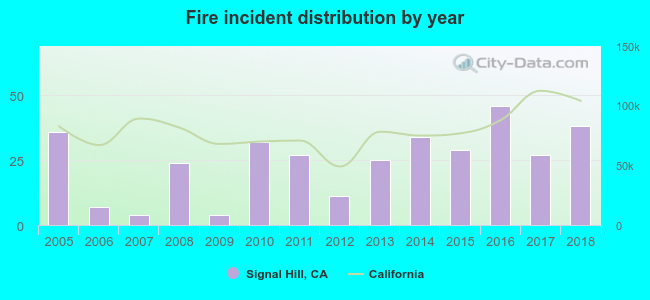 Based on the data from the years 2005 - 2018 the average number of fire incidents per year is 25. The highest number of reported fire incidents - 46 took place in 2016, and the least - 4 in 2007. The data has a rising trend.
The average number of yearly fire incidents per 10k residents in Signal Hill, CA compared to nearest cities:
(Note: Based on data for the last 3 years, including only cities with population 5,000 and above)
| Signal Hill: | 32.1 |
| Long Beach: | 22.3 |
| Lakewood: | 12.0 |
| Rossmoor: | 2.3 |
| Carson: | 21.2 |
| Seal Beach: | 17.8 |
| Hawaiian Gardens: | 20.8 |
| Los Alamitos: | 16.2 |
| Bellflower: | 19.1 |
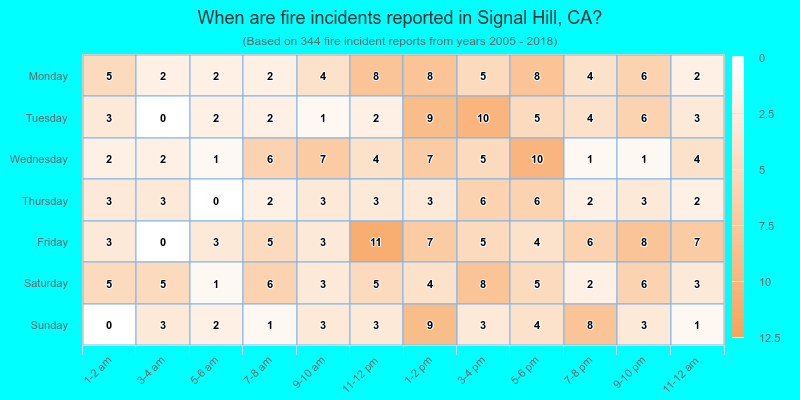
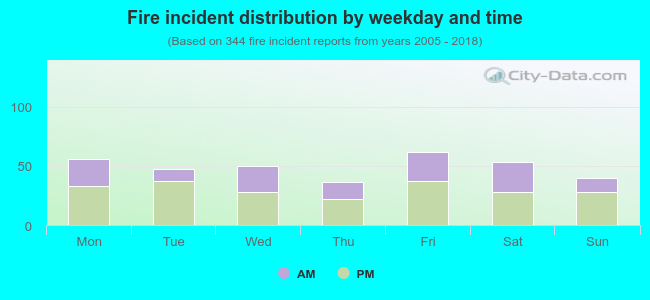 38.1% incidents where reported in the morning and 61.9% in the evening. The most fires (18.0%) took place on Friday, and the least (10.5%) on Thursday.
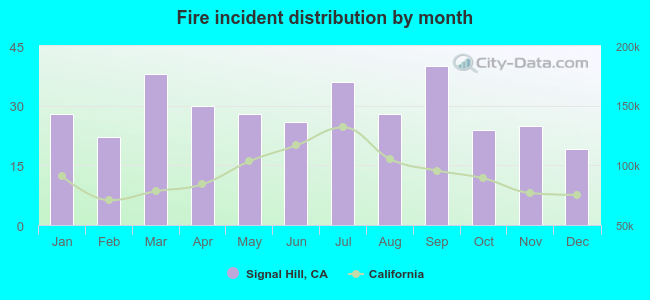 Based on the 344 incident reports from years 2005 - 2018 most fires (11.6%) took place during September, and the least (5.5%) in December.
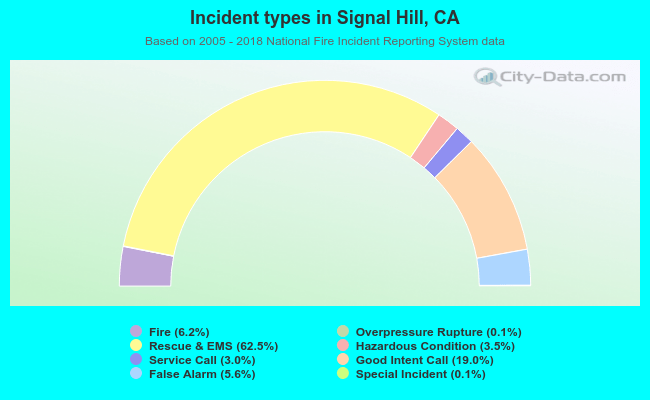 Out of all 5,554 cases reported during the years 2005 - 2018, the most belonged to the categories: Rescue & EMS (62.5%), Good Intent Call (19.0%), and Fire (6.2%).
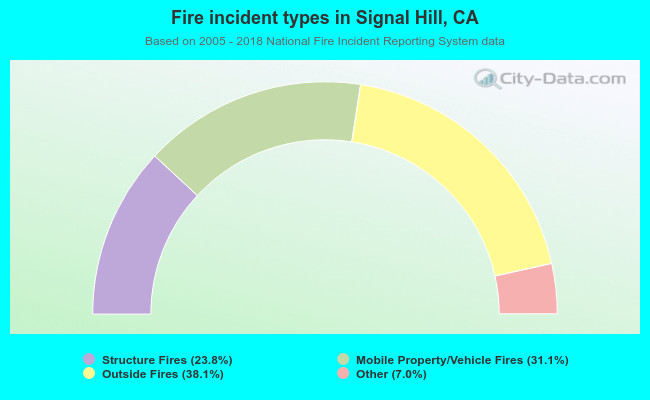 When looking into fire subcategories, the most incidents belonged to: Outside Fires (38.1%), and Mobile Property/Vehicle Fires (31.1%).