Waterproof: Fire Incidents, Louisiana (LA)
Where are fire incidents reported in Waterproof, LA
Something went wrong! Please refresh the page.
|
| |||||||||||||||||||||||||||||||||||||||||||||||||||||||||||||||||||||||||||||||||||||||||||||||||||||||||
2004 - 2018 National Fire Incident Reporting System (NFIRS) incidents
- Incident types reported to NFIRS in Waterproof, LA
- 17462.6%Fire
- 7527.0%Rescue & EMS
- 124.3%Hazardous Condition
- 103.6%Good Intent Call
- 62.2%Service Call
- 10.4%False Alarm
- Fire incident types reported to NFIRS in Waterproof, LA
- 7643.7%Structure Fires
- 6436.8%Outside Fires
- 2715.5%Mobile Property/Vehicle Fires
- 74.0%Other
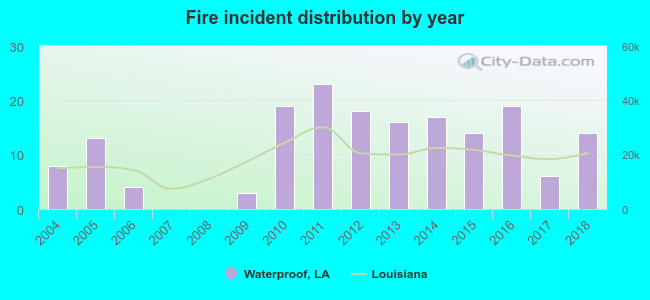 According to the data from the years 2004 - 2018 the average number of fire incidents per year is 12. The highest number of reported fire incidents - 23 took place in 2011, and the least - 0 in 2007. The data has a growing trend.
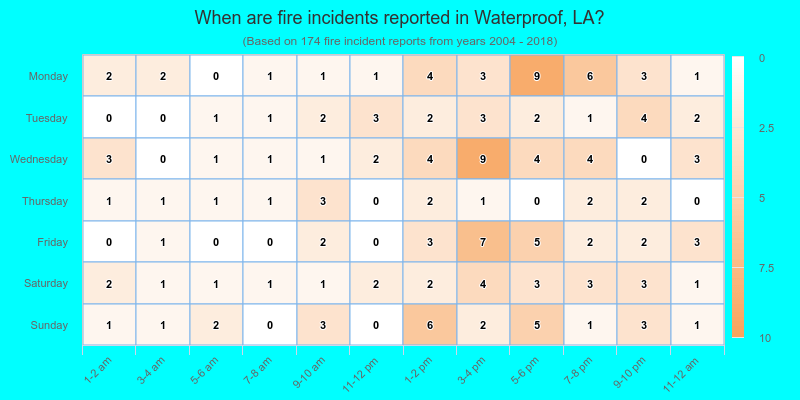
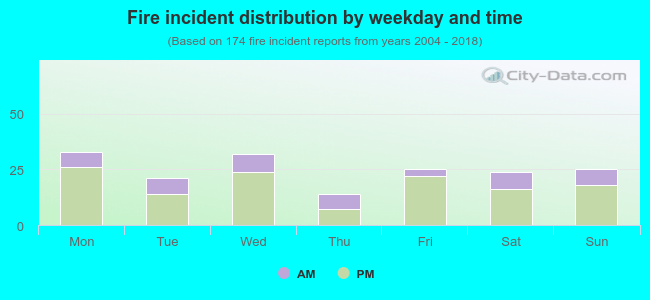 27.0% incidents where reported in the morning and 73.0% in the evening. The most fires (19.0%) took place on Monday, and the least (8.0%) on Thursday.
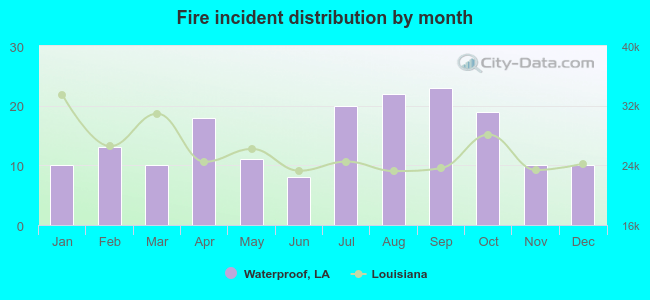 Based on the 174 fire incident reports from years 2004 - 2018 most fires (13.2%) took place during September, and the least (4.6%) in June.
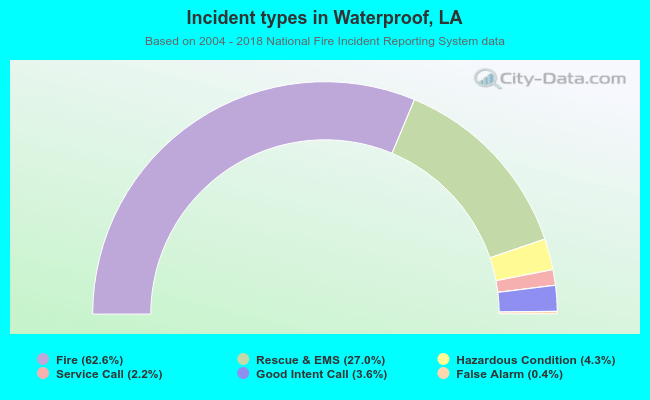 Out of all 278 cases reported during the years 2004 - 2018, the most belonged to the categories: Fire (62.6%), Overpressure Rupture (27.0%), and Rescue & EMS (4.3%).
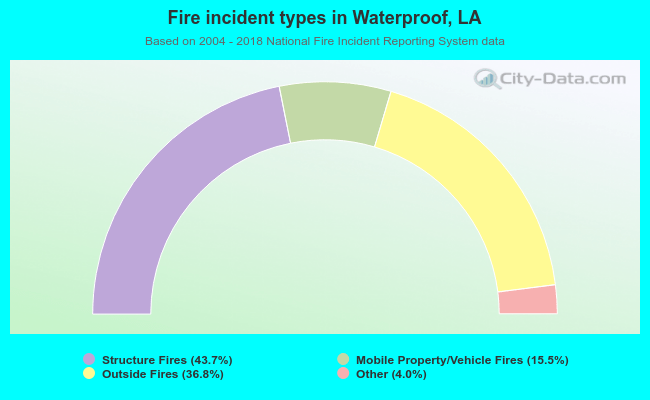 When looking into fire subcategories, the most incidents belonged to: Structure Fires (43.7%), and Outside Fires (36.8%).