| Fire incidents reported |
|---|
| Sreet name | Count |
|---|
| 1651 HWY | 34 | | BEULAH HEIGHTS RD | 20 | | 27 HWY | 18 | | 700 HWY | 18 | | HWY 1651 | 14 | | N HWY 27 | 14 | | 478 HWY | 12 | | BEULAH HEIGHTS | 12 | | PIG SKIN RD | 12 | | HWY 1045 | 8 | | NEW LIBERTY RD | 8 | | SANDHILL RD | 8 | | STRUNK RIDGE RD | 8 | | 1045 HWY | 6 | | BEULAH HEIGHTS RD | 6 | | HWY 700 | 6 | | MAIN STREET | 6 | | N HWY 1651 | 6 | | NORTH HWY 27 | 6 | | US 27 HWY | 6 | | WEBSTER RD | 6 | | WIBORG LOOP | 6 | | WINDING RIDGE RD | 6 | | 1013 WIBORG LOOP | 4 | | 27 | 4 |
| | | Fire incidents reported |
|---|
| Sreet name | Count |
|---|
| 68 T BRANCH RD | 4 | | ANDY COX RD | 4 | | BEULAH HEIGHTS RD | 4 | | BRIDGE RD | 4 | | CATRON RD | 4 | | CHILDERS RIDGE | 4 | | DOC WEST RD | 4 | | GEORGE JONES RD | 4 | | HAROLD BRYANT RD | 4 | | HOLLAWAY CEMETERY RD | 4 | | JODY JONES RD | 4 | | LICK CREEK RD | 4 | | NEW LIBERTY ROAD | 4 | | PEEL DOGWOOD ROAD | 4 | | S HWY 1651 | 4 | | SANDHILL RD | 4 | | SANDHILL RD. | 4 | | SANDHILL ROAD | 4 | | STRUNK RIDGE ROAD | 4 | | TOM ROBERTS | 4 | | TUNNEL RIDGE | 4 | | US 27 | 4 | | WILLIAMSBURG ST | 4 | | WORLEY HILL TOP | 4 | | 114 LOUDERMILK RD | 2 |
|
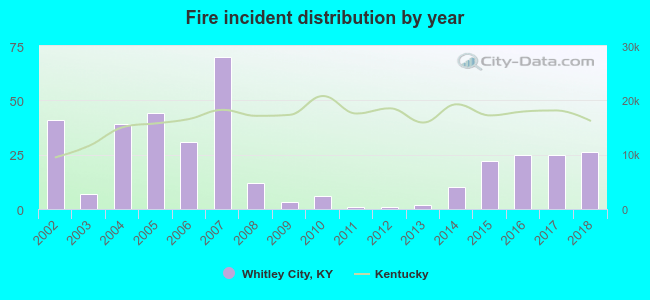 According to the data from the years 2002 - 2018 the average number of fires per year is 21. The highest number of reported fire incidents - 70 took place in 2007, and the least - 1 in 2011. The data has a dropping trend.
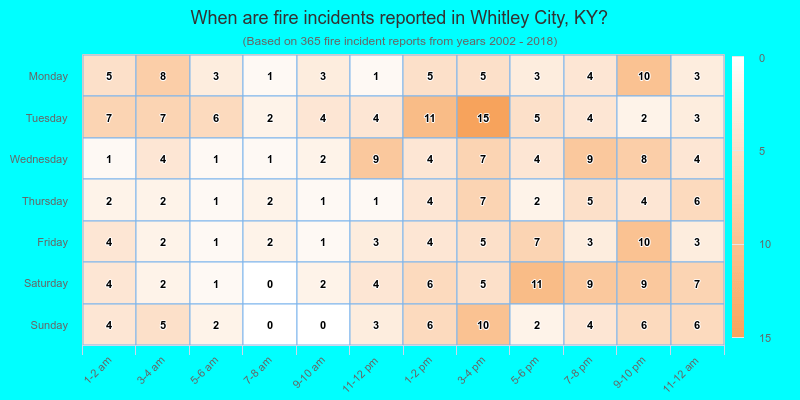
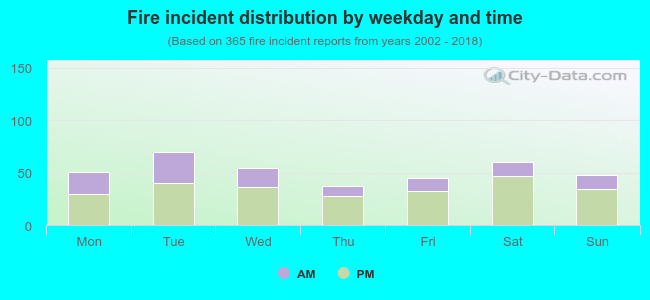 32.3% incidents where reported in the morning and 67.7% in the evening. The most fires (19.2%) took place on Tuesday, and the least (10.1%) on Thursday.
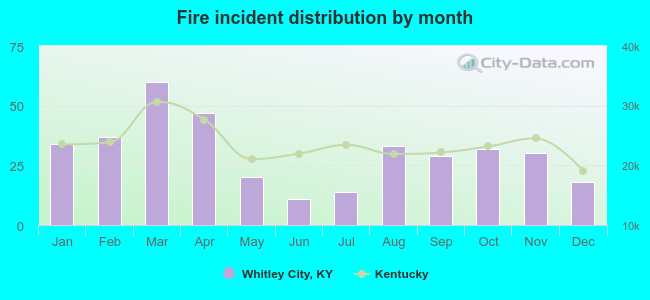 According to the 365 reports from years 2002 - 2018 most fires (16.4%) took place during March, and the least (3.0%) in June.
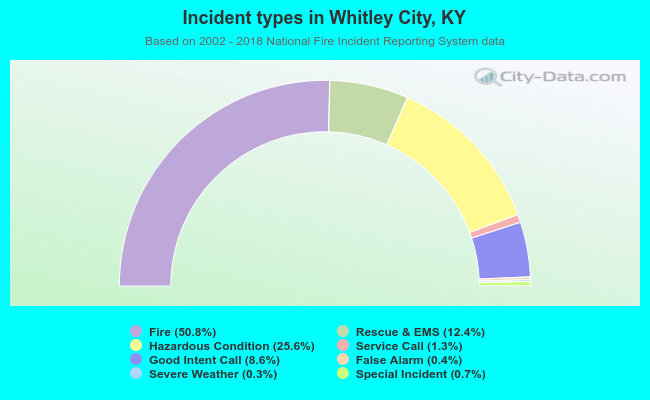 Out of all 719 cases reported during the years 2002 - 2018, the most belonged to the categories: Fire (50.8%), Rescue & EMS (25.6%), and Overpressure Rupture (12.4%).
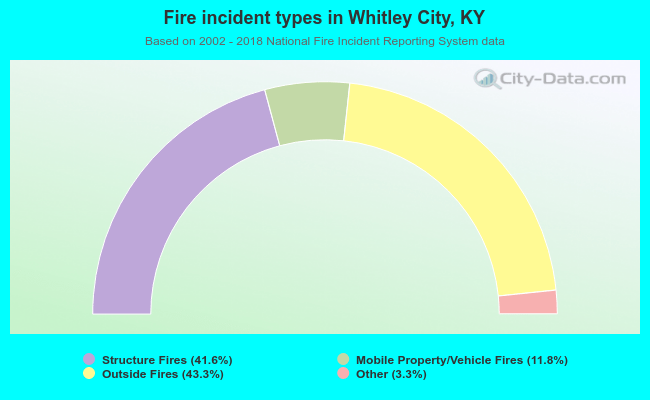 When looking into fire subcategories, the most reports belonged to: Outside Fires (43.3%), and Structure Fires (41.6%).