Housing density: 736 houses/condos per square mile
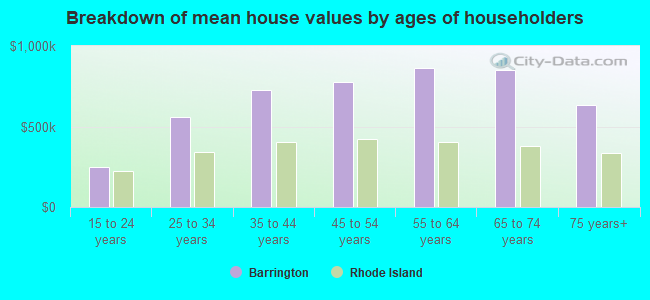
Median price asked for vacant for-sale houses and condos in 2022 in this county: $225,341.
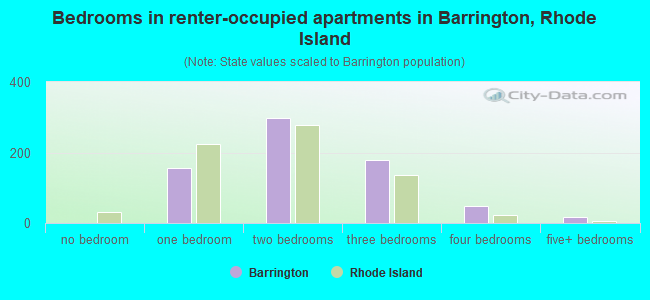
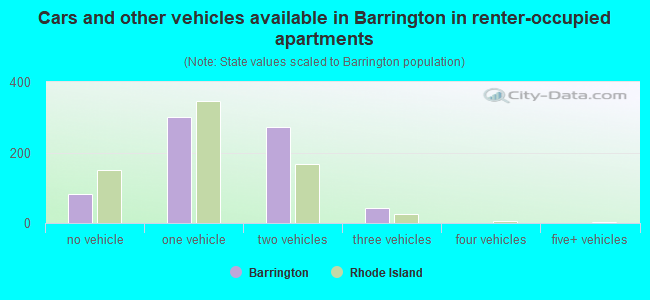
Median contract rent in 2022: $1,435 (lower quartile is $1,133, upper quartile is over $2,000)
Median rent asked for vacant for-rent units in 2022: $1,480
Median gross rent in Barrington, RI in 2022: $1,670
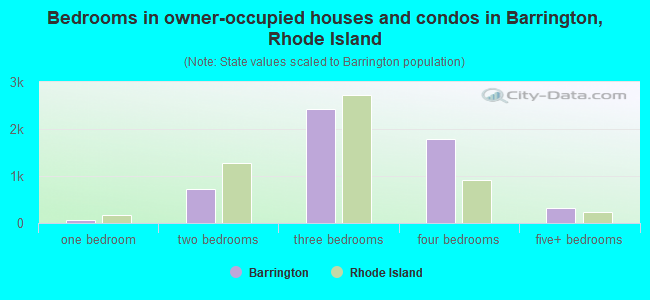
Housing units in Barrington with a mortgage: 3,617 (260 second mortgage, 688 home equity loan, 6 both second mortgage and home equity loan) Houses without a mortgage: 1,530
In family households: 38,802 (8,935 male householders, 3,815 female householders)
10,221 spouses, 13,383 children (12,608 natural, 369 adopted, 406 stepchildren), 566 grandchildren, 257 brothers or sisters, 401 parents, foster children, 243 other relatives, 674 non-relatives
In nonfamily households: 7,831 (2,592 male householders (1,979 living alone)), 3,808 female householders (3,267 living alone)), 1,431 nonrelatives
In group quarters: 3,242 (660 institutionalized population)
8,970 married couples with children.
2,002 single-parent households (367 men, 1,635 women).
91.2% of residents of Barrington speak English at home.
1.8% of residents speak Spanish at home (83% speak English very well, 15% speak English well, 3% don't speak English at all).
5.6% of residents speak other Indo-European language at home (74% speak English very well, 19% speak English well, 7% speak English not well).
1.0% of residents speak Asian or Pacific Island language at home (85% speak English very well, 15% speak English well).
0.4% of residents speak other language at home (77% speak English very well, 10% speak English well, 13% speak English not well).
Foreign born population: 1,257 (7.1%)
(68.3% of them are naturalized citizens)
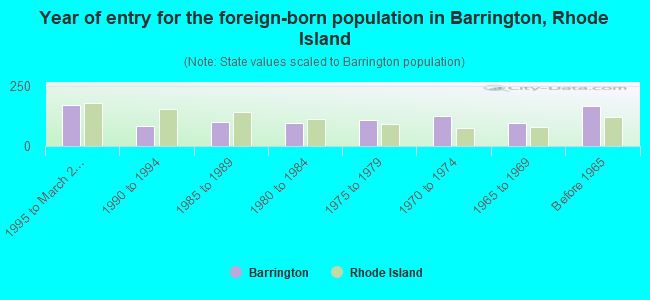
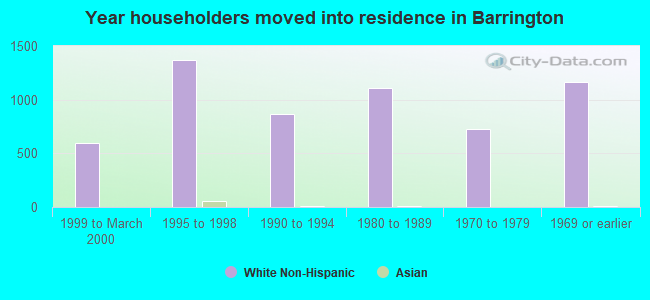
Year of entry for the foreign-born population in Barrington, Rhode Island
1721995 to March 2000
811990 to 1994
1011985 to 1989
951980 to 1984
1061975 to 1979
1261970 to 1974
961965 to 1969
168Before 1965
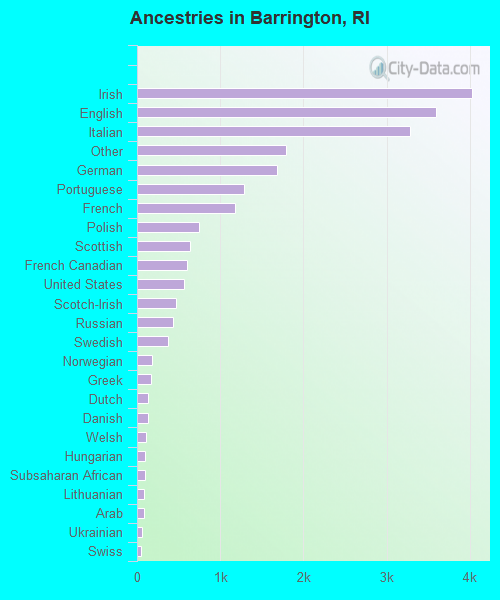
First ancestries reported:
Irish: 4,028 (18.4%)
English: 3,587 (16.4%)
Italian: 3,284 (15.0%)
Other: 1,788 (8.2%)
German: 1,687 (7.7%)
Portuguese: 1,291 (5.9%)
French: 1,182 (5.4%)
Polish: 746 (3.4%)
Scottish: 634 (2.9%)
French Canadian: 602 (2.7%)
United States: 561 (2.6%)
Scotch-Irish: 467 (2.1%)
Russian: 432 (2.0%)
Swedish: 368 (1.7%)
Norwegian: 176 (0.8%)
Greek: 164 (0.7%)
Dutch: 135 (0.6%)
Danish: 129 (0.6%)
Welsh: 105 (0.5%)
Hungarian: 96 (0.4%)
Subsaharan African: 91 (0.4%)
Lithuanian: 86 (0.4%)
Arab: 85 (0.4%)
Ukrainian: 65 (0.3%)
Swiss: 46 (0.2%)
West Indian: 40 (0.2%)
Slovak: 32 (0.1%)
Czech: 15 (0.07%)
Most common places of birth for foreign-born residents (%):
Portugal
Barrington:
16.4% (155)
Rhode Island:
17.6% (21,016)
Canada
Barrington:
10.6% (100)
Rhode Island:
3.4% (4,015)
China, excluding Hong Kong and Taiwan
Barrington:
9.3% (88)
Rhode Island:
1.6% (1,954)
United Kingdom
Barrington:
7.5% (71)
Rhode Island:
2.6% (3,120)
Greece
Barrington:
6.5% (61)
Rhode Island:
0.9% (1,014)
Germany
Barrington:
4.6% (43)
Rhode Island:
1.7% (1,982)
Italy
Barrington:
3.4% (32)
Rhode Island:
3.8% (4,502)
Other Eastern Africa
Barrington:
2.8% (26)
Rhode Island:
0.3% (309)
Mexico
Barrington:
2.6% (25)
Rhode Island:
2.1% (2,510)
Korea
Barrington:
2.5% (24)
Rhode Island:
1.2% (1,404)
Jamaica
Barrington:
2.3% (22)
Rhode Island:
0.5% (555)
France
Barrington:
2.1% (20)
Rhode Island:
0.6% (730)
Russia
Barrington:
1.9% (18)
Rhode Island:
0.8% (900)
Venezuela
Barrington:
1.8% (17)
Rhode Island:
0.5% (606)
Argentina
Barrington:
1.6% (15)
Rhode Island:
0.3% (341)
Place of birth for U.S.-born residents:
This state: 8,711
Other state: 7,076
Northeast: 5,090
Midwest: 722
South: 860
West: 404
67% of Barrington residents lived in the same house 5 years ago. Out of people who lived in different houses, 31% lived in this county. Out of people who lived in different counties, 45% lived in Rhode Island.
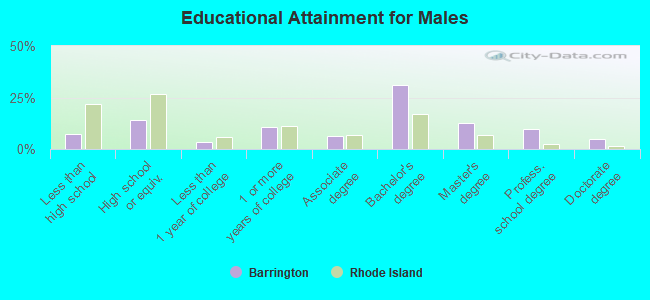
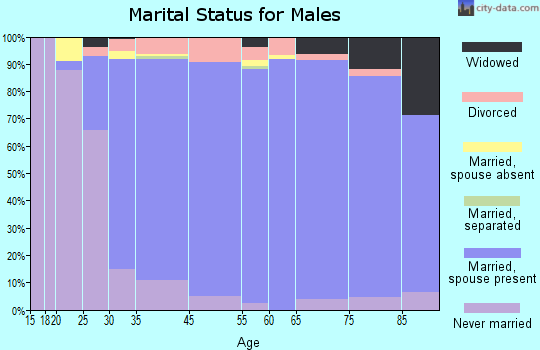
Education attainment for males 25 years and older:
No schooling: 32
Nursery to 4th grade: 3
5th and 6th grade: 5
7th and 8th grade: 56
9th grade: 26
10th grade: 111
11th grade: 74
12th grade, no diploma: 72
High school graduate (or equivalency): 747
Less than 1 year of college: 179
Some college more than 1 year, no degree: 571
Associate degree: 334
Bachelor's degree: 1,630
Master's degree: 672
Professional school degree: 507
Doctorate degree: 244
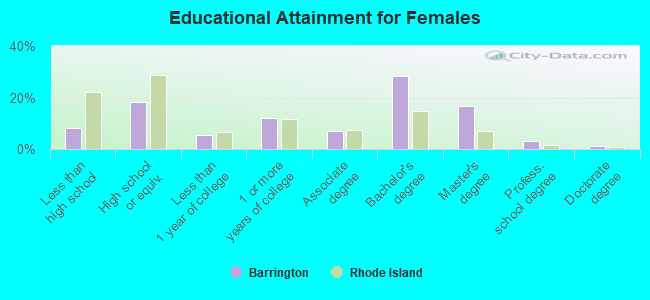
Education attainment for females 25 years and older:
No schooling: 15
Nursery to 4th grade: 9
5th and 6th grade: 34
7th and 8th grade: 68
9th grade: 73
10th grade: 85
11th grade: 74
12th grade, no diploma: 118
High school graduate (or equivalency): 1,089
Less than 1 year of college: 333
Some college more than 1 year, no degree: 705
Associate degree: 425
Bachelor's degree: 1,676
Master's degree: 988
Professional school degree: 174
Doctorate degree: 66
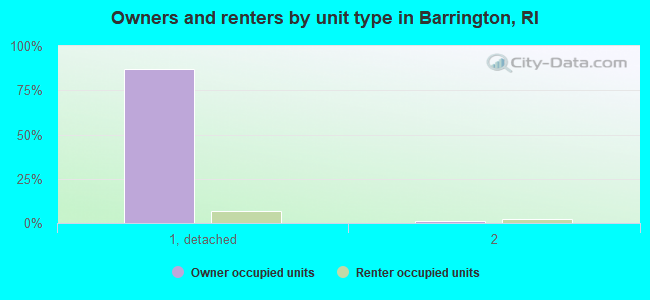
Housing units in structures:
One, detached: 5,763
One, attached: 40
Two: 207
3 or 4: 49
10 to 19: 13
20 to 49: 56
50 or more: 71
Housing units lacking complete plumbing facilities: 0.1%
Housing units lacking complete kitchen facilities: 0.1%