Barrington, Rhode Island
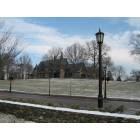
Barrington: BARRINGTON,RI -TOWN HALL
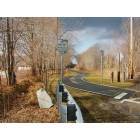
Barrington: This is a fall photo of our 14 mile bike path a renovated old train track that runs through town along the coast. It's one of the best features in our lovely town.
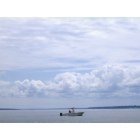
Barrington: The beach patrol boat, at Barrington beach 7-09-09

Barrington: Autumn Harbour Sunset

Barrington: From Freemont Ave, Bristol, Rhode Island, looking west across the upper Nagagansett Bay, 04 Nov 2012, 17:43:56
- add
your
Submit your own pictures of this place and show them to the world
- OSM Map
- General Map
- Google Map
- MSN Map
| Males: 8,076 | |
| Females: 8,496 |
| Median resident age: | 40.2 years |
| Rhode Island median age: | 36.7 years |
Zip codes: 02806.
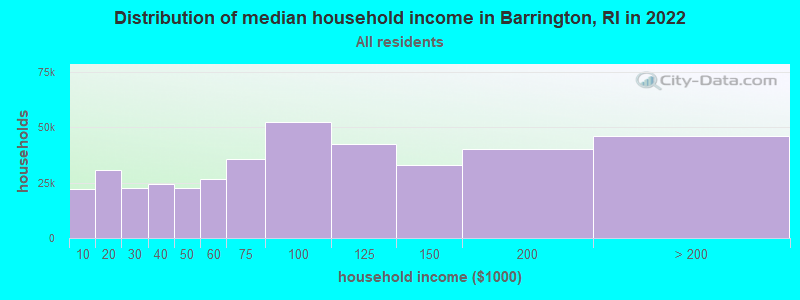
| Barrington: | $156,578 |
| RI: | $81,854 |
Estimated per capita income in 2022: $78,968 (it was $35,881 in 2000)
Barrington CDP income, earnings, and wages data
Estimated median house or condo value in 2022: $603,043 (it was $198,600 in 2000)
| Barrington: | $603,043 |
| RI: | $383,900 |
Mean prices in 2022: all housing units: $665,820; detached houses: $698,341; townhouses or other attached units: $538,038; in 2-unit structures: $373,570; in 3-to-4-unit structures: $528,043; in 5-or-more-unit structures: $203,912
Detailed information about poverty and poor residents in Barrington, RI


- 16,09295.7%White alone
- 2961.8%Asian alone
- 1771.1%Hispanic
- 1110.7%Black alone
- 1150.7%Two or more races
- 170.1%American Indian alone
- 110.07%Other race alone
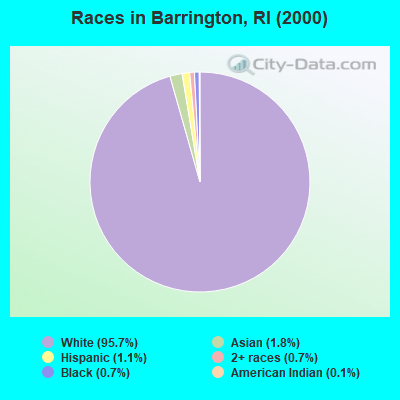
Races in Barrington detailed stats: ancestries, foreign born residents, place of birth
According to our research of Rhode Island and other state lists, there were 3 registered sex offenders living in Barrington, Rhode Island as of April 27, 2024.
The ratio of all residents to sex offenders in Barrington is 5,524 to 1.
The ratio of registered sex offenders to all residents in this city is much lower than the state average.
Type |
2009 |
2010 |
2011 |
2012 |
2013 |
2014 |
2015 |
2016 |
2017 |
2018 |
2019 |
2020 |
2021 |
2022 |
|---|---|---|---|---|---|---|---|---|---|---|---|---|---|---|
| Murders (per 100,000) | 0 (0.0) | 0 (0.0) | 0 (0.0) | 0 (0.0) | 0 (0.0) | 0 (0.0) | 0 (0.0) | 0 (0.0) | 0 (0.0) | 0 (0.0) | 0 (0.0) | 0 (0.0) | 0 (0.0) | 0 (0.0) |
| Rapes (per 100,000) | 0 (0.0) | 1 (6.1) | 1 (6.1) | 2 (12.3) | 2 (12.3) | 1 (6.1) | 5 (30.8) | 1 (6.2) | 7 (42.9) | 6 (37.2) | 2 (12.4) | 2 (12.5) | 7 (42.3) | 4 (23.0) |
| Robberies (per 100,000) | 0 (0.0) | 2 (12.3) | 0 (0.0) | 3 (18.4) | 1 (6.1) | 0 (0.0) | 1 (6.2) | 2 (12.3) | 0 (0.0) | 1 (6.2) | 1 (6.2) | 0 (0.0) | 0 (0.0) | 0 (0.0) |
| Assaults (per 100,000) | 2 (12.2) | 2 (12.3) | 7 (43.0) | 1 (6.1) | 1 (6.1) | 3 (18.3) | 1 (6.2) | 1 (6.2) | 4 (24.5) | 1 (6.2) | 1 (6.2) | 1 (6.3) | 3 (18.1) | 4 (23.0) |
| Burglaries (per 100,000) | 38 (232.4) | 40 (245.2) | 41 (251.7) | 30 (184.4) | 49 (300.9) | 39 (238.5) | 21 (129.4) | 19 (117.2) | 26 (159.4) | 15 (93.1) | 14 (87.0) | 15 (93.8) | 8 (48.3) | 13 (74.9) |
| Thefts (per 100,000) | 172 (1,052) | 156 (956.5) | 138 (847.1) | 146 (897.5) | 162 (994.7) | 164 (1,003) | 130 (801.1) | 96 (591.9) | 101 (619.4) | 94 (583.4) | 78 (484.8) | 103 (644.3) | 113 (682.1) | 78 (449.2) |
| Auto thefts (per 100,000) | 4 (24.5) | 7 (42.9) | 3 (18.4) | 3 (18.4) | 3 (18.4) | 7 (42.8) | 4 (24.6) | 2 (12.3) | 0 (0.0) | 4 (24.8) | 1 (6.2) | 2 (12.5) | 4 (24.1) | 6 (34.6) |
| Arson (per 100,000) | 0 (0.0) | 3 (18.4) | 2 (12.3) | 1 (6.1) | 1 (6.1) | 1 (6.1) | 22 (135.6) | 2 (12.3) | 2 (12.3) | 1 (6.2) | 0 (0.0) | 1 (6.3) | 0 (0.0) | 1 (5.8) |
| City-Data.com crime index | 62.7 | 69.9 | 66.5 | 66.9 | 75.2 | 68.8 | 70.8 | 42.7 | 75.2 | 64.7 | 39.0 | 44.6 | 70.0 | 49.0 |
The City-Data.com crime index weighs serious crimes and violent crimes more heavily. Higher means more crime, U.S. average is 246.1. It adjusts for the number of visitors and daily workers commuting into cities.
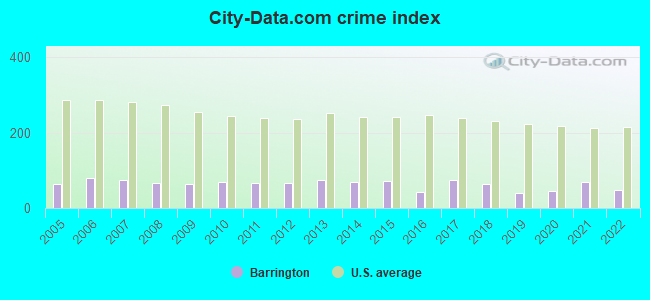
Crime rate in Barrington detailed stats: murders, rapes, robberies, assaults, burglaries, thefts, arson
Full-time law enforcement employees in 2021, including police officers: 29 (23 officers - 22 male; 1 female).
| Officers per 1,000 residents here: | 1.39 |
| Rhode Island average: | 2.27 |
 Recent articles from our blog. Our writers, many of them Ph.D. graduates or candidates, create easy-to-read articles on a wide variety of topics.

 | Barrington residents want the BLACK LIVES MATTER flag removed (180 replies) |
| Barrington info (43 replies) |
| Barrington High School threat (18 replies) |
| Demolition Set to Take Place at Historic Barrington Estate Raises Concerns (13 replies) |
| Barrington Information, Please! (41 replies) |
| Top Democrats Flock to One of Whitest and Most Affluent RI Communities (138 replies) |
Latest news from Barrington, RI collected exclusively by city-data.com from local newspapers, TV, and radio stations
Ancestries: Irish (23.9%), English (21.3%), Italian (19.5%), German (10.0%), Portuguese (7.7%), French (7.0%).
Current Local Time: EST time zone
Incorporated in 1770
Elevation: 50 feet
Land area: 8.42 square miles.
Population density: 1,969 people per square mile (low).
945 residents are foreign born (2.9% Europe, 1.1% Asia, 0.8% Latin America, 0.6% North America).
| This place: | 5.6% |
| Rhode Island: | 11.4% |
| Barrington CDP: | 2.1% ($4,200) |
| Rhode Island: | 1.9% ($2,507) |
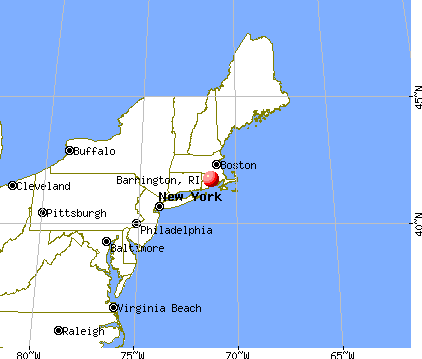
Nearest city with pop. 50,000+: Warwick, RI  (5.3 miles , pop. 85,808).
Nearest city with pop. 200,000+: Boston, MA (41.6 miles , pop. 589,141).
Nearest city with pop. 1,000,000+: Bronx, NY (146.6 miles , pop. 1,332,650).
Nearest cities:
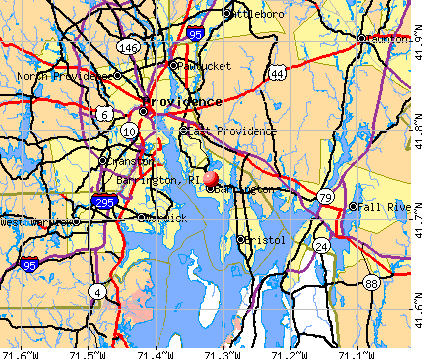
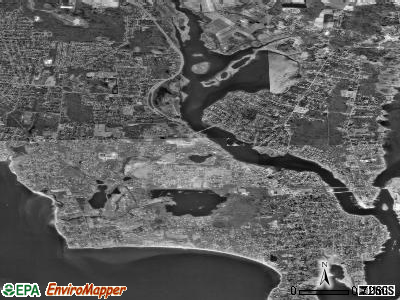
), Latitude: 41.75 N, Longitude: 71.32 W
Daytime population change due to commuting: -4,338 (-25.8%)
Workers who live and work in this place: 1,579 (20.2%)
Barrington, Rhode Island accommodation & food services, waste management - Economy and Business Data
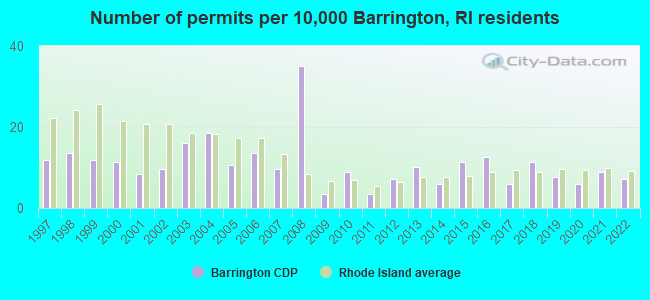
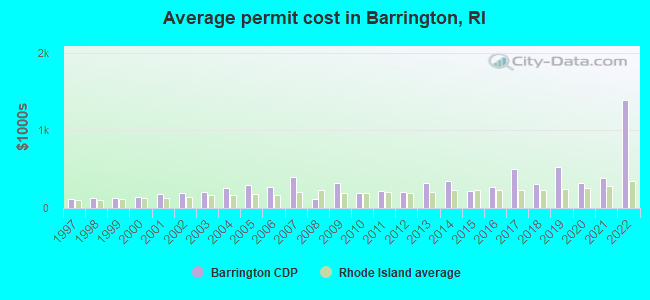
Single-family new house construction building permits:
- 2022: 12 buildings, average cost: $1,390,200
- 2021: 15 buildings, average cost: $382,500
- 2020: 10 buildings, average cost: $326,500
- 2019: 13 buildings, average cost: $526,900
- 2018: 19 buildings, average cost: $308,100
- 2017: 10 buildings, average cost: $500,300
- 2016: 21 buildings, average cost: $265,600
- 2015: 19 buildings, average cost: $218,700
- 2014: 10 buildings, average cost: $342,600
- 2013: 17 buildings, average cost: $325,400
- 2012: 12 buildings, average cost: $208,900
- 2011: 6 buildings, average cost: $221,300
- 2010: 15 buildings, average cost: $191,900
- 2009: 6 buildings, average cost: $318,500
- 2008: 59 buildings, average cost: $116,000
- 2007: 16 buildings, average cost: $401,000
- 2006: 23 buildings, average cost: $270,400
- 2005: 18 buildings, average cost: $289,800
- 2004: 31 buildings, average cost: $251,100
- 2003: 27 buildings, average cost: $201,900
- 2002: 16 buildings, average cost: $187,200
- 2001: 14 buildings, average cost: $181,200
- 2000: 19 buildings, average cost: $141,600
- 1999: 20 buildings, average cost: $127,100
- 1998: 23 buildings, average cost: $132,900
- 1997: 20 buildings, average cost: $116,200
| Here: | 2.7% |
| Rhode Island: | 3.3% |
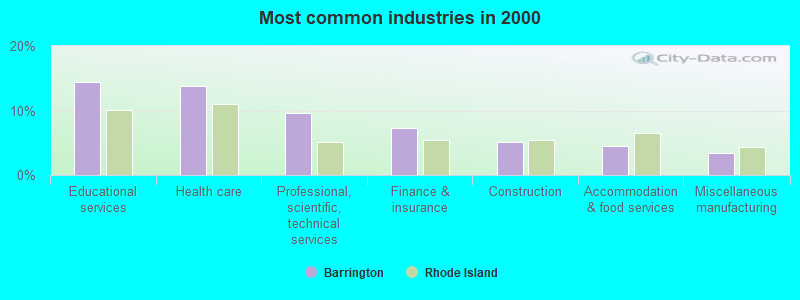
- Educational services (14.4%)
- Health care (13.9%)
- Professional, scientific, technical services (9.6%)
- Finance & insurance (7.3%)
- Construction (5.1%)
- Accommodation & food services (4.5%)
- Miscellaneous manufacturing (3.4%)
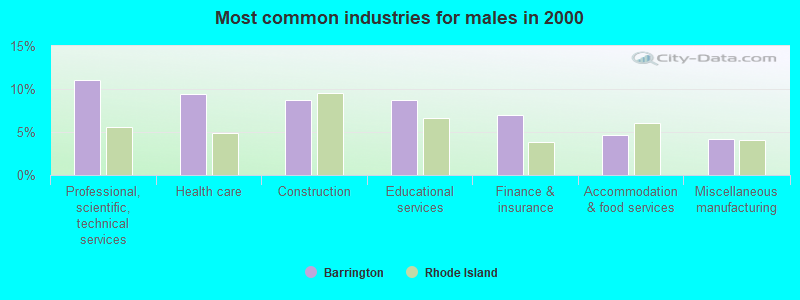
- Professional, scientific, technical services (11.1%)
- Health care (9.5%)
- Construction (8.8%)
- Educational services (8.8%)
- Finance & insurance (7.0%)
- Accommodation & food services (4.7%)
- Miscellaneous manufacturing (4.2%)
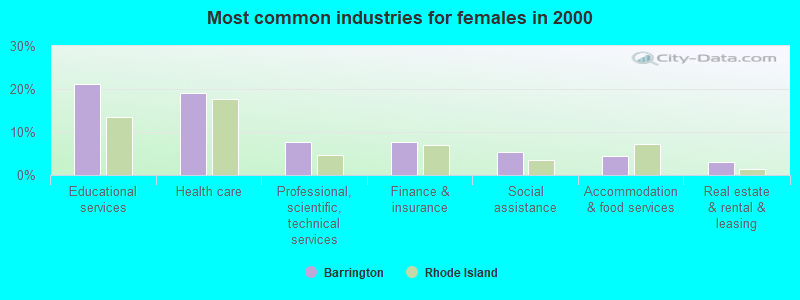
- Educational services (21.2%)
- Health care (19.1%)
- Professional, scientific, technical services (7.7%)
- Finance & insurance (7.7%)
- Social assistance (5.4%)
- Accommodation & food services (4.3%)
- Real estate & rental & leasing (3.0%)
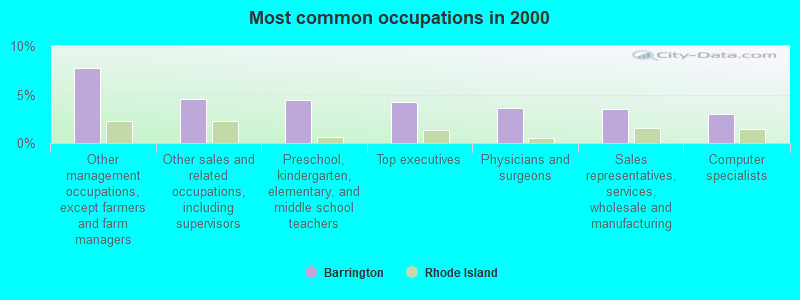
- Other management occupations, except farmers and farm managers (7.8%)
- Other sales and related occupations, including supervisors (4.5%)
- Preschool, kindergarten, elementary, and middle school teachers (4.4%)
- Top executives (4.2%)
- Physicians and surgeons (3.6%)
- Sales representatives, services, wholesale and manufacturing (3.5%)
- Computer specialists (3.0%)
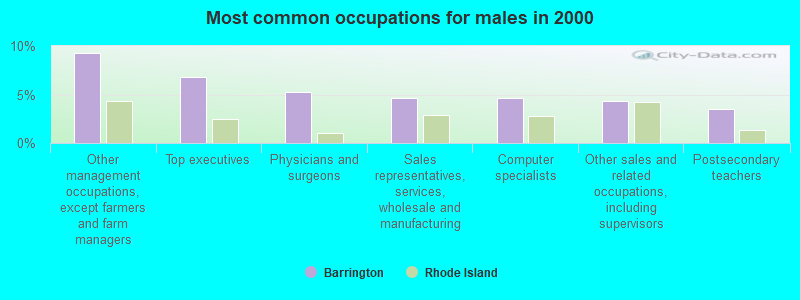
- Other management occupations, except farmers and farm managers (9.3%)
- Top executives (6.8%)
- Physicians and surgeons (5.2%)
- Sales representatives, services, wholesale and manufacturing (4.7%)
- Computer specialists (4.7%)
- Other sales and related occupations, including supervisors (4.3%)
- Postsecondary teachers (3.5%)
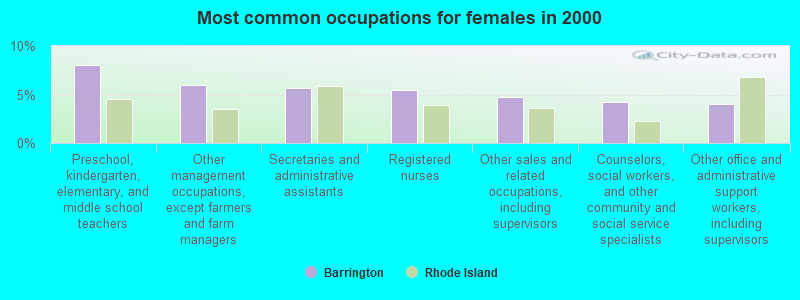
- Preschool, kindergarten, elementary, and middle school teachers (8.1%)
- Other management occupations, except farmers and farm managers (5.9%)
- Secretaries and administrative assistants (5.7%)
- Registered nurses (5.5%)
- Other sales and related occupations, including supervisors (4.7%)
- Counselors, social workers, and other community and social service specialists (4.2%)
- Other office and administrative support workers, including supervisors (4.0%)
Average climate in Barrington, Rhode Island
Based on data reported by over 4,000 weather stations


(lower is better)
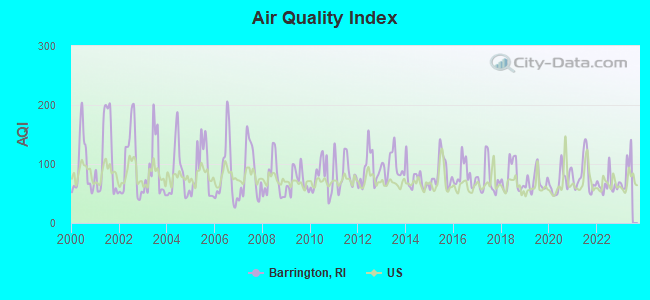
Air Quality Index (AQI) level in 2022 was 65.2. This is about average.
| City: | 65.2 |
| U.S.: | 72.6 |
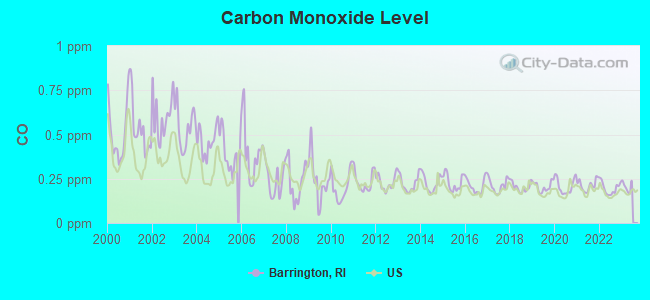
Carbon Monoxide (CO) [ppm] level in 2022 was 0.196. This is better than average. Closest monitor was 7.0 miles away from the city center.
| City: | 0.196 |
| U.S.: | 0.251 |
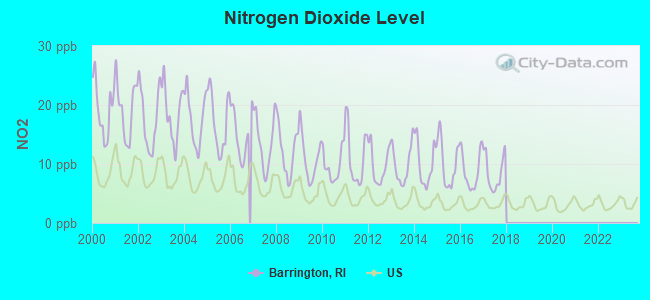
Nitrogen Dioxide (NO2) [ppb] level in 2017 was 8.52. This is significantly worse than average. Closest monitor was 4.5 miles away from the city center.
| City: | 8.52 |
| U.S.: | 5.11 |
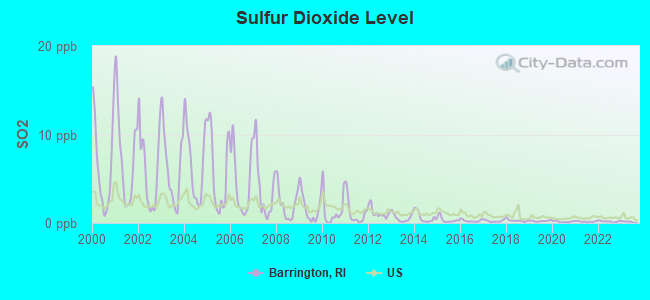
Sulfur Dioxide (SO2) [ppb] level in 2022 was 0.179. This is significantly better than average. Closest monitor was 4.5 miles away from the city center.
| City: | 0.179 |
| U.S.: | 1.515 |
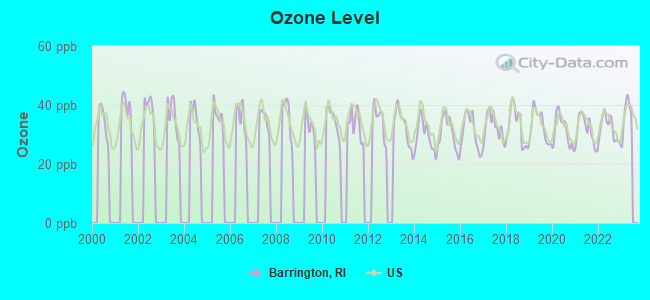
Ozone [ppb] level in 2022 was 32.0. This is about average. Closest monitor was 7.1 miles away from the city center.
| City: | 32.0 |
| U.S.: | 33.3 |
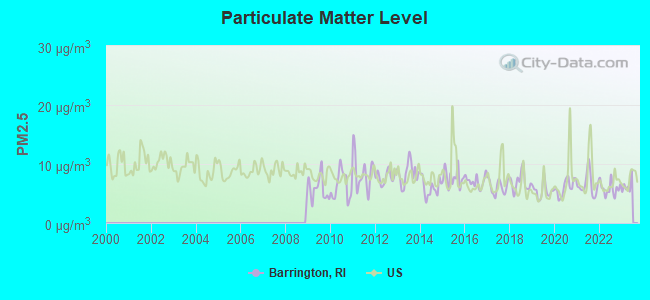
Particulate Matter (PM2.5) [µg/m3] level in 2022 was 5.84. This is better than average. Closest monitor was 6.4 miles away from the city center.
| City: | 5.84 |
| U.S.: | 8.11 |
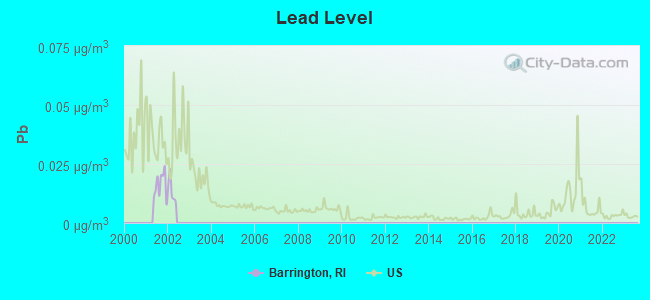
Lead (Pb) [µg/m3] level in 2001 was 0.0160. This is significantly worse than average. Closest monitor was 4.5 miles away from the city center.
| City: | 0.0160 |
| U.S.: | 0.0093 |
Tornado activity:
Barrington-area historical tornado activity is near Rhode Island state average. It is 55% smaller than the overall U.S. average.
On 6/9/1953, a category F4 (max. wind speeds 207-260 mph) tornado 39.8 miles away from the Barrington place center killed 90 people and injured 1228 people and caused between $50,000,000 and $500,000,000 in damages.
On 6/9/1953, a category F3 (max. wind speeds 158-206 mph) tornado 21.9 miles away from the place center injured 17 people and caused between $500,000 and $5,000,000 in damages.
Earthquake activity:
Barrington-area historical earthquake activity is significantly above Rhode Island state average. It is 74% smaller than the overall U.S. average.On 10/7/1983 at 10:18:46, a magnitude 5.3 (5.1 MB, 5.3 LG, 5.1 ML, Class: Moderate, Intensity: VI - VII) earthquake occurred 216.4 miles away from the city center
On 4/20/2002 at 10:50:47, a magnitude 5.3 (5.3 ML, Depth: 3.0 mi) earthquake occurred 225.9 miles away from Barrington center
On 1/19/1982 at 00:14:42, a magnitude 4.7 (4.5 MB, 4.7 MD, 4.5 LG, Class: Light, Intensity: IV - V) earthquake occurred 122.2 miles away from the city center
On 4/20/2002 at 10:50:47, a magnitude 5.2 (5.2 MB, 4.2 MS, 5.2 MW, 5.0 MW) earthquake occurred 225.0 miles away from the city center
On 10/16/2012 at 23:12:25, a magnitude 4.7 (4.7 ML, Depth: 10.0 mi) earthquake occurred 132.5 miles away from Barrington center
On 8/22/1992 at 12:20:32, a magnitude 4.8 (4.8 MB, 3.8 MS, 4.7 LG, Depth: 6.2 mi) earthquake occurred 190.0 miles away from the city center
Magnitude types: regional Lg-wave magnitude (LG), body-wave magnitude (MB), duration magnitude (MD), local magnitude (ML), surface-wave magnitude (MS), moment magnitude (MW)
Natural disasters:
The number of natural disasters in Bristol County (16) is near the US average (15).Major Disasters (Presidential) Declared: 8
Emergencies Declared: 7
Causes of natural disasters: Hurricanes: 6, Blizzards: 3, Snowstorms: 3, Floods: 2, Storms: 2, Winter Storms: 2, Snow: 1, Snowfall: 1, Tropical Storm: 1, Wind: 1, Other: 1 (Note: some incidents may be assigned to more than one category).
Hospitals and medical centers near Barrington:
- GRACE BARKER NURSING CENTER INC. (Nursing Home, about 4 miles away; WARREN, RI)
- WARREN SKILLED NURSING AND REHABILITATION (Nursing Home, about 4 miles away; WARREN, RI)
- CRESTWOOD NURSING AND CONV HOME INC (Nursing Home, about 4 miles away; WARREN, RI)
- CULTURED CARE, INC (Home Health Center, about 4 miles away; SWANSEA, MA)
- AVALON NURSING HOME (Nursing Home, about 4 miles away; WARWICK, RI)
- ORCHARD VIEW MANOR NURSING AND REHABILITATION CENTER (Nursing Home, about 4 miles away; EAST PROVIDENCE, RI)
- OPTION CARE (Home Health Center, about 4 miles away; EAST PROVIDENCE, RI)
Amtrak station near Barrington:
Colleges/universities with over 2000 students nearest to Barrington:
- Johnson & Wales University-Providence (about 8 miles; Providence, RI; Full-time enrollment: 10,898)
- Brown University (about 8 miles; Providence, RI; FT enrollment: 8,458)
- Rhode Island School of Design (about 8 miles; Providence, RI; FT enrollment: 2,714)
- Roger Williams University (about 8 miles; Bristol, RI; FT enrollment: 4,375)
- Community College of Rhode Island (about 9 miles; Warwick, RI; FT enrollment: 10,500)
- Providence College (about 10 miles; Providence, RI; FT enrollment: 4,312)
- Rhode Island College (about 11 miles; Providence, RI; FT enrollment: 7,189)
Public high school in Barrington:
- BARRINGTON HIGH SCHOOL (Students: 1,129, Location: 220 LINCOLN AVENUE, Grades: 9-12)
Private high schools in Barrington:
Public elementary/middle schools in Barrington:
- BARRINGTON MIDDLE SCHOOL (Students: 835, Location: 261 MIDDLE HIGHWAY, Grades: 6-8)
- HAMPDEN MEADOWS SCHOOL (Students: 510, Location: 297 NEW MEADOW ROAD, Grades: 4-5)
- NAYATT SCHOOL (Students: 363, Location: 400 NAYATT ROAD, Grades: PK-3)
- PRIMROSE HILL SCHOOL (Students: 346, Location: 60 MIDDLE HIGHWAY, Grades: PK-3)
- SOWAMS ELEMENTARY SCHOOL (Students: 261, Location: 364 SOWAMS ROAD, Grades: KG-3)
Private elementary/middle school in Barrington:
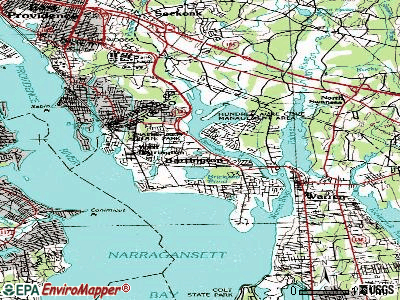
Points of interest:
Notable locations in Barrington: Walkers Farm (A), Nayatt Landing (B), Kelleys Ferry (C), Rhode Island Country Club (D), Barrington Yacht Club (E), Hampden Meadows Volunteer Fire Company (F), Barrington Community Center (G), Barrington Preservation Society Museum (H), Barrington Town Hall (I), Barrington Public Library (J), Belton Court (K), Barrington Police Department (L), Barrington Fire Department (M), Barrington Early Childhood Center (N), Nyatt Hall (O), Zion Bible Institute Library (P). Display/hide their locations on the map
Churches in Barrington include: Barrington Baptist Church (A), Barrington Congregational Church (B), Barrington Presbyterian Church (C), Barrington United Methodist Church (D), Carmelite Monastery (E), Chapin Memorial Chapel (F), Holy Angels Roman Catholic Church (G), Saint Mathews Episcopal Church (H), Saint Lukes Roman Catholic Church (I). Display/hide their locations on the map
Cemeteries: Princes Hill Cemetery (1), Tyler Point Cemetery (2). Display/hide their locations on the map
Lakes and reservoirs: Prince Pond (A), Echo Lake (B), Volpes Pond (C), Brickyard Pond (D). Display/hide their locations on the map
Streams, rivers, and creeks: Annawomscutt Brook (A), Mussachuck Creek (B), Barrington River (C). Display/hide their locations on the map
Parks in Barrington include: Peck Center Playground (1), Veterans Memorial Park (2), Sowans Playground (3), Barrington Civic Center Historic District (4), Haines Memorial State Park (5), Osamequin Nature Trails and Bird Sanctuary (6). Display/hide their locations on the map
Beach: Barrington Beach (A). Display/hide its location on the map
Birthplace of: Edward F. Welch, Jr. - Navy admiral, Demetris Nichols - College basketball player (Syracuse Orange), Mark McAndrew - College basketball player (Brown Bears), Winfield Parks - Photographer.
Drinking water stations with addresses in Barrington and their reported violations in the past:
CONE RIDGE APTS (Serves NH, Population served: 30, Groundwater):Past monitoring violations:
- Failure To Address Deficiency - In NOV-15-2012, Contaminant: GROUNDWATER RULE. Follow-up actions: St Public Notif requested (DEC-11-2012), St Formal NOV issued (DEC-11-2012), St Public Notif received (JAN-08-2013), St Compliance achieved (APR-04-2013)
- Lead Consumer Notice - In JUL-01-2012, Contaminant: Lead and Copper Rule. Follow-up actions: St Violation/Reminder Notice (JUL-10-2012), St Compliance achieved (JUL-16-2012)
- 2 routine major monitoring violations
| This place: | 2.7 people |
| Rhode Island: | 2.5 people |
| This place: | 78.4% |
| Whole state: | 65.3% |
| This place: | 2.6% |
| Whole state: | 5.7% |
Likely homosexual households (counted as self-reported same-sex unmarried-partner households)
- Lesbian couples: 0.3% of all households
- Gay men: 0.2% of all households
| This place: | 3.4% |
| Whole state: | 11.9% |
| This place: | 1.3% |
| Whole state: | 5.4% |
People in group quarters in Barrington in 2000:
- 376 people in college dormitories (includes college quarters off campus)
- 15 people in homes for the mentally retarded
- 14 people in religious group quarters
- 8 people in other group homes
Banks with branches in Barrington (2011 data):
- RBS Citizens, National Association: Peck Corners Branch at 965 County Road, branch established on 1957/04/26; Barrington Branch at 184 County Road, branch established on 1953/07/10. Info updated 2007/09/19: Bank assets: $106,940.6 mil, Deposits: $75,690.2 mil, headquarters in Providence, RI, positive income, 1135 total offices, Holding Company: Uk Financial Investments Limited
- BankNewport: Barrington Branch at 326 Country Road, branch established on 1969/05/01. Info updated 2006/11/03: Bank assets: $1,098.1 mil, Deposits: $885.1 mil, headquarters in Newport, RI, positive income, Mortgage Lending Specialization, 13 total offices, Holding Company: Oceanpoint Financial Partners, Mhc
- Webster Bank, National Association: Barrington Branch at 262 County Road, branch established on 2005/09/12. Info updated 2008/12/23: Bank assets: $18,674.3 mil, Deposits: $13,861.5 mil, headquarters in Waterbury, CT, positive income, Commercial Lending Specialization, 167 total offices, Holding Company: Webster Financial Corporation
- Bank of America, National Association: Barrington Branch at 257 County Road, branch established on 1970/08/17. Info updated 2009/11/18: Bank assets: $1,451,969.3 mil, Deposits: $1,077,176.8 mil, headquarters in Charlotte, NC, positive income, 5782 total offices, Holding Company: Bank Of America Corporation
- TD Bank, National Association: Barrington Ri, 231 County Road Store Branch at 231 County Road, branch established on 2010/11/12. Info updated 2010/10/04: Bank assets: $188,912.6 mil, Deposits: $153,149.8 mil, headquarters in Wilmington, DE, positive income, 1314 total offices, Holding Company: Toronto-Dominion Bank, The
- Sovereign Bank, National Association: Barrington Branch at 272 County Road, branch established on 1971/05/13. Info updated 2012/01/31: Bank assets: $78,146.9 mil, Deposits: $48,042.9 mil, headquarters in Wilmington, DE, positive income, Commercial Lending Specialization, 718 total offices, Holding Company: Banco Santander, S.A.
For population 15 years and over in Barrington:
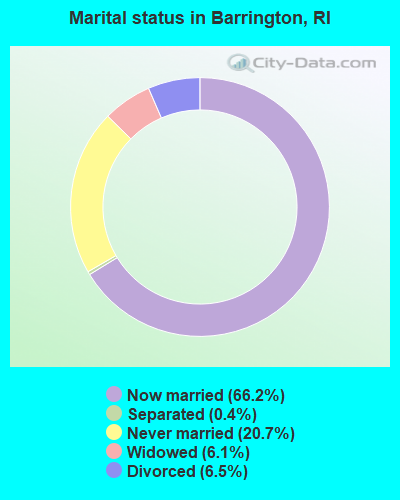
- Never married: 20.7%
- Now married: 66.2%
- Separated: 0.4%
- Widowed: 6.1%
- Divorced: 6.5%
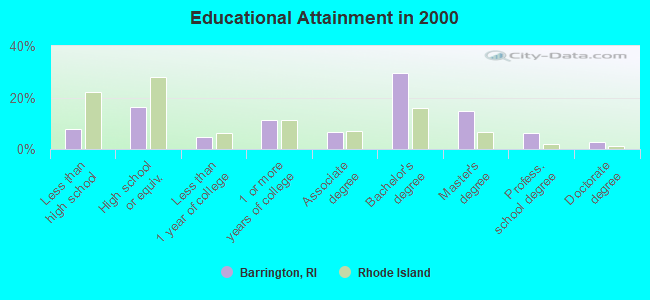
For population 25 years and over in Barrington:
- High school or higher: 92.4%
- Bachelor's degree or higher: 53.2%
- Graduate or professional degree: 23.7%
- Unemployed: 4.0%
- Mean travel time to work (commute): 23.6 minutes
| Here: | 11.0 |
| Rhode Island average: | 14.0 |
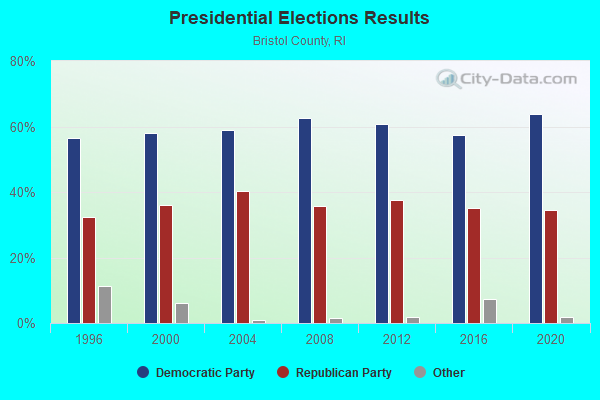
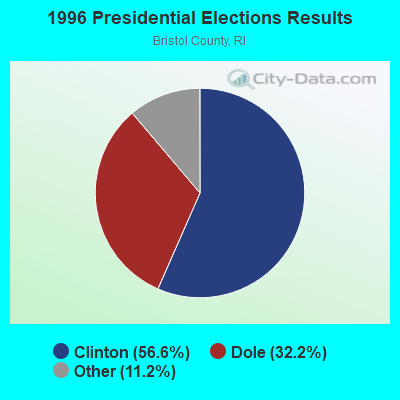
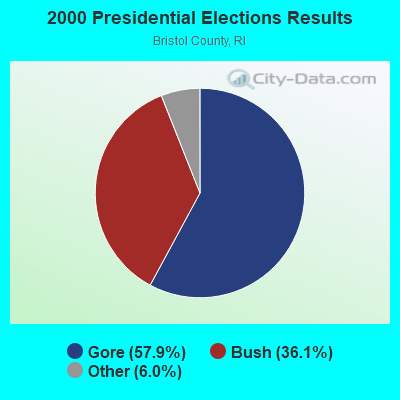
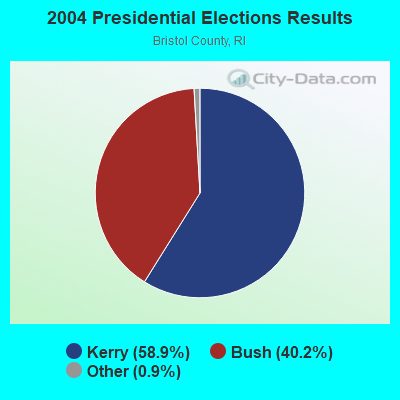
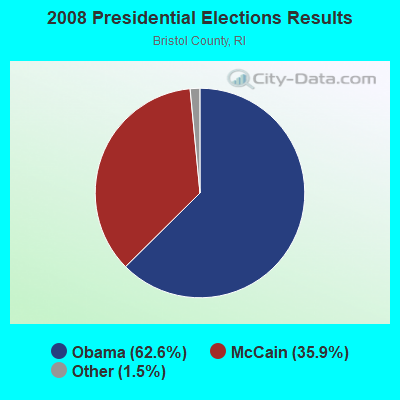
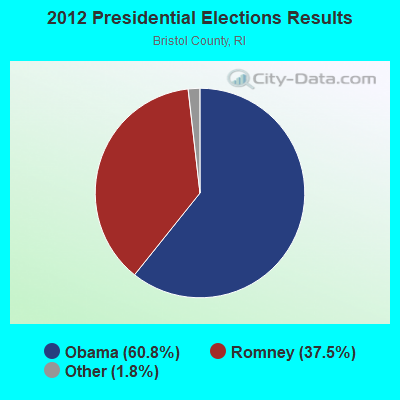
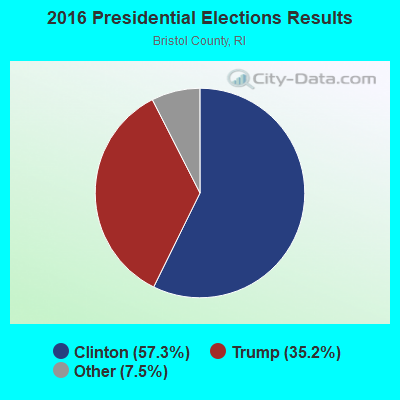

Graphs represent county-level data. Detailed 2008 Election Results
Religion statistics for Barrington, RI (based on Bristol County data)
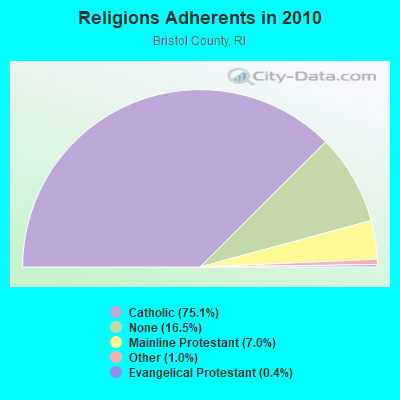
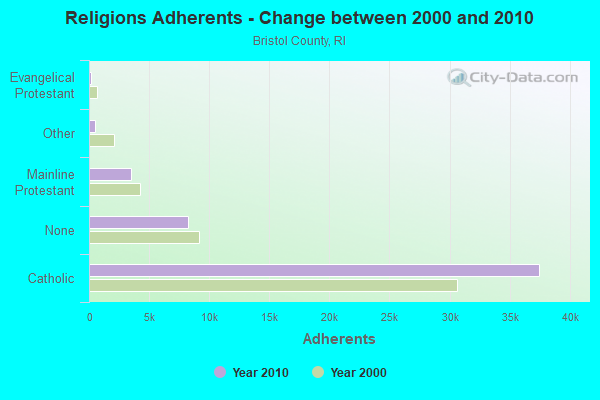
| Religion | Adherents | Congregations |
|---|---|---|
| Catholic | 37,476 | 9 |
| Mainline Protestant | 3,471 | 11 |
| Other | 481 | 2 |
| Evangelical Protestant | 198 | 3 |
| None | 8,249 | - |
Food Environment Statistics:
| Bristol County: | 1.40 / 10,000 pop. |
| Rhode Island: | 1.92 / 10,000 pop. |
| Bristol County: | 1.00 / 10,000 pop. |
| Rhode Island: | 1.42 / 10,000 pop. |
| Bristol County: | 1.60 / 10,000 pop. |
| State: | 2.24 / 10,000 pop. |
| Here: | 11.61 / 10,000 pop. |
| State: | 9.75 / 10,000 pop. |
| This county: | 7.8% |
| Rhode Island: | 7.9% |
| Bristol County: | 18.9% |
| Rhode Island: | 22.6% |
| This county: | 16.8% |
| State: | 16.3% |
| Businesses in Barrington, RI | ||||
| Name | Count | Name | Count | |
|---|---|---|---|---|
| Ace Hardware | 1 | Shaw's | 1 | |
| Ann Taylor | 1 | Staples | 1 | |
| CVS | 1 | Starbucks | 1 | |
| Dunkin Donuts | 1 | Talbots | 1 | |
| FedEx | 1 | U-Haul | 1 | |
| GNC | 1 | UPS | 2 | |
| Rite Aid | 1 | YMCA | 1 | |
Strongest AM radio stations in Barrington:
- WPRO (630 AM; 5 kW; PROVIDENCE, RI; Owner: CITADEL BROADCASTING COMPANY)
- WHJJ (920 AM; 5 kW; PROVIDENCE, RI)
- WSKO (790 AM; 5 kW; PROVIDENCE, RI; Owner: CITADEL BROADCASTING COMPANY)
- WALE (990 AM; 50 kW; GREENVILLE, RI; Owner: NORTH AMERICAN BROADCASTING CO., INC.)
- WPMZ (1110 AM; daytime; 5 kW; EAST PROVIDENCE, RI; Owner: VIDEO MUNDO B/CASTING CO., LLC)
- WRNI (1290 AM; 10 kW; PROVIDENCE, RI; Owner: WRNI FOUNDATION)
- WSAR (1480 AM; 5 kW; FALL RIVER, MA; Owner: BRISTOL COUNTY BROADCASTING, INC.)
- WARV (1590 AM; 5 kW; WARWICK, RI; Owner: BLOUNT COMMUNICATIONS, INC.)
- WDDZ (550 AM; 5 kW; PAWTUCKET, RI; Owner: ABC, INC.)
- WEEI (850 AM; 50 kW; BOSTON, MA; Owner: ENTERCOM BOSTON LICENSE, LLC)
- WKOX (1200 AM; 50 kW; FRAMINGHAM, MA; Owner: CAPSTAR TX LIMITED PARTNERSHIP)
- WCRN (830 AM; 50 kW; WORCESTER, MA; Owner: CARTER BROADCASTING CORPORATION)
- WRKO (680 AM; 50 kW; BOSTON, MA; Owner: ENTERCOM BOSTON LICENSE, LLC)
Strongest FM radio stations in Barrington:
- WWBB (101.5 FM; PROVIDENCE, RI; Owner: CLEAR CHANNEL BROADCASTING LICENSES, INC.)
- WBRU (95.5 FM; PROVIDENCE, RI; Owner: BROWN BROADCASTING SERVICE, INC.)
- WHJY (94.1 FM; PROVIDENCE, RI; Owner: CAPSTAR TX LIMITED PARTNERSHIP)
- WSNE-FM (93.3 FM; TAUNTON, MA; Owner: CAPSTAR TX LIMITED PARTNERSHIP)
- WPRO-FM (92.3 FM; PROVIDENCE, RI; Owner: CITADEL BROADCASTING COMPANY)
- WWLI (105.1 FM; PROVIDENCE, RI; Owner: CITADEL BROADCASTING COMPANY)
- WKKB (100.3 FM; MIDDLETOWN, RI; Owner: CITADEL BROADCASTING COMPANY)
- WWKX (106.3 FM; WOONSOCKET, RI; Owner: AAA ENTERTAINMENT LICENSING LLC)
- WSKO-FM (99.7 FM; WAKEFIELD-PEACEDALE, RI; Owner: CITADEL BROADCASTING COMPANY)
- WBMX (98.5 FM; BOSTON, MA; Owner: INFINITY RADIO OPERATIONS INC.)
- WBOS (92.9 FM; BROOKLINE, MA; Owner: GREATER BOSTON RADIO, INC.)
- WJMN (94.5 FM; BOSTON, MA; Owner: AMFM RADIO LICENSES, L.L.C.)
- WCRB (102.5 FM; WALTHAM, MA; Owner: CHARLES RIVER BROADCASTING WCRB LICE)
- WTKK (96.9 FM; BOSTON, MA; Owner: GREATER BOSTON RADIO, INC.)
- WROR-FM (105.7 FM; FRAMINGHAM, MA; Owner: GREATER BOSTON RADIO, INC.)
- WCTK (98.1 FM; NEW BEDFORD, MA; Owner: HALL COMMUNICATIONS, INC.)
- WGBH (89.7 FM; BOSTON, MA; Owner: WGBH EDUCATIONAL FOUNDATION)
- WXKS-FM (107.9 FM; MEDFORD, MA; Owner: AMFM RADIO LICENSES, L.L.C.)
- WWRX-FM (103.7 FM; WESTERLY, RI; Owner: FNX BROADCASTING OF RHODE ISLAND, LLC)
- WRIU (90.3 FM; KINGSTON, RI; Owner: UNIVERSITY OF RHODE ISLAND)
TV broadcast stations around Barrington:
- WNAC-TV (Channel 64; PROVIDENCE, RI; Owner: WNAC, LLC)
- WJAR (Channel 10; PROVIDENCE, RI; Owner: OUTLET BROADCASTING, INC.)
- WLNE-TV (Channel 6; NEW BEDFORD, MA; Owner: FREEDOM BROADCASTING OF SOUTHERN NEW ENGLAND, INC.)
- WPRI-TV (Channel 12; PROVIDENCE, RI; Owner: TVL BROADCASTING OF RHODE ISLAND, LLC)
- WSBE-TV (Channel 36; PROVIDENCE, RI; Owner: RHODE ISLAND PUBLIC TELECOM. AUTHORITY)
- WPXQ (Channel 69; BLOCK ISLAND, RI; Owner: OCEAN STATE TELEVISION, L.L.C.)
- WRIW-LP (Channel 50; PROVIDENCE, RI; Owner: ZGS PROVIDENCE, INC.)
- WWDP (Channel 46; NORWELL, MA; Owner: NORWELL TELEVISION, LLC)
- WLWC (Channel 28; NEW BEDFORD, MA; Owner: C-28 FCC LICENSEE SUBSIDIARY, LLC)
- WCVB-TV (Channel 5; BOSTON, MA; Owner: WCVB HEARST-ARGYLE TV, INC.)
- WGBH-TV (Channel 2; BOSTON, MA; Owner: WGBH EDUCATIONAL FOUNDATION)
- WHDH-TV (Channel 7; BOSTON, MA; Owner: WHDH-TV)
- WMFP (Channel 62; LAWRENCE, MA; Owner: WSAH LICENSE, INC.)
- WSBK-TV (Channel 38; BOSTON, MA; Owner: VIACOM INC.)
- WLVI-TV (Channel 56; CAMBRIDGE, MA; Owner: WLVI, INC.)
- WBZ-TV (Channel 4; BOSTON, MA; Owner: VIACOM INC.)
- WGBX-TV (Channel 44; BOSTON, MA; Owner: WGBH EDUCATIONAL FOUNDATION)
- WFXT (Channel 25; BOSTON, MA; Owner: FOX TELEVISION STATIONS INC.)
- WUNI (Channel 27; WORCESTER, MA; Owner: ENTRAVISION HOLDINGS, LLC)
- WUTF (Channel 66; MARLBOROUGH, MA; Owner: TELEFUTURA BOSTON LLC)
- WBPX (Channel 68; BOSTON, MA; Owner: PAXSON BOSTON-68 LICENSE, INC.)
- W40BO (Channel 40; BOSTON, MA; Owner: PAXSON COMMUNICATIONS LPTV, INC.)
- National Bridge Inventory (NBI) Statistics
- 2Number of bridges
- 59ft / 18.2mTotal length
- $11,681,000Total costs
- 38,824Total average daily traffic
- 1,718Total average daily truck traffic
- 42,706Total future (year 2041) average daily traffic
FCC Registered Antenna Towers:
12 (See the full list of FCC Registered Antenna Towers in Barrington)FCC Registered Broadcast Land Mobile Towers:
9 (See the full list of FCC Registered Broadcast Land Mobile Towers in Barrington, RI)FCC Registered Maritime Coast & Aviation Ground Towers:
2- Striper Marina 26 Tyler Point Rd (Lat: 41.734833 Lon: -71.290611), Type: Building, Overall height: 8 m, Call Sign: WHG854,
Assigned Frequencies: 156.425 MHz, 156.450 MHz, 156.800 MHz, Grant Date: 05/22/1997, Expiration Date: 05/22/2002, Cancellation Date: 08/25/2002, Registrant: Bristol County Striper Of Rhode Island Inc, 312 Wood Ave, Woonsocket, RI 02895
- In Shop 101 Narragansett Ave (Lat: 41.753167 Lon: -71.352278), Type: Building, Overall height: 5 m, Call Sign: WQZ268, Licensee ID: L00001283,
Assigned Frequencies: 156.450 MHz, 4.15040 MHz, Grant Date: 12/07/1999, Expiration Date: 12/01/2004, Cancellation Date: 02/05/2005, Registrant: Custom Navigation Systems Inc, 101 Narragansett Ave, Barrington, RI 02806
FCC Registered Amateur Radio Licenses:
88 (See the full list of FCC Registered Amateur Radio Licenses in Barrington)FAA Registered Aircraft:
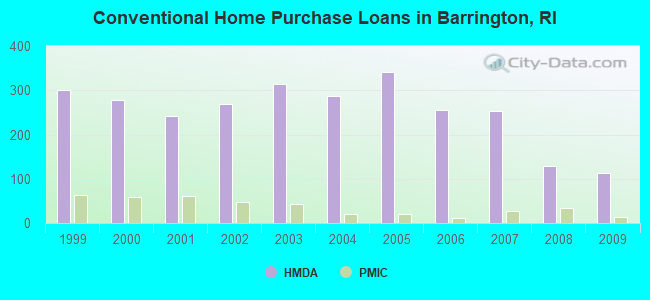
11 (See the full list of FAA Registered Aircraft in Barrington)| Home Mortgage Disclosure Act Aggregated Statistics For Year 2009 (Based on 4 full tracts) | ||||||||||
| A) FHA, FSA/RHS & VA Home Purchase Loans | B) Conventional Home Purchase Loans | C) Refinancings | D) Home Improvement Loans | F) Non-occupant Loans on < 5 Family Dwellings (A B C & D) | ||||||
|---|---|---|---|---|---|---|---|---|---|---|
| Number | Average Value | Number | Average Value | Number | Average Value | Number | Average Value | Number | Average Value | |
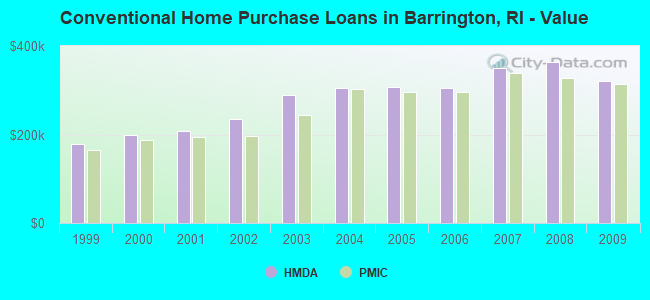
| LOANS ORIGINATED | 45 | $259,658 | 112 | $319,949 | 700 | $289,022 | 40 | $134,788 | 21 | $286,274 |
| APPLICATIONS APPROVED, NOT ACCEPTED | 3 | $260,000 | 6 | $259,948 | 49 | $294,315 | 3 | $78,667 | 1 | $400,000 |
| APPLICATIONS DENIED | 7 | $264,554 | 14 | $409,259 | 118 | $312,088 | 10 | $206,182 | 4 | $190,235 |
| APPLICATIONS WITHDRAWN | 6 | $345,322 | 10 | $235,879 | 88 | $313,844 | 6 | $195,312 | 6 | $184,833 |
| FILES CLOSED FOR INCOMPLETENESS | 0 | $0 | 0 | $0 | 22 | $326,798 | 1 | $10,000 | 2 | $247,500 |
Detailed HMDA statistics for the following Tracts: 0301.00 , 0302.00, 0303.00, 0304.00
| Private Mortgage Insurance Companies Aggregated Statistics For Year 2009 (Based on 4 full tracts) | ||||
| A) Conventional Home Purchase Loans | B) Refinancings | |||
|---|---|---|---|---|
| Number | Average Value | Number | Average Value | |
| LOANS ORIGINATED | 13 | $313,969 | 14 | $328,136 |
| APPLICATIONS APPROVED, NOT ACCEPTED | 5 | $329,760 | 5 | $318,784 |
| APPLICATIONS DENIED | 4 | $377,230 | 3 | $347,630 |
| APPLICATIONS WITHDRAWN | 5 | $284,932 | 4 | $342,975 |
| FILES CLOSED FOR INCOMPLETENESS | 1 | $333,000 | 0 | $0 |
Detailed PMIC statistics for the following Tracts: 0301.00 , 0302.00, 0303.00, 0304.00
2007 - 2018 National Fire Incident Reporting System (NFIRS) incidents
- Fire incident types reported to NFIRS in Barrington, RI
- 17751.0%Structure Fires
- 9427.1%Outside Fires
- 5315.3%Other
- 236.6%Mobile Property/Vehicle Fires
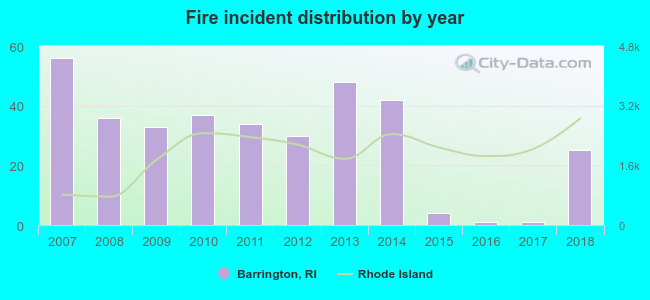 Based on the data from the years 2007 - 2018 the average number of fires per year is 29. The highest number of reported fire incidents - 56 took place in 2007, and the least - 1 in 2016. The data has a dropping trend.
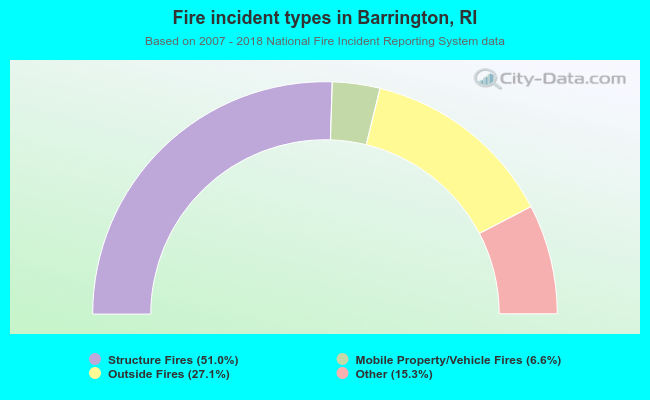 When looking into fire subcategories, the most reports belonged to: Structure Fires (51.0%), and Outside Fires (27.1%).
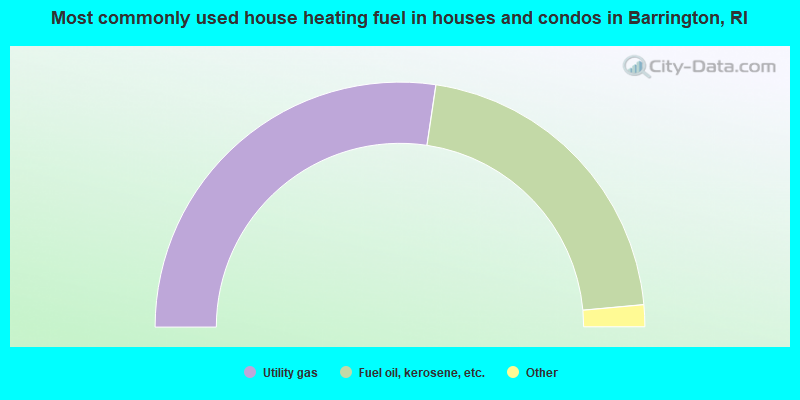
- 54.7%Utility gas
- 42.4%Fuel oil, kerosene, etc.
- 1.5%Electricity
- 0.7%Bottled, tank, or LP gas
- 0.7%Wood
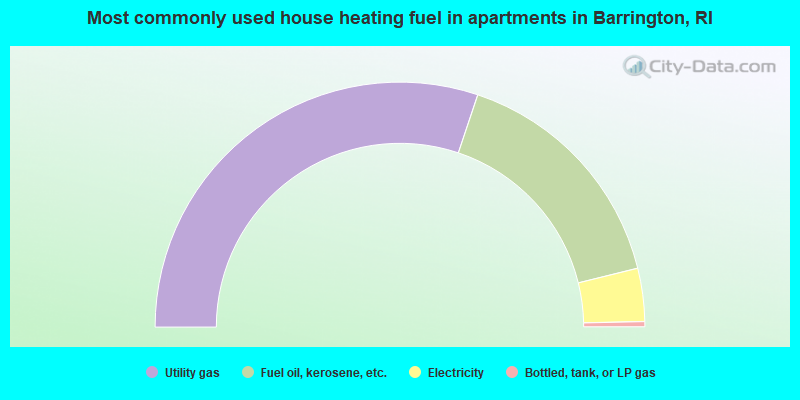
- 60.3%Utility gas
- 32.0%Fuel oil, kerosene, etc.
- 7.0%Electricity
- 0.7%Bottled, tank, or LP gas
Barrington compared to Rhode Island state average:
- Median household income above state average.
- Median house value above state average.
- Unemployed percentage significantly below state average.
- Black race population percentage significantly below state average.
- Hispanic race population percentage significantly below state average.
- Foreign-born population percentage significantly below state average.
- Renting percentage significantly below state average.
- Length of stay since moving in significantly above state average.
- Number of rooms per house significantly below state average.
- House age significantly below state average.
- Percentage of population with a bachelor's degree or higher above state average.
Barrington on our top lists:
- #10 on the list of "Top 101 cities with largest percentage of females in occupations: other health diagnosing and treating practitioners and technical occupations (population 5,000+)"
- #17 on the list of "Top 101 cities with largest percentage of males in occupations: physicians and surgeons (population 5,000+)"
- #24 on the list of "Top 101 cities with largest percentage of females in occupations: counselors, social workers, and other community and social service specialists (population 5,000+)"
- #26 on the list of "Top 101 cities with largest percentage of females in occupations: librarians, curators, and archivists (population 5,000+)"
- #26 on the list of "Top 101 cities with largest percentage of males in industries: jewelry, luggage, and leather goods stores (population 5,000+)"
- #31 on the list of "Top 101 cities with largest percentage of males in industries: health care (population 5,000+)"
- #32 on the list of "Top 101 cities with largest percentage of males in occupations: postsecondary teachers (population 5,000+)"
- #33 on the list of "Top 101 cities with largest percentage of females in occupations: physicians and surgeons (population 5,000+)"
- #41 on the list of "Top 101 cities with largest percentage of males in industries: miscellaneous manufacturing (population 5,000+)"
- #51 on the list of "Top 101 cities with largest percentage of females in industries: furniture and home furnishing merchant wholesalers (population 5,000+)"
- #59 on the list of "Top 101 cities with largest percentage of females in industries: apparel, fabrics, and notions merchant wholesalers (population 5,000+)"
- #17 on the list of "Top 101 counties with the lowest average weight of females"
- #19 on the list of "Top 101 counties with the highest percentage of residents that smoked 100+ cigarettes in their lives"
- #25 on the list of "Top 101 counties with the highest percentage of residents that visited a dentist within the past year"
- #39 on the list of "Top 101 counties with the best general health status score of residents (1-5), 3 years of data"
- #44 on the list of "Top 101 counties with the lowest total withdrawal of fresh water for public supply (pop. 50,000+)"

|
|
Total of 694 patent applications in 2008-2024.