Bartlett, TN (Tennessee) Houses and Residents
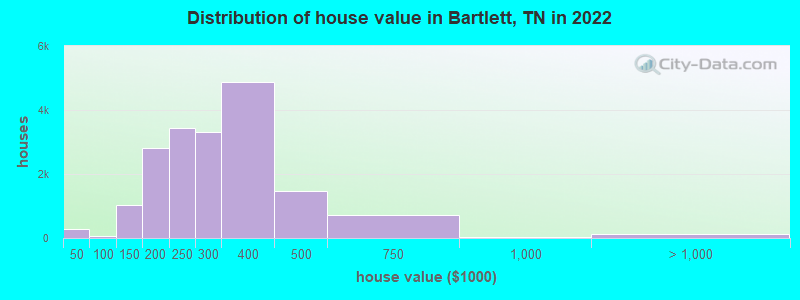
Estimated median house or condo value in 2022: $306,412 (it was $133,000 in 2000 )
Bartlett:
$306,412Tennessee:
$284,800
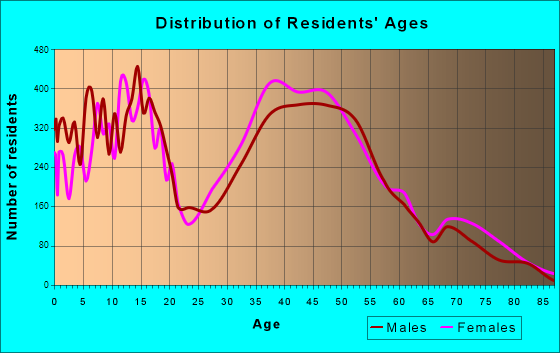
Lower value quartile - upper value quartile: $243,487 - $379,166Total population: 58,264 (Urban population: 39,904, Rural population: 405 (all nonfarm) )
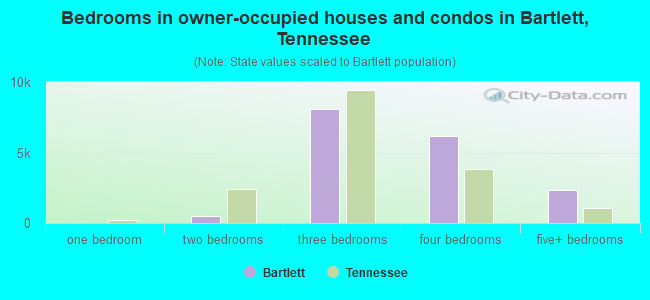
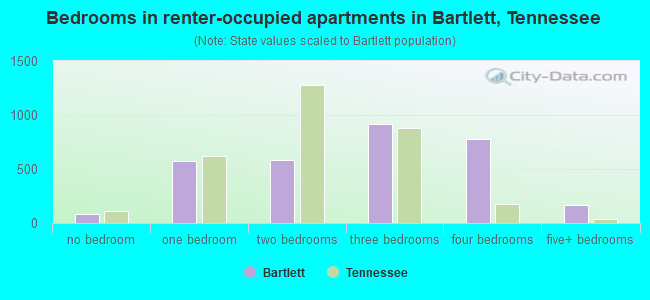
Houses: 20,757 (20,029 occupied: 17,114 owner occupied, 3,101 renter occupied )
% of renters here:
15%State:
33%
Housing density: 1,088 houses/condos per square mile
Median price asked for vacant for-sale houses and condos in 2022: $182,890.
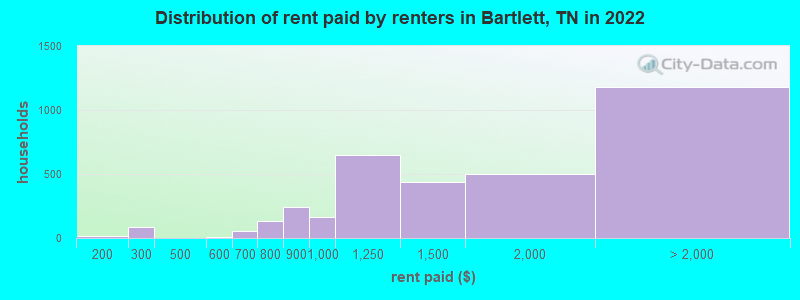
Median contract rent in 2022: $1,314 (lower quartile is $1,019, upper quartile is $1,917)
Median rent asked for vacant for-rent units in 2022: $1,927
Median gross rent in Bartlett, TN in 2022: $1,543
Housing units in Bartlett with a mortgage: 11,446 (683 second mortgage, 15 home equity loan, 581 both second mortgage and home equity loan )Houses without a mortgage: 350
Median household income for houses/condos with a mortgage: $115,502
Median household income for apartments without a mortgage: $84,691
Median monthly housing costs: $1,414
Data:
Median house or condo value ($)
Median house or condo value ($ change since 2000)
Median house or condo value ($) - White
Median house or condo value ($) - Black or African American
Median house or condo value ($) - Asian
Median house or condo value ($) - Hispanic or Latino
Median house or condo value ($) - American Indian and Alaska Native
Median house or condo value ($) - Multirace
Median house or condo value ($) - Other Race
Median price asked for mobile homes ($)
Household density (households per square mile)
Mean house or condo value by units in structure - 1, detached ($)
Mean house or condo value by units in structure - 1, attached ($)
Mean house or condo value by units in structure - 2 ($)
Mean house or condo value by units in structure by units in structure - 3 or 4 ($)
Mean house or condo value by units in structure - 5 or more ($)
Mean house or condo value by units in structure - Boat, RV, van, etc. ($)
Mean house or condo value by units in structure - Mobile home ($)
Median contract rent ($)
Median contract rent - Lower quartile ($)
Median contract rent - Upper quartile ($)
Median gross rent ($)
Urban houses (%)
Rural houses (%)
Houses occupied (%)
Houses occupied (% change since 2000)
Houses owner occupied (%)
Houses owner occupied (% change since 2000)
Houses renter occupied (%)
Houses renter occupied (% change since 2000)
Vacant housing units - For rent (%)
Vacant housing units - For rent (% change since 2000)
Vacant housing units - For sale only (%)
Vacant housing units - For sale only (% change since 2000)
Vacant housing units - Rented or sold, not occupied (%)
Vacant housing units - Rented or sold, not occupied (% change since 2000)
Vacant housing units - For seasonal, recreational, or occasional use (%)
Vacant housing units - For seasonal, recreational, or occasional use (% change since 2000)
Vacant housing units - For migrant workers (%)
Vacant housing units - For migrant workers (% change since 2000)
Vacant housing units - Other vacant (%)
Vacant housing units - Other vacant (% change since 2000)
Median monthly housing costs ($)
Median household income for houses/condos with a mortgage ($)
Median household income for houses/condos without a mortgage ($)
Median household income ($)
Median household income ($) - White
Median household income ($) - Black or African American
Median household income ($) - Asian
Median household income ($) - Hispanic or Latino
Median household income ($) - American Indian and Alaska Native
Median household income ($) - Multirace
Median household income ($) - Other Race
Mortgage status - with mortgage (%)
Mortgage status - with second mortgage (%)
Mortgage status - with home equity loan (%)
Mortgage status - with both second mortgage and home equity loan (%)
Mortgage status - without a mortgage (%)
Median year house/condo built
Median year apartment built
Household type by relationship - Male householder living alone (%)
Household type by relationship - Male householder not living alone (%)
Household type by relationship - Female householder living alone (%)
Household type by relationship - Female householder not living alone (%)
Household type by relationship - Opposite-Sex spouse (%)
Household type by relationship - Same-Sex spouse (%)
Household type by relationship - Opposite-Sex unmarried partner (%)
Household type by relationship - Same-Sex unmarried partner (%)
Household type by relationship - In group quarters (%)
Size of family households - 2-person household (%)
Size of family households - 3-person household (%)
Size of family households - 4-person household (%)
Size of family households - 5-person household (%)
Size of family households - 6-person household (%)
Size of family households - 7-or-more-person household (%)
Size of nonfamily households - 1-person household (%)
Size of nonfamily households - 2-person household (%)
Size of nonfamily households - 3-person household (%)
Size of nonfamily households - 4-person household (%)
Size of nonfamily households - 5-person household (%)
Size of nonfamily households - 6-person household (%)
Size of nonfamily households - 7-or-moreperson household (%)
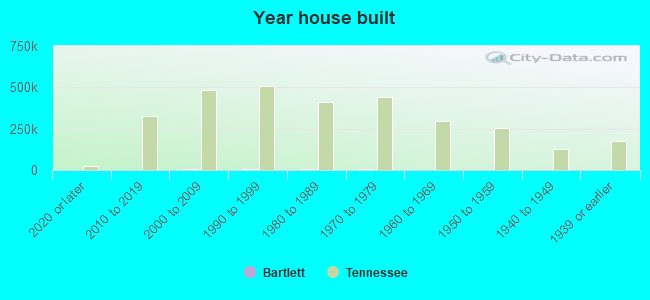
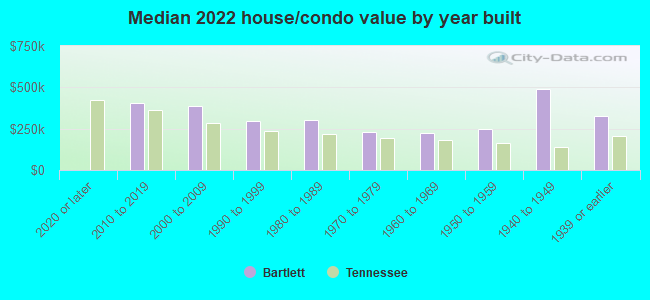
Year house built - Built 2010 or later (%)
Year house built - Built 2000 to 2009 (%)
Year house built - Built 1990 to 1999 (%)
Year house built - Built 1980 to 1989 (%)
Year house built - Built 1970 to 1979 (%)
Year house built - Built 1960 to 1969 (%)
Year house built - Built 1950 to 1959 (%)
Year house built - Built 1940 to 1949 (%)
Year house built - Built 1939 or earlier (%)
Median number of rooms in houses and condos
Median number of rooms in apartments
Median number of bedrooms in owner occupied houses
Mean number of bedrooms in owner occupied houses
Median number of bedrooms in renter occupied houses
Mean number of bedrooms in renter occupied houses
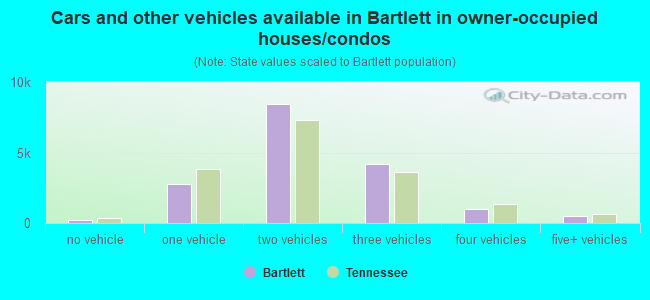
Median number of vehichles in owner occupied houses
Mean number of vehichles in owner occupied houses
Median number of vehichles in renter occupied houses
Mean number of vehichles in renter occupied houses
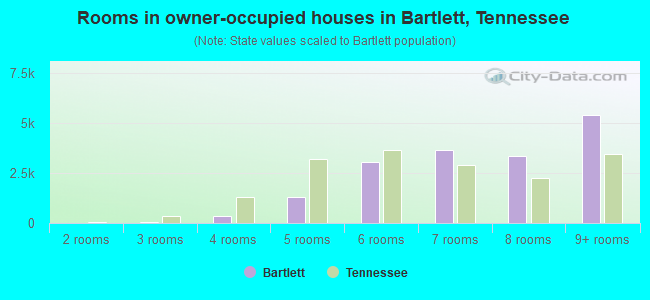
Rooms in owner-occupied houses - 1 room (%)
Rooms in owner-occupied houses - 2 rooms (%)
Rooms in owner-occupied houses - 3 rooms (%)
Rooms in owner-occupied houses - 4 rooms (%)
Rooms in owner-occupied houses - 5 rooms (%)
Rooms in owner-occupied houses - 6 rooms (%)
Rooms in owner-occupied houses - 7 rooms (%)
Rooms in owner-occupied houses - 8 rooms (%)
Rooms in owner-occupied houses - 9+ rooms (%)
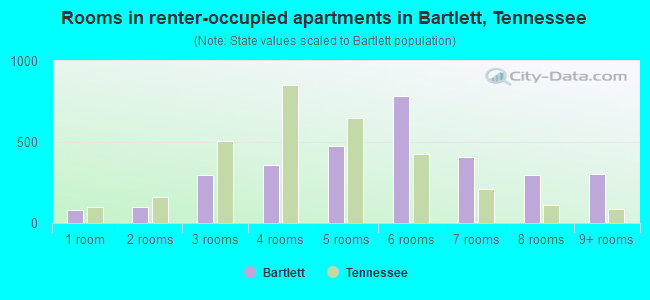
Rooms in renter-occupied houses - 1 room (%)
Rooms in renter-occupied houses - 2 rooms (%)
Rooms in renter-occupied houses - 3 rooms (%)
Rooms in renter-occupied houses - 4 rooms (%)
Rooms in renter-occupied houses - 5 rooms (%)
Rooms in renter-occupied houses - 6 rooms (%)
Rooms in renter-occupied houses - 7 rooms (%)
Rooms in renter-occupied houses - 8 rooms (%)
Rooms in renter-occupied houses - 9+ rooms (%)
Bedrooms in owner-occupied houses - no bedrooms (%)
Bedrooms in owner-occupied houses - 1 bedroom (%)
Bedrooms in owner-occupied houses - 2 bedrooms (%)
Bedrooms in owner-occupied houses - 3 bedrooms (%)
Bedrooms in owner-occupied houses - 4 bedrooms (%)
Bedrooms in owner-occupied houses - 5+ bedrooms (%)
Bedrooms in renter-occupied houses - no bedrooms (%)
Bedrooms in renter-occupied houses - 1 bedroom (%)
Bedrooms in renter-occupied houses - 2 bedrooms (%)
Bedrooms in renter-occupied houses - 3 bedrooms (%)
Bedrooms in renter-occupied houses - 4 bedrooms (%)
Bedrooms in renter-occupied houses - 5+ bedrooms (%)
Vehicles available in owner-occupied houses - no vehicle available (%)
Vehicles available in owner-occupied houses - 1 vehicle available(%)
Vehicles available in owner-occupied houses - 2 Vehicles available (%)
Vehicles available in owner-occupied houses - 3 Vehicles available (%)
Vehicles available in owner-occupied houses - 4 Vehicles available (%)
Vehicles available in owner-occupied houses - 5+ Vehicles available (%)
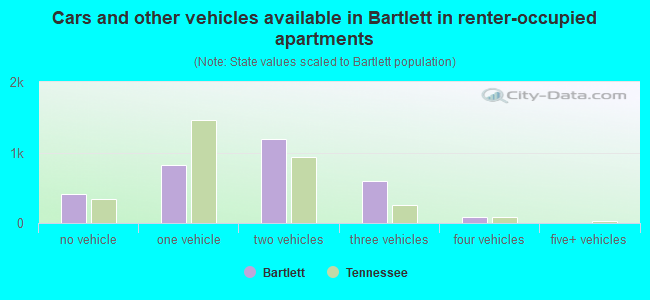
Vehicles available in renter-occupied houses - no vehicle available (%)
Vehicles available in renter-occupied houses - 1 vehicle available (%)
Vehicles available in renter-occupied houses - 2 Vehicles available (%)
Vehicles available in renter-occupied houses - 3 Vehicles available (%)
Vehicles available in renter-occupied houses - 4 Vehicles available (%)
Vehicles available in renter-occupied houses - 5+ Vehicles available (%)
Housing units in structures - 1, detached (%)
Housing units in structures - 1, attached (%)
Housing units in structures - 2 (%)
Housing units in structures - 3 or 4 (%)
Housing units in structures - 5 to 9 (%)
Housing units in structures - 10 to 19 (%)
Housing units in structures - 20 to 49 (%)
Housing units in structures - 50 or more (%)
Housing units in structures - Mobile home (%)
Housing units in structures - Boat, RV, van, etc. (%)
Housing units in structures - Owners - 1, detached (%)
Housing units in structures - Owners - 1, attached (%)
Housing units in structures - Owners - 2 (%)
Housing units in structures - Owners - 3 or 4 (%)
Housing units in structures - Owners - 5 to 9 (%)
Housing units in structures - Owners - 10 to 19 (%)
Housing units in structures - Owners - 20 to 49 (%)
Housing units in structures - Owners - 50 or more (%)
Housing units in structures - Owners - Mobile home (%)
Housing units in structures - Owners - Boat, RV, van, etc. (%)
Housing units in structures - Renters - 1, detached (%)
Housing units in structures - Renters - 1, attached (%)
Housing units in structures - Renters - 2 (%)
Housing units in structures - Renters - 3 or 4 (%)
Housing units in structures - Renters - 5 to 9 (%)
Housing units in structures - Renters - 10 to 19 (%)
Housing units in structures - Renters - 20 to 49 (%)
Housing units in structures - Renters - 50 or more (%)
Housing units in structures - Renters - Mobile home (%)
Housing units in structures - Renters - Boat, RV, van, etc. (%)
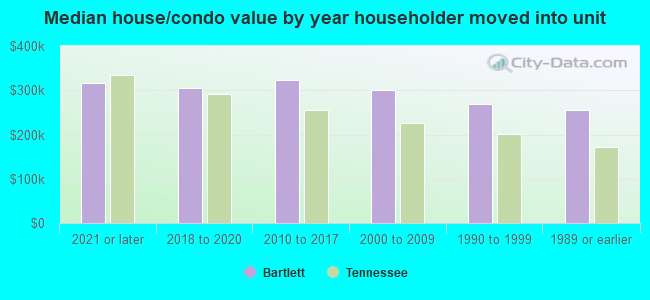
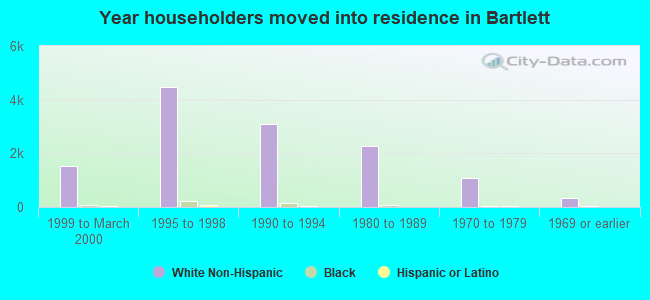
House/condo owner moved in on average (years ago)
Renter moved in on average (years ago)
Year householder moved into unit - Moved in 1999 to March 2000 (%)
Year householder moved into unit - Moved in 1999 to March 2000 (%) - White
Year householder moved into unit - Moved in 1999 to March 2000 (%) - Black or African American
Year householder moved into unit - Moved in 1999 to March 2000 (%) - Asian
Year householder moved into unit - Moved in 1999 to March 2000 (%) - Hispanic or Latino
Year householder moved into unit - Moved in 1999 to March 2000 (%) - American Indian and Alaska Native
Year householder moved into unit - Moved in 1999 to March 2000 (%) - Multirace
Year householder moved into unit - Moved in 1999 to March 2000 (%) - Other Race
Year householder moved into unit - Moved in 1995 to 1998 (%)
Year householder moved into unit - Moved in 1995 to 1998 (%) - White
Year householder moved into unit - Moved in 1995 to 1998 (%) - Black or African American
Year householder moved into unit - Moved in 1995 to 1998 (%) - Asian
Year householder moved into unit - Moved in 1995 to 1998 (%) - Hispanic or Latino
Year householder moved into unit - Moved in 1995 to 1998 (%) - American Indian and Alaska Native
Year householder moved into unit - Moved in 1995 to 1998 (%) - Multirace
Year householder moved into unit - Moved in 1995 to 1998 (%) - Other Race
Year householder moved into unit - Moved in 1990 to 1994 (%)
Year householder moved into unit - Moved in 1990 to 1994 (%) - White
Year householder moved into unit - Moved in 1990 to 1994 (%) - Black or African American
Year householder moved into unit - Moved in 1990 to 1994 (%) - Asian
Year householder moved into unit - Moved in 1990 to 1994 (%) - Hispanic or Latino
Year householder moved into unit - Moved in 1990 to 1994 (%) - American Indian and Alaska Native
Year householder moved into unit - Moved in 1990 to 1994 (%) - Multirace
Year householder moved into unit - Moved in 1990 to 1994 (%) - Other Race
Year householder moved into unit - Moved in 1980 to 1989 (%)
Year householder moved into unit - Moved in 1980 to 1989 (%) - White
Year householder moved into unit - Moved in 1980 to 1989 (%) - Black or African American
Year householder moved into unit - Moved in 1980 to 1989 (%) - Asian
Year householder moved into unit - Moved in 1980 to 1989 (%) - Hispanic or Latino
Year householder moved into unit - Moved in 1980 to 1989 (%) - American Indian and Alaska Native
Year householder moved into unit - Moved in 1980 to 1989 (%) - Multirace
Year householder moved into unit - Moved in 1980 to 1989 (%) - Other Race
Year householder moved into unit - Moved in 1970 to 1979 (%)
Year householder moved into unit - Moved in 1970 to 1979 (%) - White
Year householder moved into unit - Moved in 1970 to 1979 (%) - Black or African American
Year householder moved into unit - Moved in 1970 to 1979 (%) - Asian
Year householder moved into unit - Moved in 1970 to 1979 (%) - Hispanic or Latino
Year householder moved into unit - Moved in 1970 to 1979 (%) - American Indian and Alaska Native
Year householder moved into unit - Moved in 1970 to 1979 (%) - Multirace
Year householder moved into unit - Moved in 1970 to 1979 (%) - Other Race
Year householder moved into unit - Moved in 1969 or earlier (%)
Year householder moved into unit - Moved in 1969 or earlier (%) - White
Year householder moved into unit - Moved in 1969 or earlier (%) - Black or African American
Year householder moved into unit - Moved in 1969 or earlier (%) - Asian
Year householder moved into unit - Moved in 1969 or earlier (%) - Hispanic or Latino
Year householder moved into unit - Moved in 1969 or earlier (%) - American Indian and Alaska Native
Year householder moved into unit - Moved in 1969 or earlier (%) - Multirace
Year householder moved into unit - Moved in 1969 or earlier (%) - Other Race
Housing units lacking complete plumbing facilities (%)
Housing units lacking complete kitchen facilities (%)
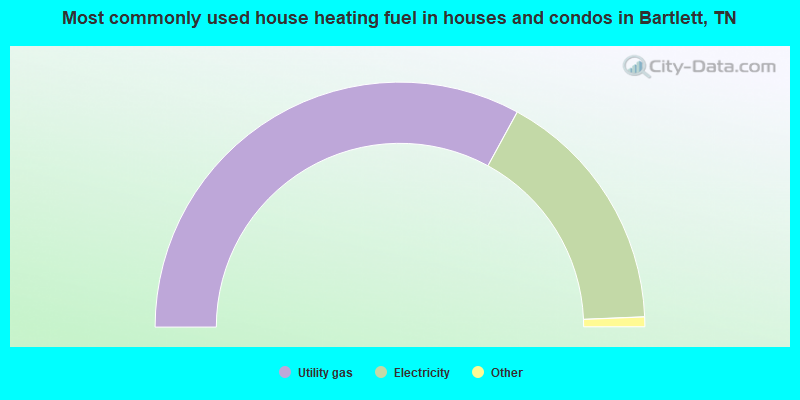
House heating fuel used in houses and condos - Utility gas (%)
House heating fuel used in houses and condos - Bottled, tank, or LP gas (%)
House heating fuel used in houses and condos - Electricity (%)
House heating fuel used in houses and condos - Fuel oil, kerosene, etc. (%)
House heating fuel used in houses and condos - Coal or coke (%)
House heating fuel used in houses and condos - Wood (%)
House heating fuel used in houses and condos - Solar energy (%)
House heating fuel used in houses and condos - Other fuel (%)
House heating fuel used in houses and condos - No fuel used (%)
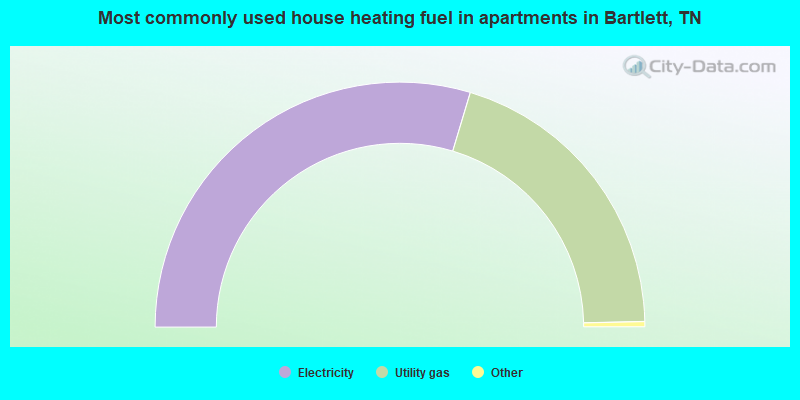
House heating fuel used in apartments - Utility gas (%)
House heating fuel used in apartments - Bottled, tank, or LP gas (%)
House heating fuel used in apartments - Electricity (%)
House heating fuel used in apartments - Fuel oil, kerosene, etc. (%)
House heating fuel used in apartments - Coal or coke (%)
House heating fuel used in apartments - Wood (%)
House heating fuel used in apartments - Solar energy (%)
House heating fuel used in apartments - Other fuel (%)
House heating fuel used in apartments - No fuel used (%)
Latest news about housing in Bartlett, TN collected exclusively by city-data.com from local newspapers, TV, and radio stations
Median year house/condo built: 1989Median year apartment built: 1995Household type by relationship:
Households: 56,856
Male householders: 10,323 (1,663 living alone ), Female householders: 9,407 (1,794 living alone )13,181 spouses (13,072 opposite-sex spouses ), 501 unmarried partners , (479 opposite-sex unmarried partners ), 16,974 children (15,724 natural , 326 adopted , 923 stepchildren ), 2,777 grandchildren , 343 brothers or sisters , 849 parents , 78 foster children , 923 other relatives , 791 non-relatives In group quarters: 704
Size of family households: 7,208 2-persons , 4,445 3-persons , 2,606 4-persons , 1,079 5-persons , 592 6-persons , 372 7-or-more-persons .
Size of nonfamily households: 3,435 1-person , 465 2-persons , 71 3-persons .
9,155 married couples with children. single-parent households (398 men , 1,329 women ).
92.2% of residents of Bartlett speak English at home. of residents speak Spanish at home (73% speak English very well , 14% speak English well , 12% speak English not well ).of residents speak other Indo-European language at home (73% speak English very well , 18% speak English well , 8% speak English not well ).of residents speak Asian or Pacific Island language at home (54% speak English very well , 10% speak English well , 26% speak English not well , 10% don't speak English at all ).of residents speak other language at home (81% speak English very well , 7% speak English well , 4% speak English not well , 8% don't speak English at all ).
Foreign born population: 4,020 (7.1%)of them are naturalized citizens )
Median number of rooms in houses and condos:
Median number of rooms in apartments
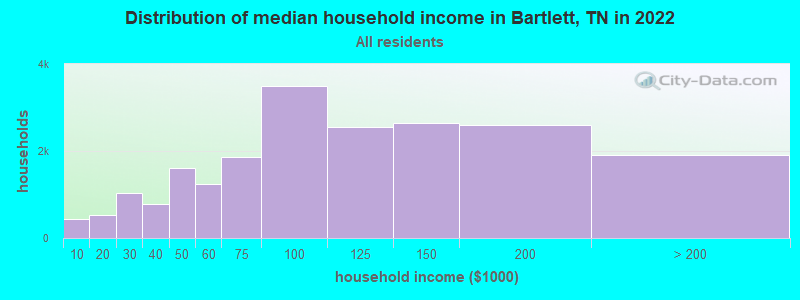
Bartlett, TN household income distribution 435 Less than $10,000522 $10,000 to $19,9991,036 $20,000 to $29,999788 $30,000 to $39,9991,614 $40,000 to $49,9991,248 $50,000 to $59,9991,860 $60,000 to $74,9993,503 $75,000 to $99,9992,562 $100,000 to $124,9992,635 $125,000 to $149,9992,603 $150,000 to $199,9991,911 $200,000 or more
Home value of owner - occupied houses in 2022 in Bartlett, TN 164 Less than $10,00010 $10,000 to $14,99937 $15,000 to $19,99915 $20,000 to $24,99923 $25,000 to $29,99913 $30,000 to $34,99914 $50,000 to $59,9997 $60,000 to $69,99921 $70,000 to $79,99915 $80,000 to $89,9995 $90,000 to $99,999267 $100,000 to $124,999758 $125,000 to $149,9991,170 $150,000 to $174,9991,642 $175,000 to $199,9993,428 $200,000 to $249,9993,328 $250,000 to $299,9994,881 $300,000 to $399,9991,453 $400,000 to $499,999734 $500,000 to $749,99929 $750,000 to $999,9998 $1,000,000 to $1,499,999120 $2,000,000 or moreRent paid by renters in 2022 in Bartlett, TN 17 $100 to $14963 $200 to $24921 $250 to $29911 $500 to $54940 $600 to $64915 $650 to $69937 $700 to $74991 $750 to $799239 $800 to $899167 $900 to $999651 $1,000 to $1,249434 $1,250 to $1,499501 $1,500 to $1,999599 $2,000 to $2,499143 $2,500 to $2,999109 $3,500 or more329 No cash rent
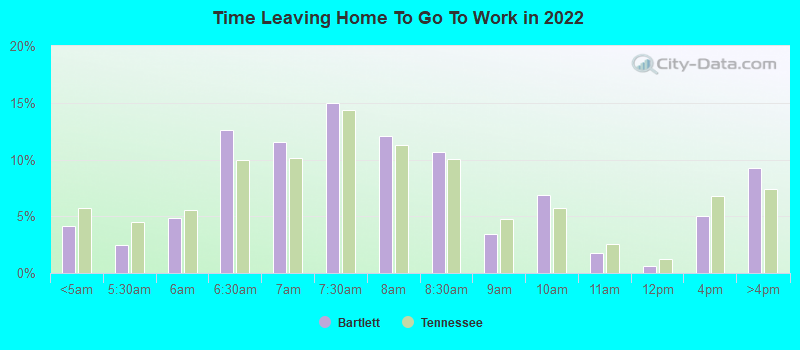
Percentage of workers working in this county: 95.1%Number of people working at home: 3,148 (11.5% of all workers )
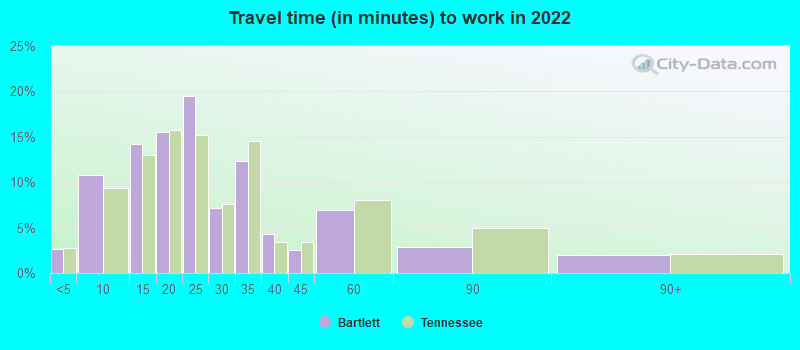
Travel time to work (commute)
Less than 5 minutes: 4495 to 9 minutes: 2,21710 to 14 minutes: 2,70215 to 19 minutes: 2,78820 to 24 minutes: 3,91325 to 29 minutes: 2,95230 to 34 minutes: 4,98135 to 39 minutes: 1,23040 to 44 minutes: 1,21445 to 59 minutes: 96160 to 89 minutes: 23990 or more minutes: 223
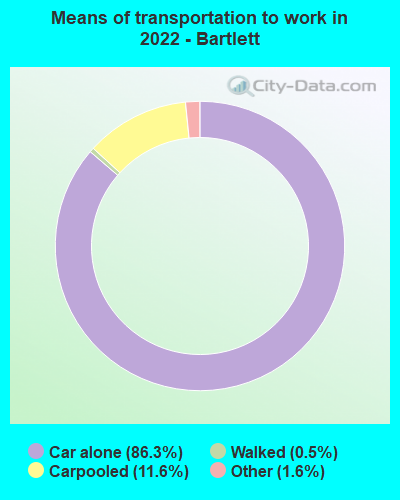
Means of transportation to work:
Drove a car alone: 14,421 (73.2%)Carpooled: 2,117 (10.7%)Taxi: 318 (1.6%)Bicycle: 15 (0.1%)Walked: 123 (0.6%)Worked at home: 3,148 (16.0%)
Unemployment by race in 2022
Unemployment rate for White non-Hispanic residents 3.2% Males2.7% FemalesUnemployment rate for Black residents 1.9% Males0.8% FemalesUnemployment rate for Asian residents 1.4% Males1.0% FemalesUnemployment rate for two or more race residents 16.4% Males26.0% FemalesUnemployment rate for Hispanic or Latino residents 3.7% Males
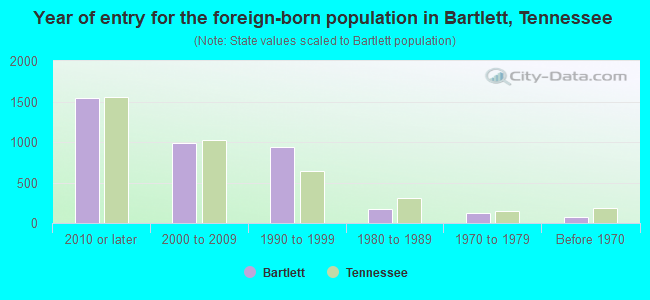
Year of entry for the foreign-born population in Bartlett, Tennessee
1,549 2010 or later 988 2000 to 2009 938 1990 to 1999 177 1980 to 1989 121 1970 to 1979 77 Before 1970
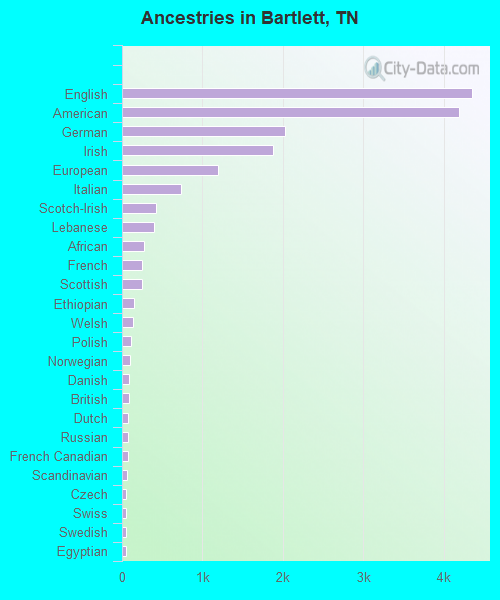
First ancestries reported:
English: 4,346 (13.2%)
American: 4,196 (12.8%)
German: 2,025 (6.2%)
Irish: 1,880 (5.7%)
European: 1,191 (3.6%)
Italian: 738 (2.2%)
Scotch-Irish: 424 (1.3%)
Lebanese: 395 (1.2%)
African: 273 (0.8%)
French: 253 (0.8%)
Scottish: 252 (0.8%)
Ethiopian: 153 (0.5%)
Welsh: 131 (0.4%)
Polish: 118 (0.4%)
Norwegian: 104 (0.3%)
Danish: 93 (0.3%)
British: 90 (0.3%)
Dutch: 80 (0.2%)
Russian: 69 (0.2%)
French Canadian: 69 (0.2%)
Scandinavian: 66 (0.2%)
Czech: 54 (0.2%)
Swiss: 52 (0.2%)
Swedish: 51 (0.2%)
Egyptian: 47 (0.1%)
Jordanian: 44 (0.1%)
Iranian: 43 (0.1%)
Greek: 37 (0.1%)
Eastern European: 35 (0.1%)
Yugoslavian: 27 (0.08%)
Syrian: 20 (0.06%)
Canadian: 20 (0.06%)
Hungarian: 18 (0.05%)
Palestinian: 13 (0.04%)
Austrian: 11 (0.03%)
Croatian: 10 (0.03%)
Bahamian: 10 (0.03%)
Northern European: 9 (0.03%)
Romanian: 7 (0.02%)
South African: 6 (0.02%)
Finnish: 5 (0.02%) Most common places of birth for foreign-born residents (%): Philippines Bartlett:
27.7% (1,116)Tennessee:
3.1% (11,640)
Vietnam Bartlett:
10.0% (402)Tennessee:
2.4% (8,894)
China, excluding Hong Kong and Taiwan Bartlett:
6.8% (274)Tennessee:
3.3% (12,582)
Mexico Bartlett:
5.1% (207)Tennessee:
23.0% (86,435)
Guatemala Bartlett:
4.7% (191)Tennessee:
5.7% (21,286)
Honduras Bartlett:
4.5% (180)Tennessee:
4.6% (17,433)
Egypt Bartlett:
3.5% (139)Tennessee:
3.1% (11,761)
Ethiopia Bartlett:
3.1% (123)Tennessee:
1.4% (5,265)
Germany Bartlett:
2.5% (99)Tennessee:
2.2% (8,261)
Tanzania Bartlett:
1.9% (75)Tennessee:
0.2% (573)
Poland Bartlett:
1.9% (75)Tennessee:
0.4% (1,632)
Lebanon Bartlett:
1.9% (75)Tennessee:
0.3% (1,042)
Jordan Bartlett:
1.8% (72)Tennessee:
0.3% (980)
Canada Bartlett:
1.7% (67)Tennessee:
2.7% (10,295)
India Bartlett:
1.6% (66)Tennessee:
6.1% (23,079)
Dominica Bartlett:
1.5% (61)Tennessee:
0.0% (83)
Place of birth for U.S.-born residents:
This state: 30,981Other state: 21,189Northeast: 1,694Midwest: 4,671South: 12,582West: 2,214 89.8% of Bartlett residents lived in the same house 1 years ago.
Out of people who lived in different houses, 40.8% lived in this county.
Out of people who lived in different counties, 62.5% lived in Tennessee.
Bartlett:
89.8%State average:
87.0%
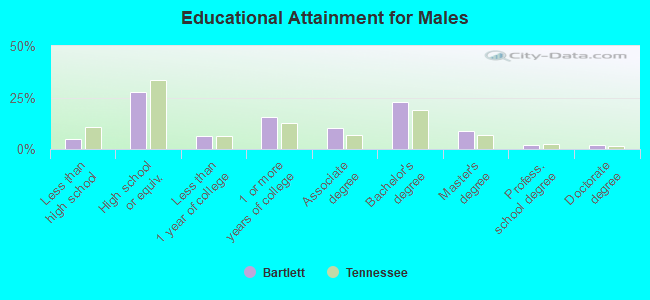
Education attainment for males 25 years and older:
No schooling: 115Nursery to 4th grade: 135th and 6th grade: 797th and 8th grade: 829th grade: 7610th grade: 9911th grade: 8812th grade, no diploma: 400High school graduate (or equivalency): 5,184Less than 1 year of college: 1,211Some college more than 1 year, no degree: 2,896Associate degree: 1,922Bachelor's degree: 4,292Master's degree: 1,677Professional school degree: 394Doctorate degree: 369
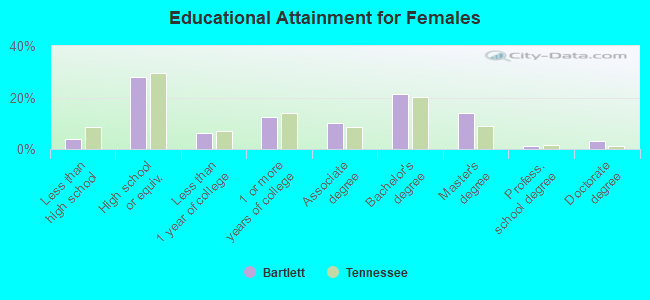
Education attainment for females 25 years and older:
No schooling: 117Nursery to 4th grade: 125th and 6th grade: 527th and 8th grade: 1989th grade: 7310th grade: 14611th grade: 7712th grade, no diploma: 148High school graduate (or equivalency): 5,937Less than 1 year of college: 1,287Some college more than 1 year, no degree: 2,658Associate degree: 2,158Bachelor's degree: 4,538Master's degree: 2,963Professional school degree: 214Doctorate degree: 621
Housing units in structures:
One, detached: 19,037One, attached: 259Two: 893 or 4: 1895 to 9: 27110 to 19: 40520 to 49: 3950 or more: 338Mobile homes: 127Housing units lacking complete plumbing facilities in 2022: 0.4%Housing units lacking complete kitchen facilities in 2022: 1.4%House/condo owner moved in on average 11 years ago
Renter moved in on average 5 years ago
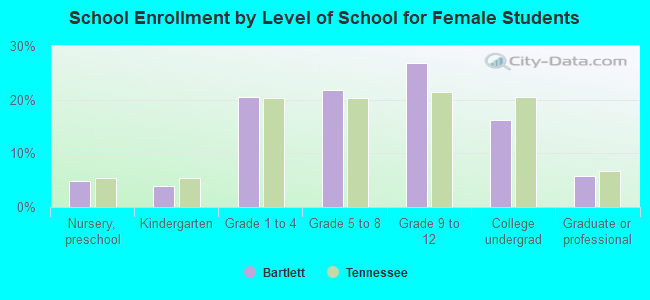
Private vs. public school enrollment:
Students in private schools in grades 1 to 8 (elementary and middle school): 1,149 Here:
20.2%Tennessee:
15.0%
Students in private schools in grades 9 to 12 (high school): 620 Here:
17.8%Tennessee:
16.2%
Students in private undergraduate colleges: 351 Here:
15.8%Tennessee:
23.5%