Baton Rouge, LA (Louisiana) Houses and Residents
| Baton Rouge: | $224,600 |
| Louisiana: | $209,200 |
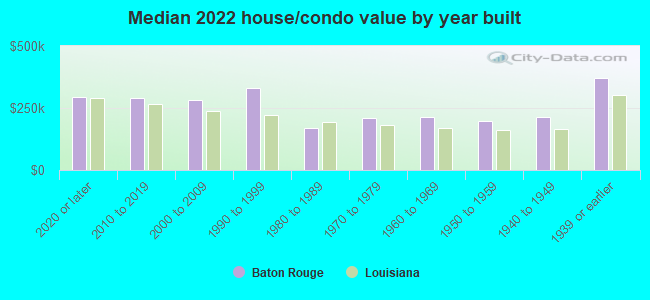
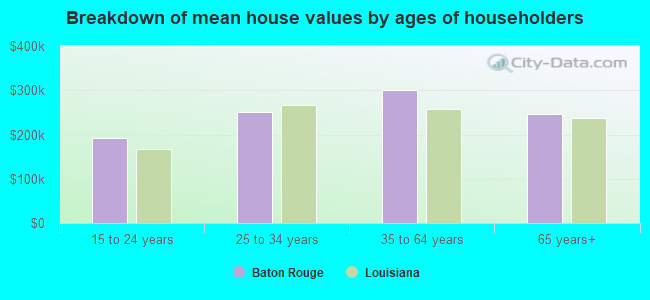
Mean price in 2022:
Detached houses: $319,087
Here: $319,087 State: $273,555 Townhouses or other attached units: $224,085
Here: $224,085 State: $297,713 In 2-unit structures: $91,863
Here: $91,863 State: $325,117 In 3-to-4-unit structures: $223,304
Here: $223,304 State: $213,088 In 5-or-more-unit structures: $183,549
Here: $183,549 State: $257,054 Mobile homes: $42,032
Here: $42,032 State: $89,857
Total population: 228,895 (Urban population: 227,807, Rural population: 113 (22 farm, 91 nonfarm))
Houses: 106,202 (89,204 occupied: 40,195 owner occupied, 49,009 renter occupied)
| % of renters here: | 55% |
| State: | 32% |
Housing density: 1,382 houses/condos per square mile
Median price asked for vacant for-sale houses and condos in 2022: $147,398.
Median contract rent in 2022: $832 (lower quartile is $632, upper quartile is $1,095)
Median rent asked for vacant for-rent units in 2022: $1,087
Median gross rent in Baton Rouge, LA in 2022: $1,005
Housing units in Baton Rouge with a mortgage: 22,625 (1,813 second mortgage, 0 home equity loan, 1,516 both second mortgage and home equity loan)
Houses without a mortgage: 570
Median household income for houses/condos with a mortgage: $94,246
Median household income for apartments without a mortgage: $48,107
Median monthly housing costs: $1,026
Compare current foreclosures in Baton Rouge, LA:
| Photo | Address | Area | Beds / Baths | Price | Details |
|---|---|---|---|---|---|

|
#1
Elgin St
Baton Rouge, LA 70805
|
1,025 sq. feet
|
1 baths 3 beds |
$115,000
|
show details |

|
#2
Sharp Rd
Baton Rouge, LA 70815
|
2,384 sq. feet
|
2 baths 3 beds |
$260,000
|
show details |

|
#3
Sycamore St
Baton Rouge, LA 70805
|
1,240 sq. feet
|
1 baths 3 beds |
$135,500
|
show details |

|
#4
Clairmont Ave
Baton Rouge, LA 70812
|
1,340 sq. feet
|
2 baths 3 beds |
$172,500
|
show details |

|
#5
Oriole St
Baton Rouge, LA 70807
|
- sq. feet
|
3 baths 5 beds |
$74,900
|
show details |

|
#6
Murlin Ave
Baton Rouge, LA 70817
|
- sq. feet
|
2 baths 3 beds |
$284,900
|
show details |

|
#7
N Jefferson Place Cr Unit B
Baton Rouge, LA 70809
|
1,689 sq. feet
|
3 baths 3 beds |
show details | |

|
#8
Mayflower St
Baton Rouge, LA 70802
|
- sq. feet
|
2 baths 3 beds |
$264,900
|
show details |

|
#9
Bank St
Baton Rouge, LA 70805
|
- sq. feet
|
- baths - beds |
$6,010
|
show details |

|
#10
Peach St
Baton Rouge, LA 70802
|
- sq. feet
|
- baths - beds |
$6,010
|
show details |
| Photo | Address | Area | Beds / Baths | Price | Details |
|---|---|---|---|---|---|

|
#11
N 39th St
Baton Rouge, LA 70802
|
- sq. feet
|
- baths - beds |
$6,010
|
show details |

|
#12
Monte Sano Ave
Baton Rouge, LA 70807
|
- sq. feet
|
- baths - beds |
$6,010
|
show details |

|
#13
Und Wren St
Baton Rouge, LA 70807
|
- sq. feet
|
- baths - beds |
$6,010
|
show details |

|
#14
Monarch Ave
Baton Rouge, LA 70811
|
- sq. feet
|
- baths - beds |
$6,010
|
show details |

|
#15
Provost St
Baton Rouge, LA 70802
|
- sq. feet
|
- baths - beds |
$6,010
|
show details |

|
#16
Baranco St
Baton Rouge, LA 70807
|
- sq. feet
|
- baths - beds |
$6,010
|
show details |

|
#17
Amos St
Baton Rouge, LA 70802
|
- sq. feet
|
- baths - beds |
$6,010
|
show details |

|
#18
Und Virginia St
Baton Rouge, LA 70802
|
- sq. feet
|
- baths - beds |
$6,010
|
show details |

|
#19
Sherwood St
Baton Rouge, LA 70805
|
- sq. feet
|
- baths - beds |
$6,010
|
show details |

|
#20
69th Ave
Baton Rouge, LA 70807
|
- sq. feet
|
- baths - beds |
$6,010
|
show details |
| Photo | Address | Area | Beds / Baths | Price | Details |
|---|---|---|---|---|---|

|
#21
Jackson Ave
Baton Rouge, LA 70806
|
- sq. feet
|
- baths - beds |
$6,010
|
show details |

|
#22
Paige St
Baton Rouge, LA 70811
|
- sq. feet
|
- baths - beds |
$6,010
|
show details |

|
#23
Colorado St
Baton Rouge, LA 70802
|
- sq. feet
|
- baths - beds |
$6,010
|
show details |

|
#24
N 41st St
Baton Rouge, LA 70802
|
- sq. feet
|
- baths - beds |
$6,010
|
show details |

|
#25
Und Tilden St
Baton Rouge, LA 70802
|
- sq. feet
|
- baths - beds |
$6,010
|
show details |

|
#26
N 37th St
Baton Rouge, LA 70802
|
- sq. feet
|
- baths - beds |
$6,010
|
show details |

|
#27
75th Ave
Baton Rouge, LA 70807
|
- sq. feet
|
- baths - beds |
$6,010
|
show details |

|
#28
Elm Dr
Baton Rouge, LA 70805
|
- sq. feet
|
- baths - beds |
$6,010
|
show details |

|
#29
Alliquippa St
Baton Rouge, LA 70805
|
- sq. feet
|
- baths - beds |
$6,010
|
show details |

|
#30
Jackson Ave
Baton Rouge, LA 70806
|
- sq. feet
|
- baths - beds |
$6,010
|
show details |
| Photo | Address | Area | Beds / Baths | Price | Details |
|---|---|---|---|---|---|

|
#31
O Dell St
Baton Rouge, LA 70802
|
- sq. feet
|
- baths - beds |
$6,010
|
show details |

|
#32
N 35th St
Baton Rouge, LA 70802
|
- sq. feet
|
- baths - beds |
$6,010
|
show details |

|
#33
Alabama St
Baton Rouge, LA 70802
|
- sq. feet
|
- baths - beds |
$6,010
|
show details |

|
#34
N 38th St
Baton Rouge, LA 70802
|
- sq. feet
|
- baths - beds |
$6,010
|
show details |

|
#35
Greenwell Springs Rd
Baton Rouge, LA 70806
|
- sq. feet
|
- baths - beds |
$6,010
|
show details |

|
#36
Hemlock St
Baton Rouge, LA 70802
|
- sq. feet
|
- baths - beds |
$6,010
|
show details |

|
#37
Und Jay St
Baton Rouge, LA 70807
|
- sq. feet
|
- baths - beds |
$6,010
|
show details |

|
#38
Taylor St
Baton Rouge, LA 70802
|
- sq. feet
|
- baths - beds |
$6,010
|
show details |

|
#39
Paige St
Baton Rouge, LA 70811
|
- sq. feet
|
- baths - beds |
$6,010
|
show details |

|
#40
N 25th St
Baton Rouge, LA 70806
|
- sq. feet
|
- baths - beds |
$6,010
|
show details |
| Photo | Address | Area | Beds / Baths | Price | Details |
|---|---|---|---|---|---|

|
#41
Und 72nd Ave
Baton Rouge, LA 70807
|
- sq. feet
|
- baths - beds |
$6,010
|
show details |

|
#42
Und Jefferson Ave
Baton Rouge, LA 70802
|
- sq. feet
|
- baths - beds |
$6,010
|
show details |

|
#43
Breckenridge Ave
Baton Rouge, LA 70805
|
- sq. feet
|
- baths - beds |
$6,010
|
show details |

|
#44
Noah St
Baton Rouge, LA 70802
|
- sq. feet
|
- baths - beds |
$6,010
|
show details |

|
#45
Packard St
Baton Rouge, LA 70811
|
- sq. feet
|
- baths - beds |
$6,010
|
show details |

|
#46
Prescott Rd
Baton Rouge, LA 70805
|
- sq. feet
|
- baths - beds |
$6,010
|
show details |

|
#47
Und Jay St
Baton Rouge, LA 70807
|
- sq. feet
|
- baths - beds |
$6,010
|
show details |

|
#48
Und Kansas St
Baton Rouge, LA 70802
|
- sq. feet
|
- baths - beds |
$6,010
|
show details |

|
#49
Und 68th Ave
Baton Rouge, LA 70807
|
- sq. feet
|
- baths - beds |
$6,010
|
show details |

|
Check over 1 million property listings on Foreclosure.com!
|
browse all offers | |||


Median year apartment built: 1981
Household type by relationship:
Households: 221,451- Male householders: 39,076 (15,468 living alone), Female householders: 50,128 (18,932 living alone)
25,043 spouses (24,708 opposite-sex spouses), 6,682 unmarried partners, (5,962 opposite-sex unmarried partners), 57,424 children (55,968 natural, 694 adopted, 762 stepchildren), 8,509 grandchildren, 3,878 brothers or sisters, 778 parents, 0 foster children, 4,618 other relatives, 10,911 non-relatives
- In group quarters: 14,404
Size of family households: 24,704 2-persons, 8,799 3-persons, 6,527 4-persons, 3,791 5-persons, 872 6-persons, 372 7-or-more-persons.
Size of nonfamily households: 34,400 1-person, 6,188 2-persons, 2,667 3-persons, 725 4-persons, 90 5-persons, 69 7-or-more-persons.
14,610 married couples with children.
24,356 single-parent households (2,674 men, 21,682 women).
91.5% of residents of Baton Rouge speak English at home.
3.0% of residents speak Spanish at home (48% speak English very well, 16% speak English well, 19% speak English not well, 17% don't speak English at all).
1.9% of residents speak other Indo-European language at home (73% speak English very well, 25% speak English well, 2% speak English not well).
2.8% of residents speak Asian or Pacific Island language at home (57% speak English very well, 22% speak English well, 17% speak English not well, 5% don't speak English at all).
0.8% of residents speak other language at home (60% speak English very well, 25% speak English well, 11% speak English not well, 4% don't speak English at all).
Foreign born population: 15,594 (7.0%)
(39.0% of them are naturalized citizens)
| Here: | 6.4 |
| State: | 6.2 |
| Here: | 4.1 |
| State: | 4.4 |
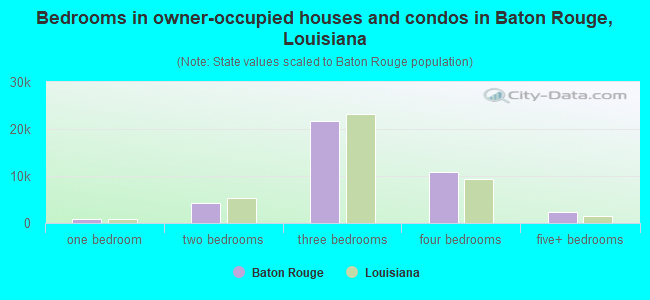
- Bedrooms in owner-occupied houses and condos in Baton Rouge, Louisiana
- 129no bedroom
- 9191 bedroom
- 4,2772 bedrooms
- 21,7773 bedrooms
- 10,7994 bedrooms
- 2,2945+ bedrooms
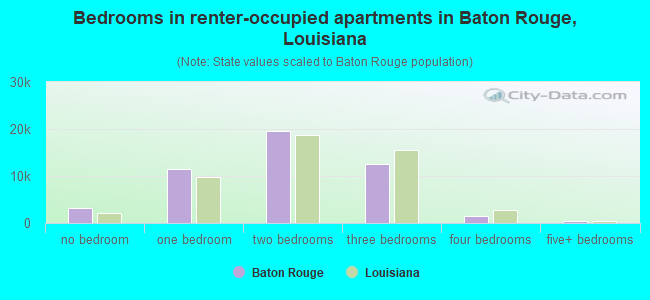
- Bedrooms in renter-occupied apartments in Baton Rouge, Louisiana
- 3,221no bedroom
- 11,5251 bedroom
- 19,6632 bedrooms
- 12,6123 bedrooms
- 1,5324 bedrooms
- 4565+ bedrooms
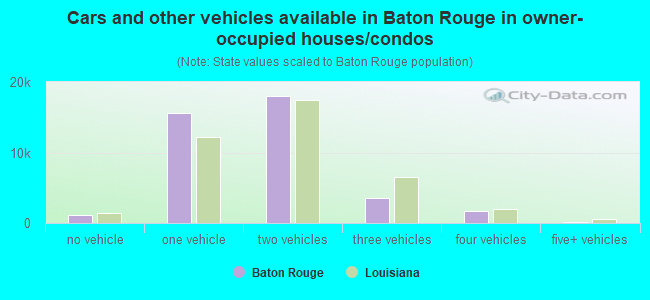
- Cars and other vehicles available in Baton Rouge in owner-occupied houses/condos
- 1,200no vehicle
- 15,6131 vehicle
- 18,0012 vehicles
- 3,5183 vehicles
- 1,7534 vehicles
- 1105+ vehicles
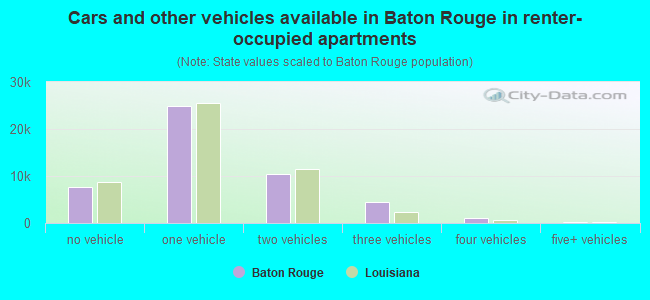
- Cars and other vehicles available in Baton Rouge in renter-occupied apartments
- 7,750no vehicle
- 24,9101 vehicle
- 10,4612 vehicles
- 4,5413 vehicles
- 1,0394 vehicles
- 3085+ vehicles
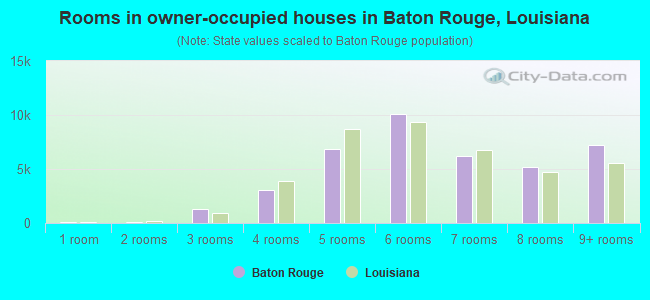
- Rooms in owner-occupied houses in Baton Rouge, Louisiana
- 1291 room
- 692 rooms
- 1,2733 rooms
- 3,0654 rooms
- 6,8735 rooms
- 10,1216 rooms
- 6,2447 rooms
- 5,2138 rooms
- 7,2089+ rooms
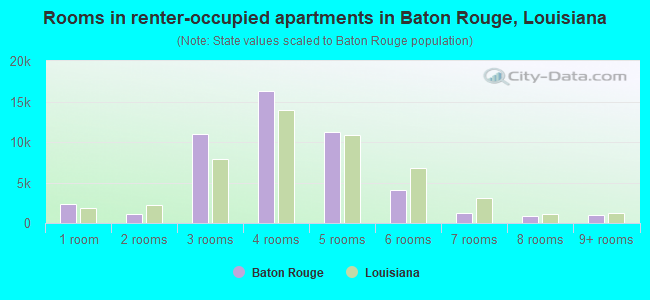
- Rooms in renter-occupied apartments in Baton Rouge, Louisiana
- 2,3321 room
- 1,1002 rooms
- 10,9873 rooms
- 16,2624 rooms
- 11,2885 rooms
- 4,0526 rooms
- 1,2157 rooms
- 8158 rooms
- 9589+ rooms
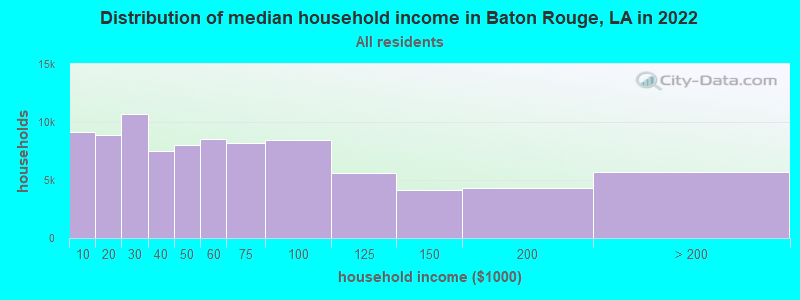
Baton Rouge, LA household income distribution

- 9,173Less than $10,000
- 8,838$10,000 to $19,999
- 10,729$20,000 to $29,999
- 7,514$30,000 to $39,999
- 7,978$40,000 to $49,999
- 8,568$50,000 to $59,999
- 8,188$60,000 to $74,999
- 8,423$75,000 to $99,999
- 5,619$100,000 to $124,999
- 4,173$125,000 to $149,999
- 4,275$150,000 to $199,999
- 5,726$200,000 or more
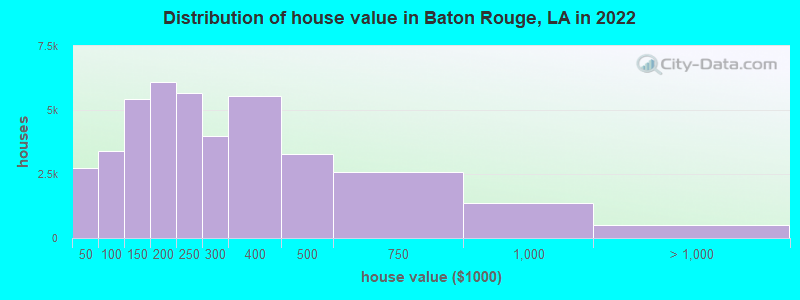
Home value of owner - occupied houses in 2022 in Baton Rouge, LA
-
- 377Less than $10,000
- 178$10,000 to $14,999
- 117$15,000 to $19,999
- 107$20,000 to $24,999
- 1,400$25,000 to $29,999
- 248$30,000 to $34,999
- 325$40,000 to $49,999
- 739$50,000 to $59,999
- 439$60,000 to $69,999
- 402$70,000 to $79,999
- 641$80,000 to $89,999
- 834$90,000 to $99,999
- 3,146$100,000 to $124,999
- 2,277$125,000 to $149,999
- 2,974$150,000 to $174,999
- 3,101$175,000 to $199,999
- 5,671$200,000 to $249,999
- 3,967$250,000 to $299,999
- 5,536$300,000 to $399,999
- 3,275$400,000 to $499,999
- 2,560$500,000 to $749,999
- 1,380$750,000 to $999,999
- 222$1,000,000 to $1,499,999
- 52$1,500,000 to $1,999,999
- 227$2,000,000 or more
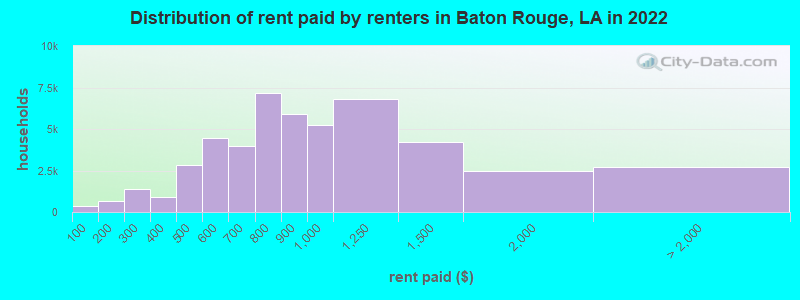
Rent paid by renters in 2022 in Baton Rouge, LA
-
- 335Less than $100
- 274$100 to $149
- 382$150 to $199
- 1,102$200 to $249
- 271$250 to $299
- 316$300 to $349
- 615$350 to $399
- 1,669$400 to $449
- 1,153$450 to $499
- 2,387$500 to $549
- 2,053$550 to $599
- 1,954$600 to $649
- 2,020$650 to $699
- 3,243$700 to $749
- 3,940$750 to $799
- 5,900$800 to $899
- 5,258$900 to $999
- 6,797$1,000 to $1,249
- 4,191$1,250 to $1,499
- 2,458$1,500 to $1,999
- 313$2,000 to $2,499
- 86$3,000 to $3,499
- 539$3,500 or more
- 1,753No cash rent
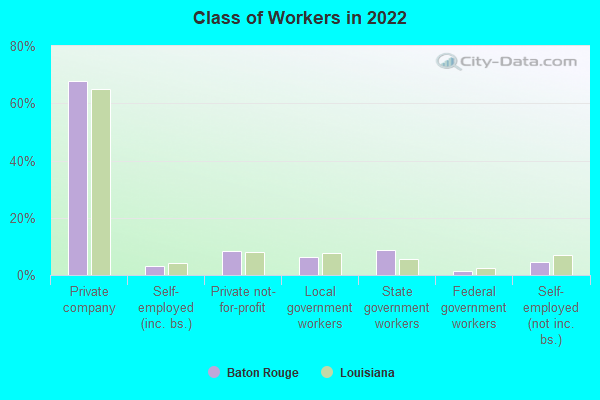
Percentage of workers working in this county: 85.5%
Number of people working at home: 8,476 (8.2% of all workers)
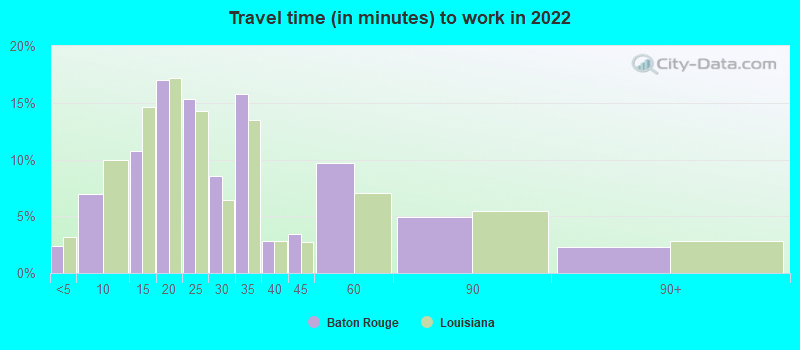
Travel time to work (commute)
- Less than 5 minutes: 1,560
- 5 to 9 minutes: 8,390
- 10 to 14 minutes: 14,293
- 15 to 19 minutes: 23,785
- 20 to 24 minutes: 18,132
- 25 to 29 minutes: 7,328
- 30 to 34 minutes: 11,907
- 35 to 39 minutes: 333
- 40 to 44 minutes: 1,713
- 45 to 59 minutes: 4,767
- 60 to 89 minutes: 1,326
- 90 or more minutes: 1,880
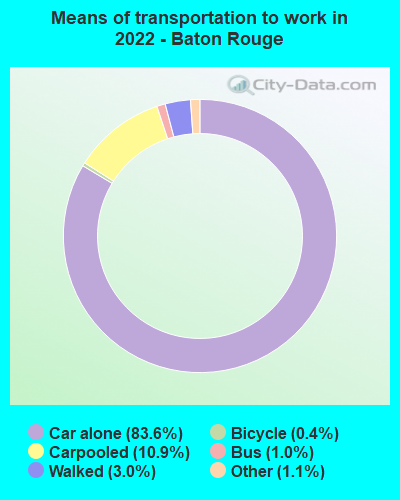
Means of transportation to work:
- Drove a car alone: 136,351 (79.5%)
- Carpooled: 17,762 (10.4%)
- Bus: 1,618 (0.9%)
- Taxi: 1,747 (1.0%)
- Bicycle: 647 (0.4%)
- Walked: 4,894 (2.9%)
- Worked at home: 8,476 (4.9%)
- Unemployment by race in 2022
- Unemployment rate for White non-Hispanic residents
- 1.7%Males
- 0.8%Females
- Unemployment rate for Black residents
- 8.9%Males
- 10.3%Females
- Unemployment rate for Asian residents
- 4.5%Males
- 7.8%Females
- Unemployment rate for other race residents
- 1.2%Males
- 28.2%Females
- Unemployment rate for two or more race residents
- 24.9%Males
- 11.7%Females
- Unemployment rate for Hispanic or Latino residents
- 3.2%Males
- 13.8%Females
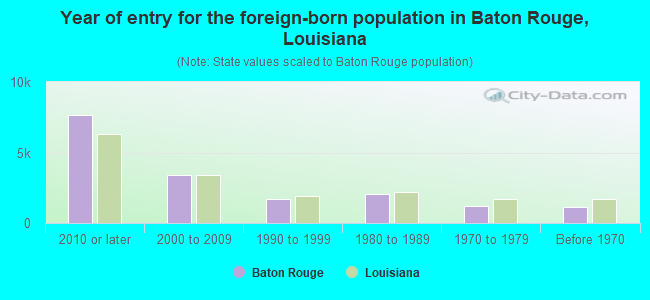
- Year of entry for the foreign-born population in Baton Rouge, Louisiana
- 7,6512010 or later
- 3,4182000 to 2009
- 1,7131990 to 1999
- 2,0461980 to 1989
- 1,2311970 to 1979
- 1,122Before 1970
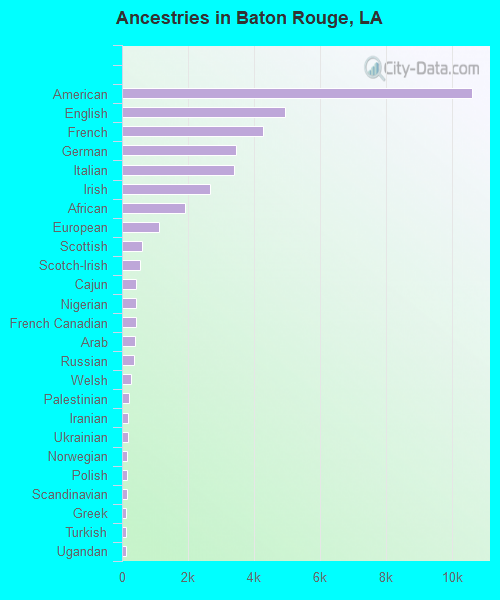
First ancestries reported:
- American: 10,598 (7.5%)
- English: 4,949 (3.5%)
- French: 4,264 (3.0%)
- German: 3,458 (2.4%)
- Italian: 3,404 (2.4%)
- Irish: 2,670 (1.9%)
- African: 1,905 (1.3%)
- European: 1,108 (0.8%)
- Scottish: 615 (0.4%)
- Scotch-Irish: 550 (0.4%)
- Cajun: 425 (0.3%)
- Nigerian: 419 (0.3%)
- French Canadian: 411 (0.3%)
- Arab: 392 (0.3%)
- Russian: 363 (0.3%)
- Welsh: 273 (0.2%)
- Palestinian: 200 (0.1%)
- Iranian: 194 (0.1%)
- Ukrainian: 186 (0.1%)
- Norwegian: 164 (0.1%)
- Polish: 161 (0.1%)
- Scandinavian: 157 (0.1%)
- Greek: 133 (0.09%)
- Turkish: 131 (0.09%)
- Ugandan: 122 (0.09%)
- Lebanese: 117 (0.08%)
- Swedish: 115 (0.08%)
- Ghanaian: 110 (0.08%)
- Dutch: 97 (0.07%)
- Australian: 83 (0.06%)
- British: 82 (0.06%)
- Jamaican: 64 (0.05%)
- Egyptian: 62 (0.04%)
- Moroccan: 54 (0.04%)
- Armenian: 48 (0.03%)
- Syrian: 43 (0.03%)
- Canadian: 42 (0.03%)
- Northern European: 40 (0.03%)
- Swiss: 39 (0.03%)
- Lithuanian: 36 (0.03%)
- Trinidadian and Tobagonian: 34 (0.02%)
- Bulgarian: 30 (0.02%)
- Czech: 29 (0.02%)
- Macedonian: 28 (0.02%)
- Romanian: 24 (0.02%)
- Belizean: 24 (0.02%)
- Sudanese: 22 (0.02%)
- Zimbabwean: 22 (0.02%)
- Eastern European: 19 (0.01%)
- Austrian: 18 (0.01%)
- Hungarian: 17 (0.01%)
- Portuguese: 16 (0.01%)
- Belgian: 15 (0.01%)
- Slovene: 14 (0.01%)
- Finnish: 13 (0.01%)
- Celtic: 12 (0.01%)
- Basque: 10 (0.01%)
- Ethiopian: 10 (0.01%)
Most common places of birth for foreign-born residents (%):
| Baton Rouge: | 17.7% (2,564) |
| Louisiana: | 9.2% (18,115) |
| Baton Rouge: | 13.3% (1,924) |
| Louisiana: | 18.9% (37,225) |
| Baton Rouge: | 6.2% (903) |
| Louisiana: | 3.4% (6,779) |
| Baton Rouge: | 4.6% (669) |
| Louisiana: | 0.7% (1,446) |
| Baton Rouge: | 4.5% (651) |
| Louisiana: | 2.2% (4,241) |
| Baton Rouge: | 4.2% (604) |
| Louisiana: | 3.9% (7,741) |
| Baton Rouge: | 4.0% (580) |
| Louisiana: | 3.1% (6,086) |
| Baton Rouge: | 3.7% (534) |
| Louisiana: | 2.1% (4,115) |
| Baton Rouge: | 3.3% (482) |
| Louisiana: | 0.5% (935) |
| Baton Rouge: | 2.7% (394) |
| Louisiana: | 12.1% (23,732) |
| Baton Rouge: | 2.7% (393) |
| Louisiana: | 2.8% (5,576) |
| Baton Rouge: | 1.9% (282) |
| Louisiana: | 1.6% (3,186) |
| Baton Rouge: | 1.9% (281) |
| Louisiana: | 1.0% (2,002) |
| Baton Rouge: | 1.9% (272) |
| Louisiana: | 1.0% (1,951) |
| Baton Rouge: | 1.6% (232) |
| Louisiana: | 0.7% (1,368) |
| Baton Rouge: | 1.5% (221) |
| Louisiana: | 0.7% (1,435) |
Place of birth for U.S.-born residents:
- This state: 165,386
- Other state: 39,454
- Northeast: 6,749
- Midwest: 7,132
- South: 22,154
- West: 3,419
75.6% of Baton Rouge residents lived in the same house 1 years ago.
Out of people who lived in different houses, 37.9% lived in this county.
Out of people who lived in different counties, 59.2% lived in Louisiana.
| Baton Rouge: | 75.6% |
| State average: | 88.3% |
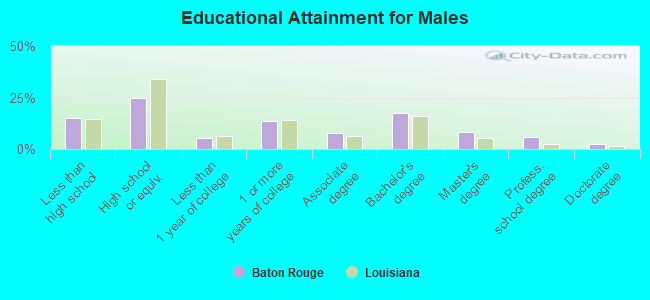
Education attainment for males 25 years and older:
- No schooling: 906
- Nursery to 4th grade: 656
- 5th and 6th grade: 1,144
- 7th and 8th grade: 381
- 9th grade: 357
- 10th grade: 792
- 11th grade: 2,282
- 12th grade, no diploma: 2,496
- High school graduate (or equivalency): 15,042
- Less than 1 year of college: 3,127
- Some college more than 1 year, no degree: 8,211
- Associate degree: 4,799
- Bachelor's degree: 10,675
- Master's degree: 4,992
- Professional school degree: 3,494
- Doctorate degree: 1,426
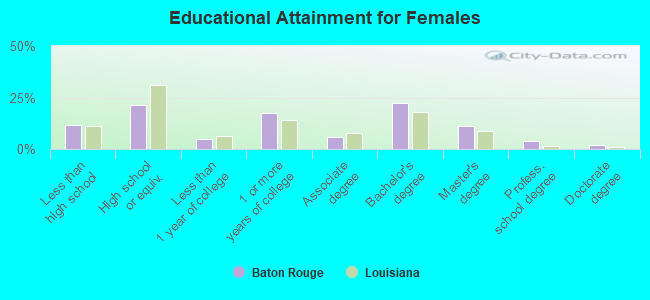
Education attainment for females 25 years and older:
- No schooling: 976
- Nursery to 4th grade: 181
- 5th and 6th grade: 294
- 7th and 8th grade: 261
- 9th grade: 1,227
- 10th grade: 1,680
- 11th grade: 1,968
- 12th grade, no diploma: 1,555
- High school graduate (or equivalency): 15,340
- Less than 1 year of college: 3,379
- Some college more than 1 year, no degree: 12,457
- Associate degree: 4,131
- Bachelor's degree: 15,722
- Master's degree: 7,850
- Professional school degree: 2,645
- Doctorate degree: 1,450


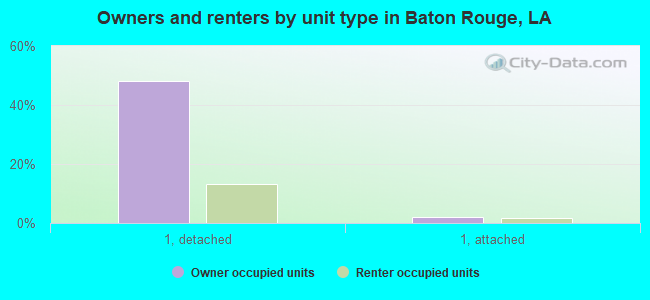
Housing units in structures:
- One, detached: 57,376
- One, attached: 3,303
- Two: 2,539
- 3 or 4: 10,547
- 5 to 9: 7,671
- 10 to 19: 6,590
- 20 to 49: 7,365
- 50 or more: 10,036
- Mobile homes: 722
- Boats, RVs, vans, etc.: 53
Median worth of mobile homes: $31,130
Housing units lacking complete kitchen facilities in 2022: 5.4%
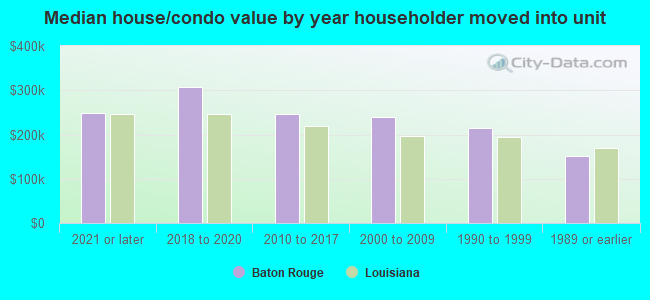
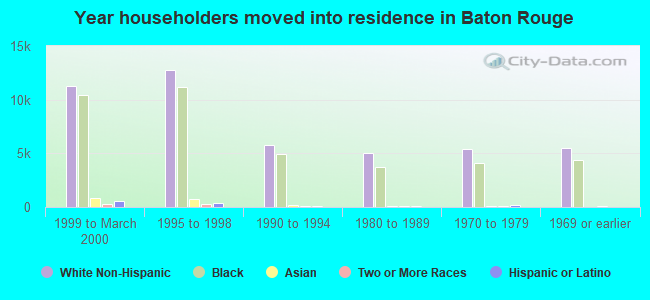
House/condo owner moved in on average 15 years ago
Renter moved in on average 2 years ago
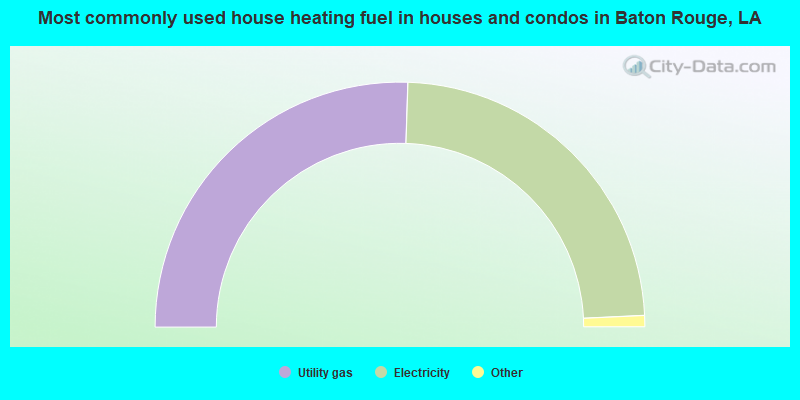
- 51.1%Utility gas
- 47.5%Electricity
- 1.0%Bottled, tank, or LP gas
- 0.3%No fuel used
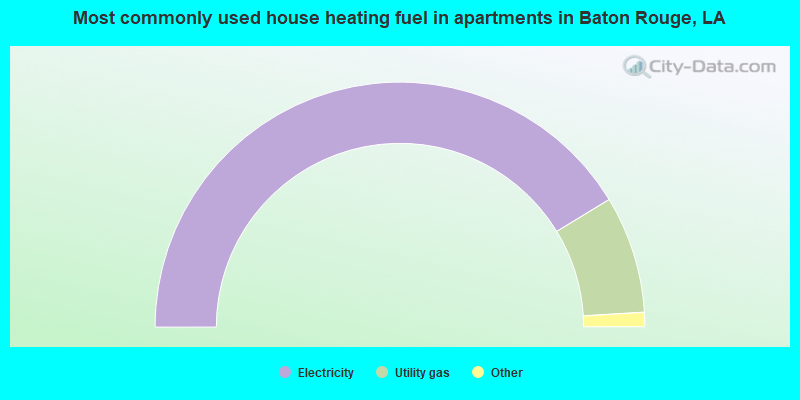
- 82.6%Electricity
- 15.5%Utility gas
- 1.1%No fuel used
- 0.6%Bottled, tank, or LP gas
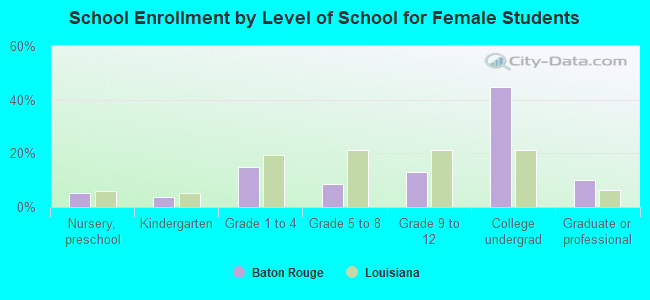
Private vs. public school enrollment:
| Here: | 23.2% |
| Louisiana: | 19.6% |
| Here: | 17.8% |
| Louisiana: | 18.3% |
| Here: | 7.1% |
| Louisiana: | 17.4% |