Housing density: 2,984 houses/condos per square mile
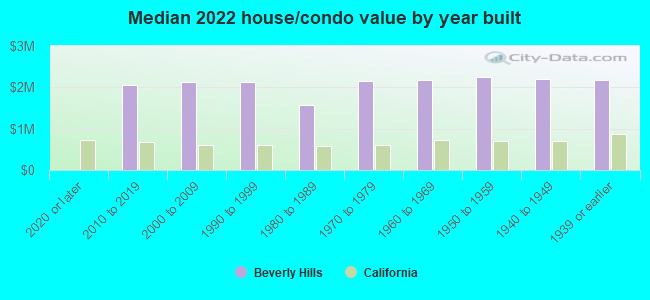
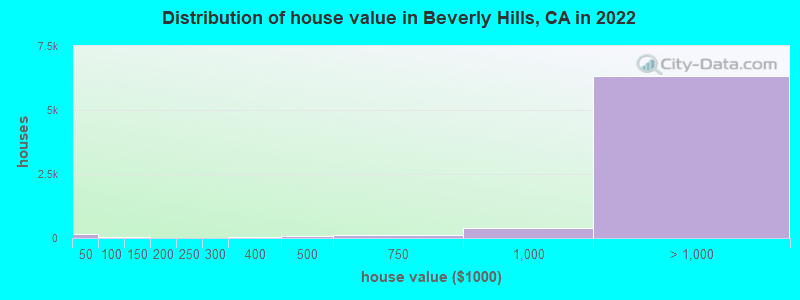
Median price asked for vacant for-sale houses and condos in 2022: $3,532,053.
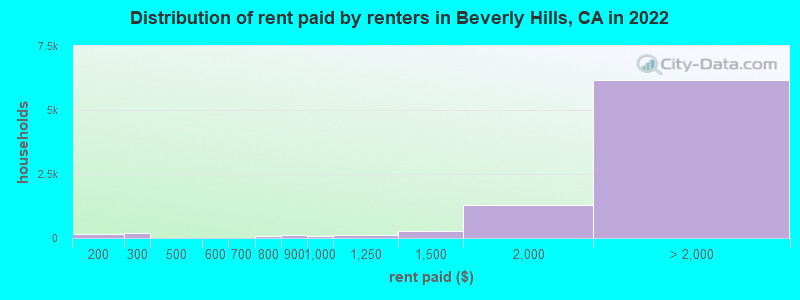
Median contract rent in 2022: over $2,000 (lower quartile is $1,921, upper quartile is over $2,000)
Median rent asked for vacant for-rent units in 2022: $3,129
Median gross rent in Beverly Hills, CA in 2022: over $2,000
Housing units in Beverly Hills with a mortgage: 3,695 (585 second mortgage, 36 home equity loan, 456 both second mortgage and home equity loan) Houses without a mortgage: 90
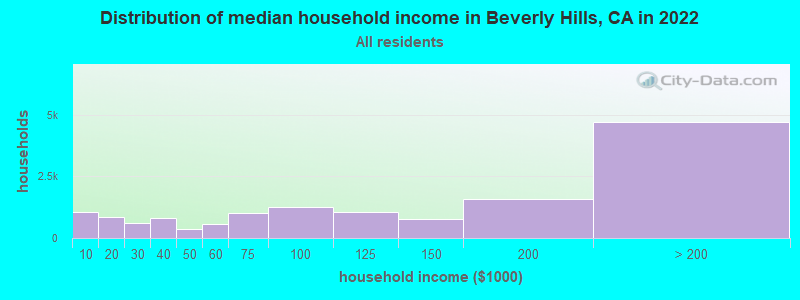
Median household income for houses/condos with a mortgage: $225,628
Median household income for apartments without a mortgage: $184,996
Median monthly housing costs: $3,094
Compare current foreclosures in Beverly Hills, CA:
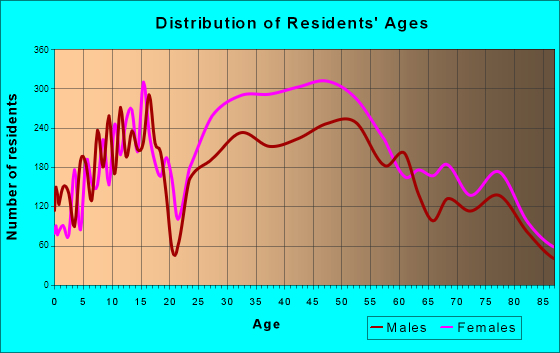
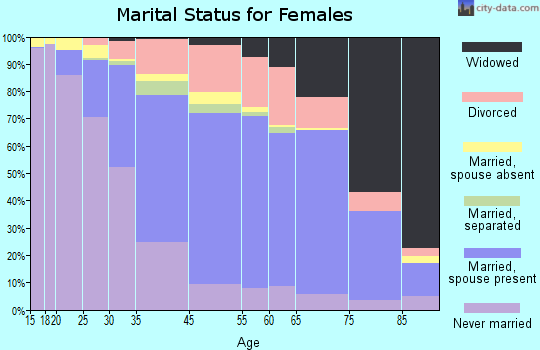
3,980 married couples with children.
1,077 single-parent households (389 men, 688 women).
59.1% of residents of Beverly Hills speak English at home.
6.9% of residents speak Spanish at home (86% speak English very well, 9% speak English well, 3% speak English not well, 2% don't speak English at all).
23.8% of residents speak other Indo-European language at home (69% speak English very well, 22% speak English well, 8% speak English not well, 1% don't speak English at all).
7.9% of residents speak Asian or Pacific Island language at home (55% speak English very well, 25% speak English well, 15% speak English not well, 6% don't speak English at all).
3.4% of residents speak other language at home (92% speak English very well, 6% speak English well, 2% speak English not well).
Foreign born population: 11,896 (37.5%)
(74.0% of them are naturalized citizens)
Percentage of workers working in this county: 97.3% Number of people working at home: 4,795 (32.4% of all workers)
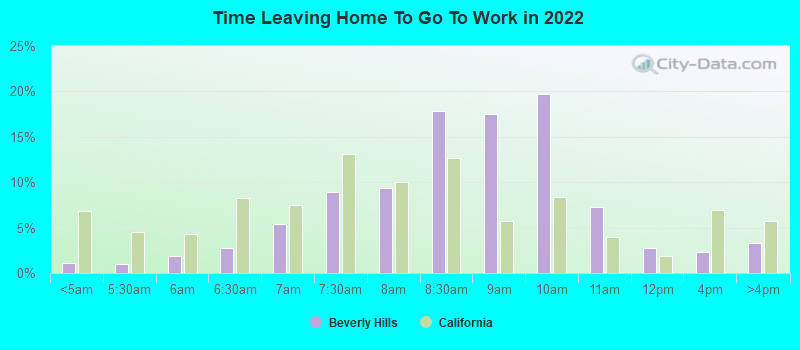
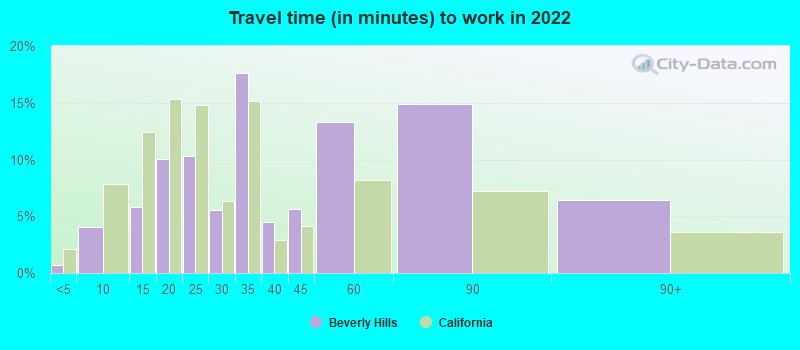
Travel time to work (commute)
Less than 5 minutes: 191
5 to 9 minutes: 1,491
10 to 14 minutes: 1,453
15 to 19 minutes: 1,549
20 to 24 minutes: 1,649
25 to 29 minutes: 601
30 to 34 minutes: 1,126
35 to 39 minutes: 286
40 to 44 minutes: 463
45 to 59 minutes: 1,160
60 to 89 minutes: 543
90 or more minutes: 183
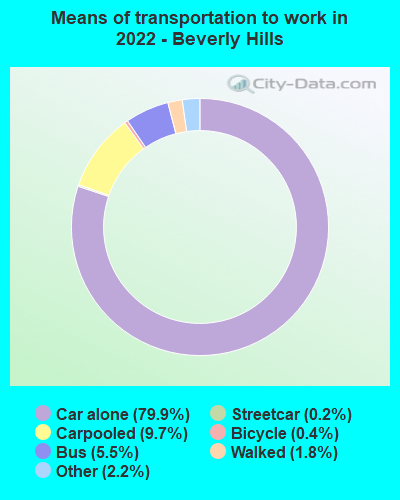
Means of transportation to work:
Drove a car alone: 35,138 (70.1%)
Carpooled: 4,731 (9.4%)
Bus: 2,200 (4.4%)
Subway or elevated rail: 70 (0.1%)
Long-distance train or commuter rail: 25 (0.0%)
Light rail, streetcar or trolley: 10 (0.0%)
Ferryboat: 35 (0.1%)
Taxi: 1,046 (2.1%)
Bicycle: 195 (0.4%)
Walked: 872 (1.7%)
Worked at home: 4,795 (9.6%)
Unemployment by race in 2022
Unemployment rate for White non-Hispanic residents
6.5%Males
6.8%Females
Unemployment rate for Black residents
2.6%Males
13.7%Females
Unemployment rate for American Indian and Alaska Native residents
100.0%Females
Unemployment rate for Asian residents
5.8%Females
Unemployment rate for other race residents
4.1%Females
Unemployment rate for two or more race residents
15.5%Males
15.8%Females
Unemployment rate for Hispanic or Latino residents
2.1%Males
5.7%Females
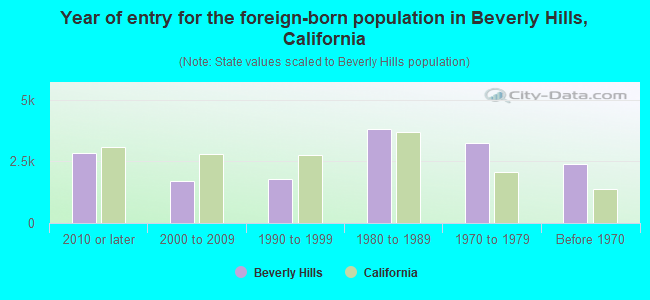
Year of entry for the foreign-born population in Beverly Hills, California
2,8262010 or later
1,7112000 to 2009
1,7971990 to 1999
3,8091980 to 1989
3,2511970 to 1979
2,387Before 1970
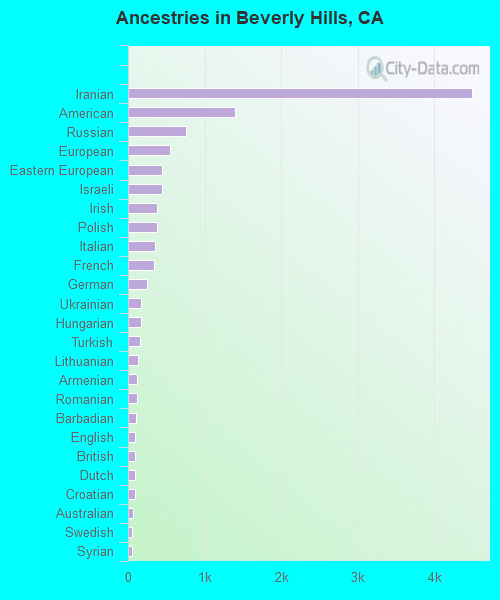
First ancestries reported:
Iranian: 4,488 (24.9%)
American: 1,398 (7.7%)
Russian: 762 (4.2%)
European: 554 (3.1%)
Eastern European: 446 (2.5%)
Israeli: 445 (2.5%)
Irish: 381 (2.1%)
Polish: 373 (2.1%)
Italian: 349 (1.9%)
French: 333 (1.8%)
German: 246 (1.4%)
Ukrainian: 176 (1.0%)
Hungarian: 169 (0.9%)
Turkish: 160 (0.9%)
Lithuanian: 127 (0.7%)
Armenian: 121 (0.7%)
Romanian: 118 (0.7%)
Barbadian: 105 (0.6%)
English: 96 (0.5%)
British: 96 (0.5%)
Dutch: 91 (0.5%)
Croatian: 90 (0.5%)
Australian: 67 (0.4%)
Swedish: 58 (0.3%)
Syrian: 55 (0.3%)
Greek: 51 (0.3%)
Danish: 51 (0.3%)
Scottish: 48 (0.3%)
Afghan: 39 (0.2%)
Palestinian: 37 (0.2%)
Canadian: 36 (0.2%)
Iraqi: 31 (0.2%)
Lebanese: 31 (0.2%)
French Canadian: 29 (0.2%)
Austrian: 28 (0.2%)
Belgian: 24 (0.1%)
Norwegian: 20 (0.1%)
Czechoslovakian: 17 (0.09%)
Czech: 17 (0.09%)
Belizean: 17 (0.09%)
Swiss: 14 (0.08%)
Haitian: 13 (0.07%)
Bulgarian: 11 (0.06%)
Welsh: 9 (0.05%)
Yugoslavian: 9 (0.05%)
Brazilian: 8 (0.04%)
Latvian: 5 (0.03%)
Scandinavian: 4 (0.02%)
Most common places of birth for foreign-born residents (%):
Iran
Beverly Hills:
35.3% (4,199)
California:
2.0% (206,004)
Korea
Beverly Hills:
4.1% (487)
California:
3.0% (315,248)
Israel
Beverly Hills:
4.0% (470)
California:
0.3% (33,029)
Mexico
Beverly Hills:
3.8% (450)
California:
37.2% (3,881,193)
Canada
Beverly Hills:
3.7% (445)
California:
1.2% (127,477)
Philippines
Beverly Hills:
3.3% (395)
California:
7.8% (818,297)
India
Beverly Hills:
3.0% (356)
California:
5.2% (539,184)
France
Beverly Hills:
2.7% (323)
California:
0.4% (40,224)
Pakistan
Beverly Hills:
2.3% (273)
California:
0.5% (49,399)
Japan
Beverly Hills:
2.2% (266)
California:
1.0% (103,575)
China, excluding Hong Kong and Taiwan
Beverly Hills:
2.2% (260)
California:
6.6% (684,672)
Russia
Beverly Hills:
1.9% (230)
California:
0.7% (71,932)
Turkey
Beverly Hills:
1.9% (226)
California:
0.2% (20,474)
Ecuador
Beverly Hills:
1.9% (224)
California:
0.2% (21,276)
Thailand
Beverly Hills:
1.6% (194)
California:
0.6% (65,335)
Place of birth for U.S.-born residents:
This state: 12,554
Other state: 6,527
Northeast: 2,967
Midwest: 1,770
South: 1,169
West: 665
87.7% of Beverly Hills residents lived in the same house 1 years ago. Out of people who lived in different houses, 40.5% lived in this county. Out of people who lived in different counties, 54.8% lived in California.
Beverly Hills:
87.7%
State average:
88.9%
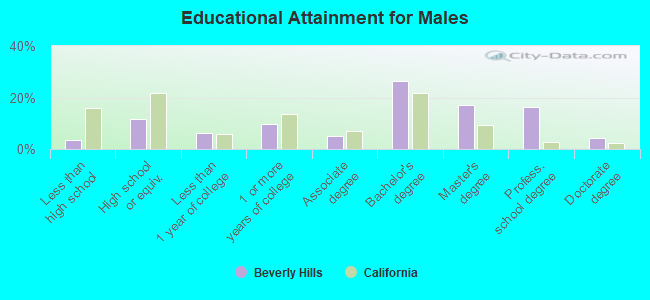
Education attainment for males 25 years and older:
No schooling: 125
Nursery to 4th grade: 7
5th and 6th grade: 18
7th and 8th grade: 0
9th grade: 0
10th grade: 44
11th grade: 31
12th grade, no diploma: 185
High school graduate (or equivalency): 1,317
Less than 1 year of college: 687
Some college more than 1 year, no degree: 1,080
Associate degree: 552
Bachelor's degree: 2,950
Master's degree: 1,944
Professional school degree: 1,847
Doctorate degree: 463
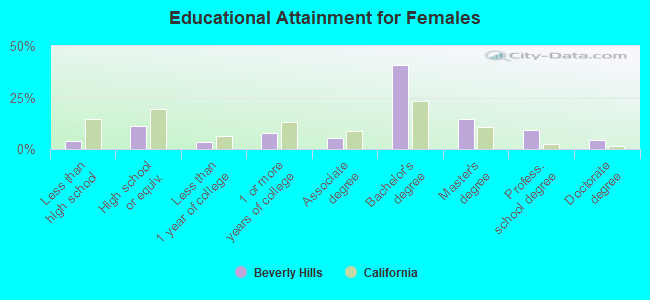
Education attainment for females 25 years and older:
No schooling: 163
Nursery to 4th grade: 45
5th and 6th grade: 73
7th and 8th grade: 7
9th grade: 0
10th grade: 31
11th grade: 0
12th grade, no diploma: 195
High school graduate (or equivalency): 1,533
Less than 1 year of college: 463
Some college more than 1 year, no degree: 1,082
Associate degree: 754
Bachelor's degree: 5,613
Master's degree: 2,007
Professional school degree: 1,249
Doctorate degree: 603
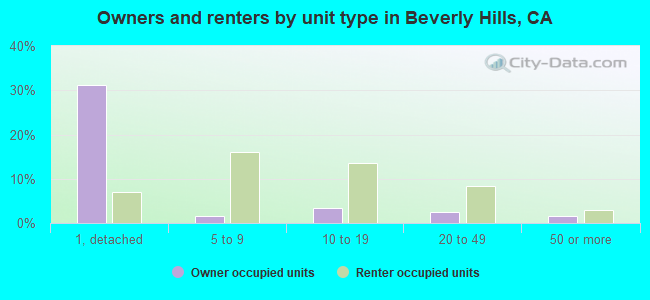
Housing units in structures:
One, detached: 6,529
One, attached: 317
Two: 552
3 or 4: 872
5 to 9: 2,933
10 to 19: 2,936
20 to 49: 1,931
50 or more: 830
Mobile homes: 26
Housing units lacking complete plumbing facilities in 2022: 0.4%
Housing units lacking complete kitchen facilities in 2022: 2.5%
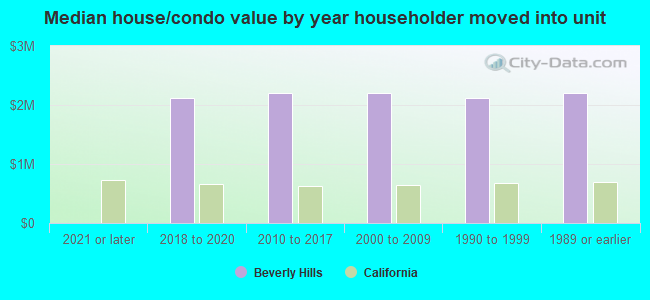
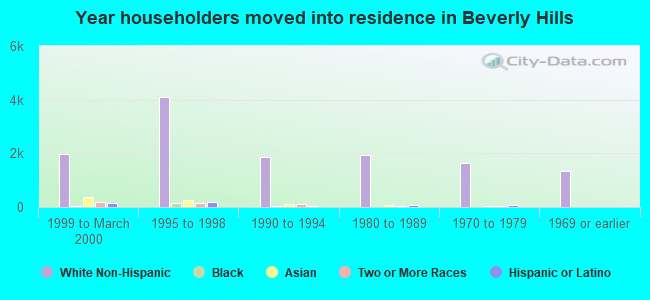
House/condo owner moved in on average 17 years ago