Billerica, MA (Massachusetts) Houses and Residents
| Billerica: | $569,260 |
| Massachusetts: | $534,700 |
Total population: 40,243 (Urban population: 38,620, Rural population: 325 (all nonfarm))
Houses: 13,058 (12,912 occupied: 10,856 owner occupied, 2,056 renter occupied)
| % of renters here: | 16% |
| State: | 38% |
Housing density: 504 houses/condos per square mile
Median price asked for vacant for-sale houses and condos in 2022 in this county: $1,068,910.
Median contract rent in 2022: over $2,000 (lower quartile is $1,540, upper quartile is over $2,000)
Median rent asked for vacant for-rent units in 2022: $1,962
Median gross rent in Billerica, MA in 2022: over $2,000
Housing units in Billerica with a mortgage: 7,673 (675 second mortgage, 1,307 home equity loan, 38 both second mortgage and home equity loan)
Houses without a mortgage: 2,215
Compare current foreclosures near Billerica, MA:
| Photo | Address | Area | Beds / Baths | Price | Details |
|---|---|---|---|---|---|

|
#1
Salem Rd
Billerica, MA 01821
|
1,428 sq. feet
|
1 baths 4 beds |
show details | |

|
#2
Cardington Ave
Billerica, MA 01821
|
1,242 sq. feet
|
1 baths 5 beds |
show details | |

|
#3
Newport Dr
Billerica, MA 01821
|
2,814 sq. feet
|
2 baths 4 beds |
show details | |

|
#4
Middlesex Tpke
Billerica, MA 01821
|
1,175 sq. feet
|
1 baths 3 beds |
show details | |

|
#5
South St
Billerica, MA 01821
|
1,797 sq. feet
|
2 baths 4 beds |
show details | |

|
#6
Millers Farm Rd
Billerica, MA 01821
|
1,632 sq. feet
|
2 baths 3 beds |
show details | |

|
#7
Concord Rd
Billerica, MA 01821
|
1,685 sq. feet
|
1 baths 3 beds |
show details | |

|
#8
Sandberg Rd
Billerica, MA 01821
|
2,168 sq. feet
|
1 baths 4 beds |
show details | |

|
#9
Castlewood Dr
Billerica, MA 01821
|
2,184 sq. feet
|
2 baths 3 beds |
show details | |

|
#10
Payson Rd
Billerica, MA 01821
|
1,922 sq. feet
|
2 baths 4 beds |
show details |
| Photo | Address | Area | Beds / Baths | Price | Details |
|---|---|---|---|---|---|

|
#11
Limewood Ave
Billerica, MA 01821
|
1,409 sq. feet
|
1 baths 3 beds |
show details | |

|
#12
Baldwin Rd
Billerica, MA 01821
|
3,284 sq. feet
|
2 baths 4 beds |
show details | |

|
#13
Woodbury Rd
Billerica, MA 01821
|
1,344 sq. feet
|
2 baths 3 beds |
show details | |

|
#14
Concord Rd
Billerica, MA 01821
|
3,243 sq. feet
|
2 baths 2 beds |
show details | |

|
#15
Topliff St
Billerica, MA 01821
|
1,596 sq. feet
|
1 baths 3 beds |
show details | |

|
#16
Maverick Cir
Billerica, MA 01821
|
1,485 sq. feet
|
1 baths 3 beds |
show details | |

|
#17
Beaver Pl
Billerica, MA 01821
|
1,765 sq. feet
|
1 baths 3 beds |
show details | |

|
#18
Otter Cir
Billerica, MA 01821
|
3,638 sq. feet
|
2 baths 4 beds |
show details | |

|
#19
Porter St
Billerica, MA 01821
|
1,756 sq. feet
|
1 baths 3 beds |
show details | |

|
#20
Columbia Rd
Billerica, MA 01821
|
2,011 sq. feet
|
2 baths 3 beds |
show details |
| Photo | Address | Area | Beds / Baths | Price | Details |
|---|---|---|---|---|---|

|
#21
Nashua Road
Billerica, MA 01821
|
- sq. feet
|
- baths - beds |
show details | |

|
#22
Boston Rd
Billerica, MA 01821
|
- sq. feet
|
- baths - beds |
show details | |

|
#23
Friendship St
Billerica, MA 01821
|
- sq. feet
|
- baths - beds |
show details | |

|
#24
Salem Rd
Billerica, MA 01821
|
- sq. feet
|
- baths - beds |
show details | |

|
#25
Kenmar Dr Unit 24
Billerica, MA 01821
|
- sq. feet
|
- baths - beds |
show details | |

|
#26
Rocky Ledge Ln
Billerica, MA 01821
|
- sq. feet
|
- baths - beds |
show details | |

|
#27
Maple St
Tewksbury, MA 01876
|
1,748 sq. feet
|
1 baths 4 beds |
$379,900
|
show details |

|
#28
Commonwealth Ave Apt B
Boston, MA 02116
|
- sq. feet
|
1 baths 2 beds |
$684,900
|
show details |

|
#29
Schaefer Cir
Hudson, NH 03051
|
4,358 sq. feet
|
3 baths 5 beds |
show details | |

|
#30
Emily Rd
Tewksbury, MA 01876
|
1,600 sq. feet
|
1 baths 3 beds |
show details |
| Photo | Address | Area | Beds / Baths | Price | Details |
|---|---|---|---|---|---|

|
#31
Lyons St
Lowell, MA 01852
|
1,314 sq. feet
|
1 baths 2 beds |
show details | |

|
#32
Forest Park Rd
Woburn, MA 01801
|
1,132 sq. feet
|
1 baths 3 beds |
show details | |

|
#33
Aiken Ave Apt 15
Lowell, MA 01850
|
1,100 sq. feet
|
1 baths 2 beds |
show details | |

|
#34
3rd Ave
North Chelmsford, MA 01863
|
- sq. feet
|
1 baths 2 beds |
show details | |

|
#35
College Farm Rd
Waltham, MA 02451
|
879 sq. feet
|
1 baths 2 beds |
show details | |

|
#36
S Broadway
Lawrence, MA 01843
|
5,706 sq. feet
|
2 baths 6 beds |
show details | |

|
#37
Salem St
North Andover, MA 01845
|
1,572 sq. feet
|
1 baths 2 beds |
show details | |

|
#38
River Rd
Tyngsboro, MA 01879
|
1,863 sq. feet
|
2 baths 2 beds |
show details | |

|
#39
Marks Way
Maynard, MA 01754
|
2,596 sq. feet
|
2 baths 4 beds |
show details | |

|
#40
Thornton St
Lawrence, MA 01841
|
912 sq. feet
|
1 baths 2 beds |
show details |
| Photo | Address | Area | Beds / Baths | Price | Details |
|---|---|---|---|---|---|

|
#41
Lincoln Ave
Saugus, MA 01906
|
1,080 sq. feet
|
1 baths 3 beds |
show details | |

|
#42
Gordon St
Allston, MA 02134
|
3,246 sq. feet
|
2 baths 5 beds |
show details | |

|
#43
Great Rd
Stow, MA 01775
|
2,026 sq. feet
|
2 baths 3 beds |
show details | |

|
#44
Margin Street
Lynn, MA 01905
|
1,240 sq. feet
|
2 baths 2 beds |
show details | |

|
#45
Pine Ridge Rd
Windham, NH 03087
|
1,746 sq. feet
|
2 baths 4 beds |
show details | |

|
#46
Grace Dr
Nashua, NH 03062
|
1,484 sq. feet
|
1 baths 3 beds |
show details | |

|
#47
Cheney Dr
Hudson, NH 03051
|
1,685 sq. feet
|
2 baths 3 beds |
show details | |

|
#48
Boston Rd
Chelmsford, MA 01824
|
1,392 sq. feet
|
1 baths 3 beds |
show details | |

|
#49
Carlisle St
Lowell, MA 01852
|
1,913 sq. feet
|
1 baths 5 beds |
show details | |

|
Check over 1 million property listings on Foreclosure.com!
|
browse all offers | |||
Latest news about housing in Billerica, MA collected exclusively by city-data.com from local newspapers, TV, and radio stations

 | Billerica Houses (47 replies) |
| How Much Massachusetts Households Make Per Year: Census Data (37 replies) |
| 2023 Real Estate Observations (5278 replies) |
| 2022 Real Estate Observations (1122 replies) |
| Michelle Wu Rent Control Proposal (leaked) via Boston Globe (119 replies) |
| Under $250k any Massachusetts single family house with yard (117 replies) |

Household type by relationship:
Households: 1,447,673- In family households: 1,161,600 (250,263 male householders, 116,393 female householders)
287,332 spouses, 410,462 children (392,286 natural, 9,871 adopted, 8,305 stepchildren), 16,644 grandchildren, 14,569 brothers or sisters, 15,064 parents, foster children, 15,023 other relatives, 25,838 non-relatives
- In nonfamily households: 286,073 (95,244 male householders (67,197 living alone)), 118,788 female householders (94,319 living alone)), 72,041 nonrelatives
- In group quarters: 55,412 (13,773 institutionalized population)
252,928 married couples with children.
55,356 single-parent households (9,721 men, 45,635 women).
90.4% of residents of Billerica speak English at home.
2.2% of residents speak Spanish at home (67% speak English very well, 21% speak English well, 9% speak English not well, 2% don't speak English at all).
5.2% of residents speak other Indo-European language at home (73% speak English very well, 21% speak English well, 6% speak English not well).
1.7% of residents speak Asian or Pacific Island language at home (57% speak English very well, 35% speak English well, 5% speak English not well, 3% don't speak English at all).
0.5% of residents speak other language at home (90% speak English very well, 7% speak English well, 2% speak English not well).
Foreign born population: 4,053 (9.4%)
(69.0% of them are naturalized citizens)
| Here: | 6.9 |
| State: | 6.5 |
| Here: | 4.0 |
| State: | 4.0 |
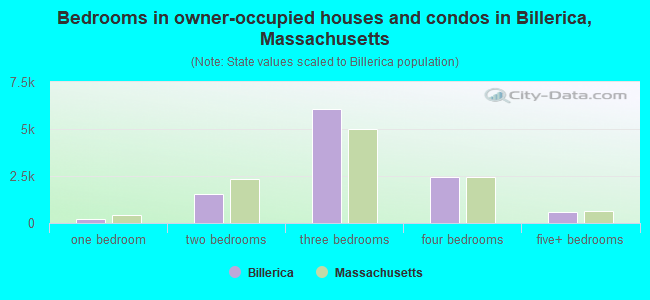
- Bedrooms in owner-occupied houses and condos in Billerica, Massachusetts
- 0no bedroom
- 2201 bedroom
- 1,5542 bedrooms
- 6,0633 bedrooms
- 2,4464 bedrooms
- 5735+ bedrooms
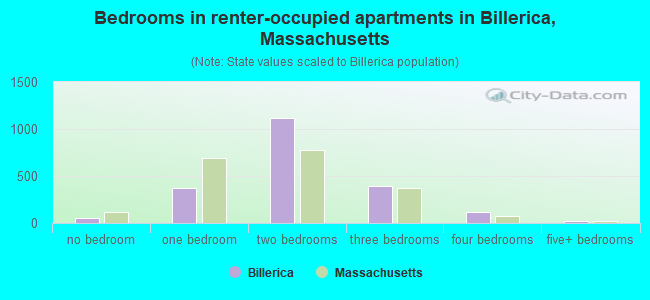
- Bedrooms in renter-occupied apartments in Billerica, Massachusetts
- 49no bedroom
- 3721 bedroom
- 1,1152 bedrooms
- 3893 bedrooms
- 1144 bedrooms
- 175+ bedrooms
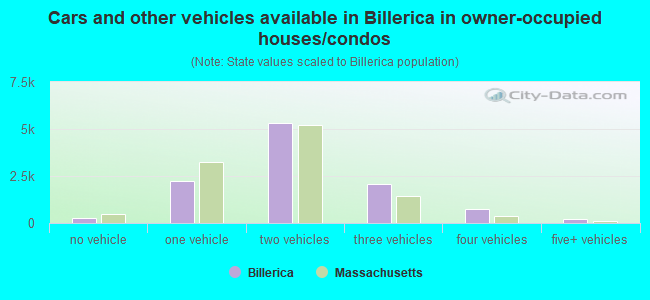
- Cars and other vehicles available in Billerica in owner-occupied houses/condos
- 261no vehicle
- 2,2521 vehicle
- 5,3262 vehicles
- 2,0863 vehicles
- 7194 vehicles
- 2125+ vehicles
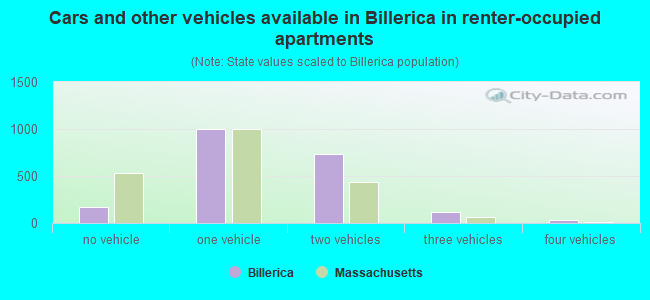
- Cars and other vehicles available in Billerica in renter-occupied apartments
- 172no vehicle
- 9961 vehicle
- 7362 vehicles
- 1193 vehicles
- 334 vehicles
- 05+ vehicles
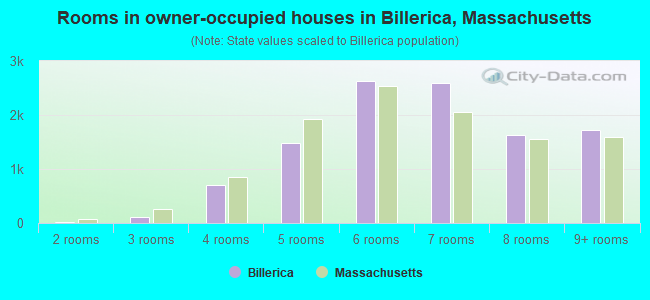
- Rooms in owner-occupied houses in Billerica, Massachusetts
- 01 room
- 272 rooms
- 1043 rooms
- 6964 rooms
- 1,4825 rooms
- 2,6216 rooms
- 2,5887 rooms
- 1,6238 rooms
- 1,7159+ rooms
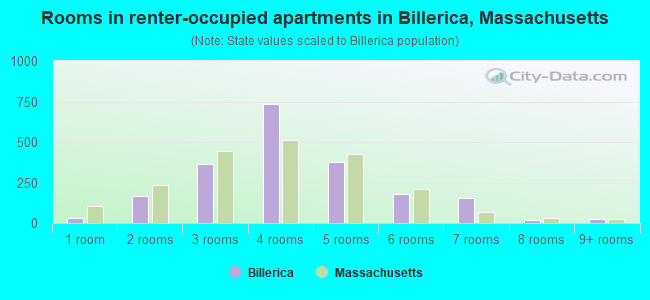
- Rooms in renter-occupied apartments in Billerica, Massachusetts
- 331 room
- 1692 rooms
- 3643 rooms
- 7374 rooms
- 3745 rooms
- 1816 rooms
- 1577 rooms
- 168 rooms
- 259+ rooms
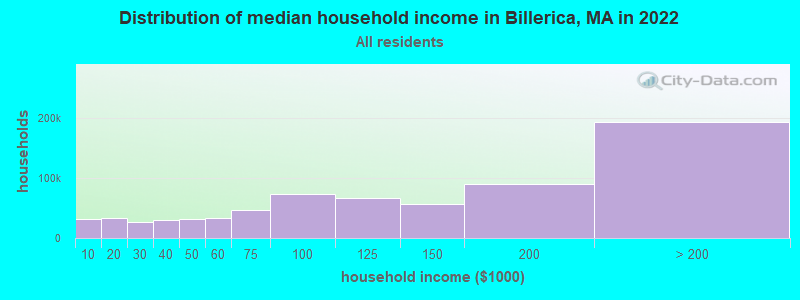
Billerica, MA household income distribution

- 31,827Less than $10,000
- 33,666$10,000 to $19,999
- 26,951$20,000 to $29,999
- 29,876$30,000 to $39,999
- 31,829$40,000 to $49,999
- 33,061$50,000 to $59,999
- 46,259$60,000 to $74,999
- 72,412$75,000 to $99,999
- 67,170$100,000 to $124,999
- 55,949$125,000 to $149,999
- 89,875$150,000 to $199,999
- 192,565$200,000 or more
Percentage of workers working in this county: 87.8%
Number of people working at home: 5,837 (24.7% of all workers)
Travel time to work (commute)
- Less than 5 minutes: 268
- 5 to 9 minutes: 1,431
- 10 to 14 minutes: 2,458
- 15 to 19 minutes: 3,169
- 20 to 24 minutes: 3,089
- 25 to 29 minutes: 1,368
- 30 to 34 minutes: 3,354
- 35 to 39 minutes: 647
- 40 to 44 minutes: 874
- 45 to 59 minutes: 1,989
- 60 to 89 minutes: 1,231
- 90 or more minutes: 189
Means of transportation to work:
- Drove a car alone: 17,866 (87.5%)
- Carpooled: 1,503 (7.4%)
- Bus or trolley bus: 168 (0.8%)
- Subway or elevated: 33 (0.2%)
- Railroad: 250 (1.2%)
- Taxi: 10 (0.0%)
- Motorcycle: 16 (0.1%)
- Walked: 137 (0.7%)
- Other means: 84 (0.4%)
- Worked at home: 359 (1.8%)
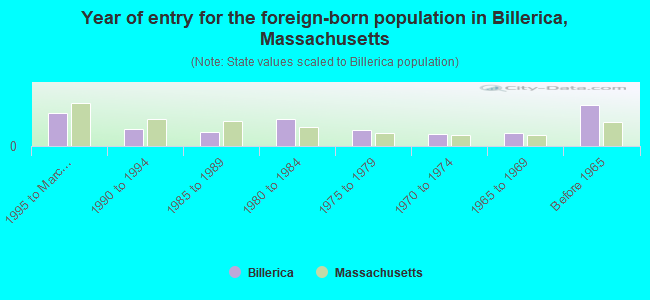
- Year of entry for the foreign-born population in Billerica, Massachusetts
- 4581995 to March 2000
- 2431990 to 1994
- 1991985 to 1989
- 3731980 to 1984
- 2311975 to 1979
- 1661970 to 1974
- 1761965 to 1969
- 580Before 1965
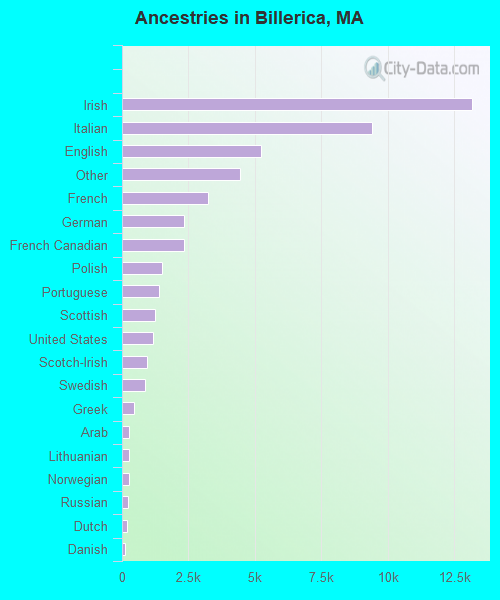
First ancestries reported:
- Irish: 13,157 (26.6%)
- Italian: 9,403 (19.0%)
- English: 5,238 (10.6%)
- Other: 4,430 (9.0%)
- French: 3,256 (6.6%)
- German: 2,342 (4.7%)
- French Canadian: 2,323 (4.7%)
- Polish: 1,506 (3.0%)
- Portuguese: 1,383 (2.8%)
- Scottish: 1,235 (2.5%)
- United States: 1,165 (2.4%)
- Scotch-Irish: 924 (1.9%)
- Swedish: 868 (1.8%)
- Greek: 448 (0.9%)
- Arab: 282 (0.6%)
- Lithuanian: 261 (0.5%)
- Norwegian: 257 (0.5%)
- Russian: 229 (0.5%)
- Dutch: 188 (0.4%)
- Danish: 120 (0.2%)
- Welsh: 97 (0.2%)
- Hungarian: 68 (0.1%)
- Subsaharan African: 68 (0.1%)
- Czech: 53 (0.1%)
- Slovak: 51 (0.1%)
- Ukrainian: 34 (0.07%)
- Swiss: 24 (0.05%)
- West Indian: 20 (0.04%)
Most common places of birth for foreign-born residents (%):
| Billerica: | 12.7% (309) |
| Massachusetts: | 5.2% (40,247) |
| Billerica: | 10.4% (252) |
| Massachusetts: | 3.6% (28,086) |
| Billerica: | 9.0% (218) |
| Massachusetts: | 8.6% (66,627) |
| Billerica: | 6.9% (168) |
| Massachusetts: | 5.1% (39,255) |
| Billerica: | 5.7% (139) |
| Massachusetts: | 3.7% (28,319) |
| Billerica: | 5.7% (139) |
| Massachusetts: | 1.8% (13,801) |
| Billerica: | 3.7% (89) |
| Massachusetts: | 0.5% (3,660) |
| Billerica: | 3.6% (88) |
| Massachusetts: | 3.3% (25,403) |
| Billerica: | 2.7% (65) |
| Massachusetts: | 1.9% (14,883) |
| Billerica: | 2.7% (65) |
| Massachusetts: | 1.0% (7,414) |
| Billerica: | 2.3% (56) |
| Massachusetts: | 2.3% (17,987) |
| Billerica: | 2.3% (56) |
| Massachusetts: | 1.8% (13,543) |
| Billerica: | 2.3% (55) |
| Massachusetts: | 3.9% (30,457) |
| Billerica: | 2.1% (52) |
| Massachusetts: | 0.9% (6,691) |
| Billerica: | 1.7% (42) |
| Massachusetts: | 0.5% (3,868) |
| Billerica: | 1.7% (42) |
| Massachusetts: | 0.4% (2,765) |
| Billerica: | 1.6% (39) |
| Massachusetts: | 2.0% (15,286) |
| Billerica: | 1.6% (38) |
| Massachusetts: | 1.0% (7,937) |
| Billerica: | 1.5% (37) |
| Massachusetts: | 1.7% (12,975) |
Place of birth for U.S.-born residents:
- This state: 31,861
- Other state: 4,358
- Northeast: 2,416
- Midwest: 513
- South: 874
- West: 555
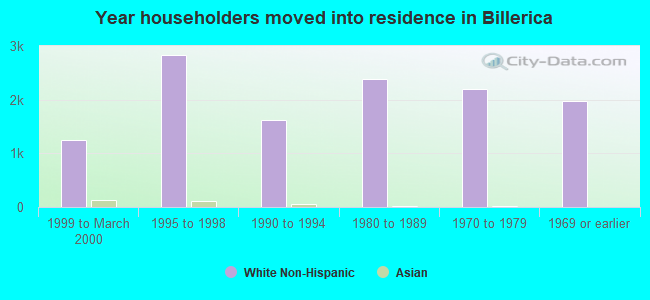
68% of Billerica residents lived in the same house 5 years ago.
Out of people who lived in different houses, 75% lived in this county.
Out of people who lived in different counties, 52% lived in Massachusetts.
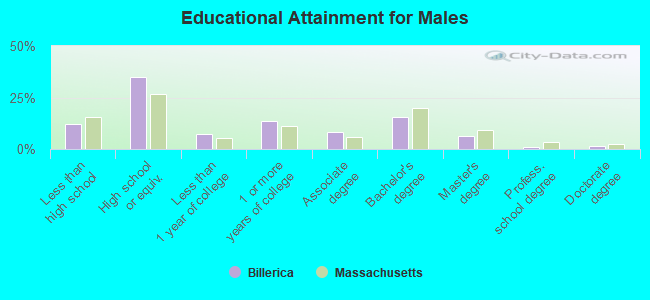
Education attainment for males 25 years and older:
- No schooling: 19
- Nursery to 4th grade: 23
- 5th and 6th grade: 63
- 7th and 8th grade: 154
- 9th grade: 251
- 10th grade: 273
- 11th grade: 303
- 12th grade, no diploma: 471
- High school graduate (or equivalency): 4,522
- Less than 1 year of college: 929
- Some college more than 1 year, no degree: 1,764
- Associate degree: 1,046
- Bachelor's degree: 1,993
- Master's degree: 814
- Professional school degree: 138
- Doctorate degree: 196
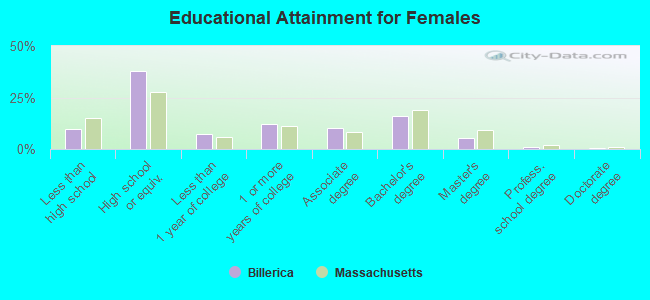
Education attainment for females 25 years and older:
- No schooling: 50
- Nursery to 4th grade: 7
- 5th and 6th grade: 15
- 7th and 8th grade: 184
- 9th grade: 92
- 10th grade: 252
- 11th grade: 309
- 12th grade, no diploma: 374
- High school graduate (or equivalency): 4,979
- Less than 1 year of college: 953
- Some college more than 1 year, no degree: 1,564
- Associate degree: 1,340
- Bachelor's degree: 2,092
- Master's degree: 678
- Professional school degree: 101
- Doctorate degree: 92
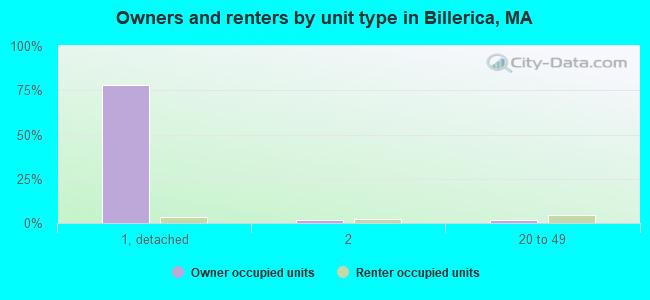
Housing units in structures:
- One, detached: 10,520
- One, attached: 244
- Two: 548
- 3 or 4: 232
- 5 to 9: 107
- 10 to 19: 330
- 20 to 49: 830
- 50 or more: 150
- Mobile homes: 97
Median worth of mobile homes: $79,512
Housing units lacking complete kitchen facilities: 0.5%
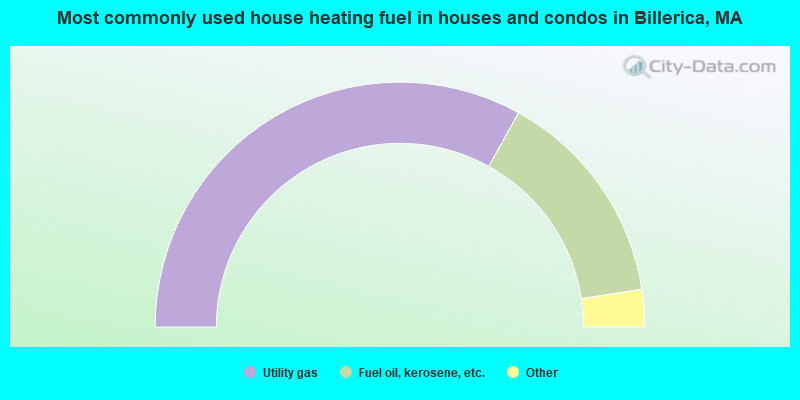
- 66.1%Utility gas
- 29.0%Fuel oil, kerosene, etc.
- 3.4%Electricity
- 0.7%Bottled, tank, or LP gas
- 0.5%Wood
- 0.2%Other fuel
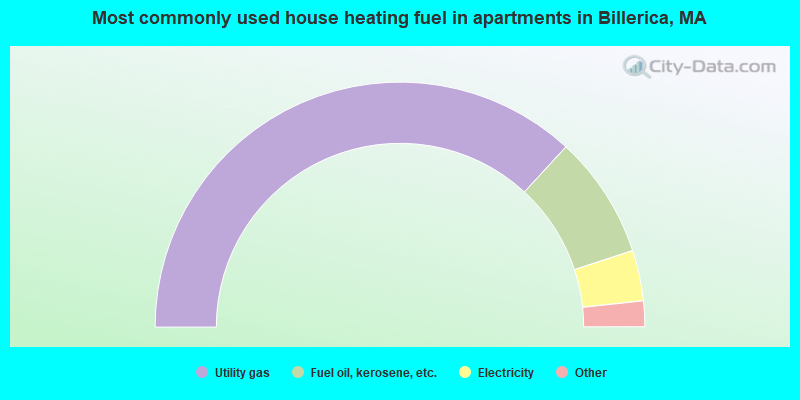
- 73.7%Utility gas
- 16.2%Fuel oil, kerosene, etc.
- 6.7%Electricity
- 3.0%Bottled, tank, or LP gas
- 0.4%Other fuel
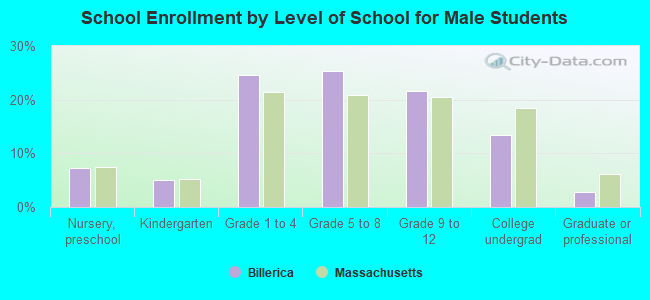
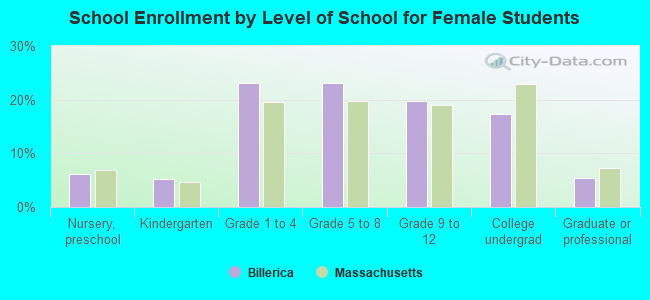
Private vs. public school enrollment:
| Here: | 3.9% |
| Massachusetts: | 10.8% |
| Here: | 5.4% |
| Massachusetts: | 12.2% |
| Here: | 33.7% |
| Massachusetts: | 48.2% |