Canton, OH (Ohio) Houses and Residents
Estimated median house or condo value in 2022: $89,500 (it was $66,400 in 2000 )
Canton:
$89,500Ohio:
$204,100
Lower value quartile - upper value quartile: $53,900 - $137,200Mean price in 2022: Detached houses: $121,493 Here:
$121,493State:
$254,366
Townhouses or other attached units: $210,882 Here:
$210,882State:
$225,733
In 2-unit structures: $711,130 Here:
$711,130State:
$144,384
In 3-to-4-unit structures: $132,282 Here:
$132,282State:
$203,002
In 5-or-more-unit structures: $85,860 Here:
$85,860State:
$211,593
Mobile homes: $86,320 Here:
$86,320State:
$62,719
Total population: 72,297 (All urban)
Houses: 34,305 (29,693 occupied: 15,025 owner occupied, 14,668 renter occupied )
% of renters here:
49%State:
33%
Housing density: 1,670 houses/condos per square mile
Median price asked for vacant for-sale houses and condos in 2022: $25,790.
Median contract rent in 2022: $613 (lower quartile is $478, upper quartile is $754)
Median rent asked for vacant for-rent units in 2022: $1,365
Median gross rent in Canton, OH in 2022: $820
Housing units in Canton with a mortgage: 8,096 (1,017 second mortgage, 0 home equity loan, 919 both second mortgage and home equity loan )Houses without a mortgage: 150
Median household income for houses/condos with a mortgage: $57,500
Median household income for apartments without a mortgage: $42,075
Median monthly housing costs: $722
Data:
Median house or condo value ($)
Median house or condo value ($ change since 2000)
Median house or condo value ($) - White
Median house or condo value ($) - Black or African American
Median house or condo value ($) - Asian
Median house or condo value ($) - Hispanic or Latino
Median house or condo value ($) - American Indian and Alaska Native
Median house or condo value ($) - Multirace
Median house or condo value ($) - Other Race
Median price asked for mobile homes ($)
Household density (households per square mile)
Mean house or condo value by units in structure - 1, detached ($)
Mean house or condo value by units in structure - 1, attached ($)
Mean house or condo value by units in structure - 2 ($)
Mean house or condo value by units in structure by units in structure - 3 or 4 ($)
Mean house or condo value by units in structure - 5 or more ($)
Mean house or condo value by units in structure - Boat, RV, van, etc. ($)
Mean house or condo value by units in structure - Mobile home ($)
Median contract rent ($)
Median contract rent - Lower quartile ($)
Median contract rent - Upper quartile ($)
Median gross rent ($)
Urban houses (%)
Rural houses (%)
Houses occupied (%)
Houses occupied (% change since 2000)
Houses owner occupied (%)
Houses owner occupied (% change since 2000)
Houses renter occupied (%)
Houses renter occupied (% change since 2000)
Vacant housing units - For rent (%)
Vacant housing units - For rent (% change since 2000)
Vacant housing units - For sale only (%)
Vacant housing units - For sale only (% change since 2000)
Vacant housing units - Rented or sold, not occupied (%)
Vacant housing units - Rented or sold, not occupied (% change since 2000)
Vacant housing units - For seasonal, recreational, or occasional use (%)
Vacant housing units - For seasonal, recreational, or occasional use (% change since 2000)
Vacant housing units - For migrant workers (%)
Vacant housing units - For migrant workers (% change since 2000)
Vacant housing units - Other vacant (%)
Vacant housing units - Other vacant (% change since 2000)
Median monthly housing costs ($)
Median household income for houses/condos with a mortgage ($)
Median household income for houses/condos without a mortgage ($)
Median household income ($)
Median household income ($) - White
Median household income ($) - Black or African American
Median household income ($) - Asian
Median household income ($) - Hispanic or Latino
Median household income ($) - American Indian and Alaska Native
Median household income ($) - Multirace
Median household income ($) - Other Race
Mortgage status - with mortgage (%)
Mortgage status - with second mortgage (%)
Mortgage status - with home equity loan (%)
Mortgage status - with both second mortgage and home equity loan (%)
Mortgage status - without a mortgage (%)
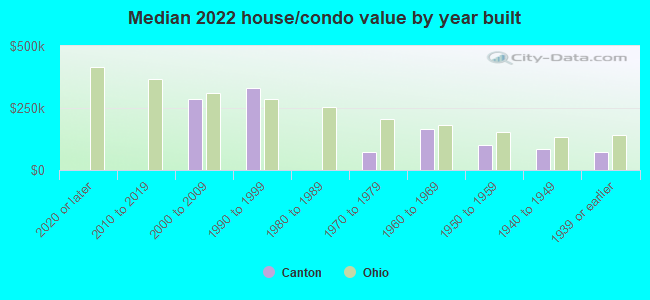
Median year house/condo built
Median year apartment built
Household type by relationship - Male householder living alone (%)
Household type by relationship - Male householder not living alone (%)
Household type by relationship - Female householder living alone (%)
Household type by relationship - Female householder not living alone (%)
Household type by relationship - Opposite-Sex spouse (%)
Household type by relationship - Same-Sex spouse (%)
Household type by relationship - Opposite-Sex unmarried partner (%)
Household type by relationship - Same-Sex unmarried partner (%)
Household type by relationship - In group quarters (%)
Size of family households - 2-person household (%)
Size of family households - 3-person household (%)
Size of family households - 4-person household (%)
Size of family households - 5-person household (%)
Size of family households - 6-person household (%)
Size of family households - 7-or-more-person household (%)
Size of nonfamily households - 1-person household (%)
Size of nonfamily households - 2-person household (%)
Size of nonfamily households - 3-person household (%)
Size of nonfamily households - 4-person household (%)
Size of nonfamily households - 5-person household (%)
Size of nonfamily households - 6-person household (%)
Size of nonfamily households - 7-or-moreperson household (%)
Year house built - Built 2010 or later (%)
Year house built - Built 2000 to 2009 (%)
Year house built - Built 1990 to 1999 (%)
Year house built - Built 1980 to 1989 (%)
Year house built - Built 1970 to 1979 (%)
Year house built - Built 1960 to 1969 (%)
Year house built - Built 1950 to 1959 (%)
Year house built - Built 1940 to 1949 (%)
Year house built - Built 1939 or earlier (%)
Median number of rooms in houses and condos
Median number of rooms in apartments
Median number of bedrooms in owner occupied houses
Mean number of bedrooms in owner occupied houses
Median number of bedrooms in renter occupied houses
Mean number of bedrooms in renter occupied houses
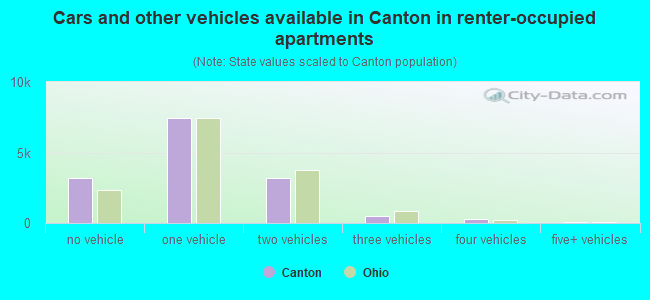
Median number of vehichles in owner occupied houses
Mean number of vehichles in owner occupied houses
Median number of vehichles in renter occupied houses
Mean number of vehichles in renter occupied houses
Rooms in owner-occupied houses - 1 room (%)
Rooms in owner-occupied houses - 2 rooms (%)
Rooms in owner-occupied houses - 3 rooms (%)
Rooms in owner-occupied houses - 4 rooms (%)
Rooms in owner-occupied houses - 5 rooms (%)
Rooms in owner-occupied houses - 6 rooms (%)
Rooms in owner-occupied houses - 7 rooms (%)
Rooms in owner-occupied houses - 8 rooms (%)
Rooms in owner-occupied houses - 9+ rooms (%)
Rooms in renter-occupied houses - 1 room (%)
Rooms in renter-occupied houses - 2 rooms (%)
Rooms in renter-occupied houses - 3 rooms (%)
Rooms in renter-occupied houses - 4 rooms (%)
Rooms in renter-occupied houses - 5 rooms (%)
Rooms in renter-occupied houses - 6 rooms (%)
Rooms in renter-occupied houses - 7 rooms (%)
Rooms in renter-occupied houses - 8 rooms (%)
Rooms in renter-occupied houses - 9+ rooms (%)
Bedrooms in owner-occupied houses - no bedrooms (%)
Bedrooms in owner-occupied houses - 1 bedroom (%)
Bedrooms in owner-occupied houses - 2 bedrooms (%)
Bedrooms in owner-occupied houses - 3 bedrooms (%)
Bedrooms in owner-occupied houses - 4 bedrooms (%)
Bedrooms in owner-occupied houses - 5+ bedrooms (%)
Bedrooms in renter-occupied houses - no bedrooms (%)
Bedrooms in renter-occupied houses - 1 bedroom (%)
Bedrooms in renter-occupied houses - 2 bedrooms (%)
Bedrooms in renter-occupied houses - 3 bedrooms (%)
Bedrooms in renter-occupied houses - 4 bedrooms (%)
Bedrooms in renter-occupied houses - 5+ bedrooms (%)
Vehicles available in owner-occupied houses - no vehicle available (%)
Vehicles available in owner-occupied houses - 1 vehicle available(%)
Vehicles available in owner-occupied houses - 2 Vehicles available (%)
Vehicles available in owner-occupied houses - 3 Vehicles available (%)
Vehicles available in owner-occupied houses - 4 Vehicles available (%)
Vehicles available in owner-occupied houses - 5+ Vehicles available (%)
Vehicles available in renter-occupied houses - no vehicle available (%)
Vehicles available in renter-occupied houses - 1 vehicle available (%)
Vehicles available in renter-occupied houses - 2 Vehicles available (%)
Vehicles available in renter-occupied houses - 3 Vehicles available (%)
Vehicles available in renter-occupied houses - 4 Vehicles available (%)
Vehicles available in renter-occupied houses - 5+ Vehicles available (%)
Housing units in structures - 1, detached (%)
Housing units in structures - 1, attached (%)
Housing units in structures - 2 (%)
Housing units in structures - 3 or 4 (%)
Housing units in structures - 5 to 9 (%)
Housing units in structures - 10 to 19 (%)
Housing units in structures - 20 to 49 (%)
Housing units in structures - 50 or more (%)
Housing units in structures - Mobile home (%)
Housing units in structures - Boat, RV, van, etc. (%)
Housing units in structures - Owners - 1, detached (%)
Housing units in structures - Owners - 1, attached (%)
Housing units in structures - Owners - 2 (%)
Housing units in structures - Owners - 3 or 4 (%)
Housing units in structures - Owners - 5 to 9 (%)
Housing units in structures - Owners - 10 to 19 (%)
Housing units in structures - Owners - 20 to 49 (%)
Housing units in structures - Owners - 50 or more (%)
Housing units in structures - Owners - Mobile home (%)
Housing units in structures - Owners - Boat, RV, van, etc. (%)
Housing units in structures - Renters - 1, detached (%)
Housing units in structures - Renters - 1, attached (%)
Housing units in structures - Renters - 2 (%)
Housing units in structures - Renters - 3 or 4 (%)
Housing units in structures - Renters - 5 to 9 (%)
Housing units in structures - Renters - 10 to 19 (%)
Housing units in structures - Renters - 20 to 49 (%)
Housing units in structures - Renters - 50 or more (%)
Housing units in structures - Renters - Mobile home (%)
Housing units in structures - Renters - Boat, RV, van, etc. (%)
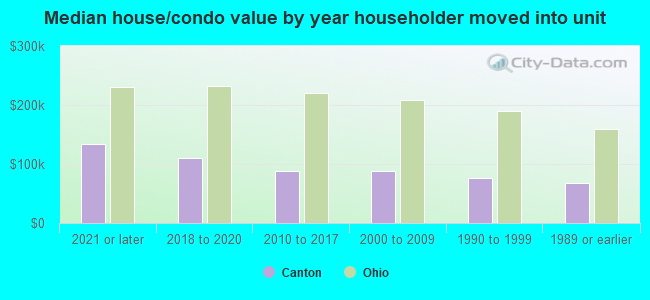
House/condo owner moved in on average (years ago)
Renter moved in on average (years ago)
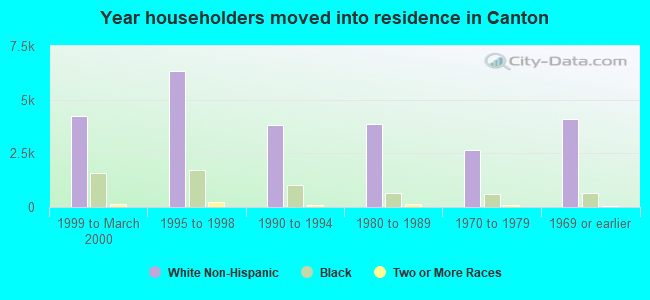
Year householder moved into unit - Moved in 1999 to March 2000 (%)
Year householder moved into unit - Moved in 1999 to March 2000 (%) - White
Year householder moved into unit - Moved in 1999 to March 2000 (%) - Black or African American
Year householder moved into unit - Moved in 1999 to March 2000 (%) - Asian
Year householder moved into unit - Moved in 1999 to March 2000 (%) - Hispanic or Latino
Year householder moved into unit - Moved in 1999 to March 2000 (%) - American Indian and Alaska Native
Year householder moved into unit - Moved in 1999 to March 2000 (%) - Multirace
Year householder moved into unit - Moved in 1999 to March 2000 (%) - Other Race
Year householder moved into unit - Moved in 1995 to 1998 (%)
Year householder moved into unit - Moved in 1995 to 1998 (%) - White
Year householder moved into unit - Moved in 1995 to 1998 (%) - Black or African American
Year householder moved into unit - Moved in 1995 to 1998 (%) - Asian
Year householder moved into unit - Moved in 1995 to 1998 (%) - Hispanic or Latino
Year householder moved into unit - Moved in 1995 to 1998 (%) - American Indian and Alaska Native
Year householder moved into unit - Moved in 1995 to 1998 (%) - Multirace
Year householder moved into unit - Moved in 1995 to 1998 (%) - Other Race
Year householder moved into unit - Moved in 1990 to 1994 (%)
Year householder moved into unit - Moved in 1990 to 1994 (%) - White
Year householder moved into unit - Moved in 1990 to 1994 (%) - Black or African American
Year householder moved into unit - Moved in 1990 to 1994 (%) - Asian
Year householder moved into unit - Moved in 1990 to 1994 (%) - Hispanic or Latino
Year householder moved into unit - Moved in 1990 to 1994 (%) - American Indian and Alaska Native
Year householder moved into unit - Moved in 1990 to 1994 (%) - Multirace
Year householder moved into unit - Moved in 1990 to 1994 (%) - Other Race
Year householder moved into unit - Moved in 1980 to 1989 (%)
Year householder moved into unit - Moved in 1980 to 1989 (%) - White
Year householder moved into unit - Moved in 1980 to 1989 (%) - Black or African American
Year householder moved into unit - Moved in 1980 to 1989 (%) - Asian
Year householder moved into unit - Moved in 1980 to 1989 (%) - Hispanic or Latino
Year householder moved into unit - Moved in 1980 to 1989 (%) - American Indian and Alaska Native
Year householder moved into unit - Moved in 1980 to 1989 (%) - Multirace
Year householder moved into unit - Moved in 1980 to 1989 (%) - Other Race
Year householder moved into unit - Moved in 1970 to 1979 (%)
Year householder moved into unit - Moved in 1970 to 1979 (%) - White
Year householder moved into unit - Moved in 1970 to 1979 (%) - Black or African American
Year householder moved into unit - Moved in 1970 to 1979 (%) - Asian
Year householder moved into unit - Moved in 1970 to 1979 (%) - Hispanic or Latino
Year householder moved into unit - Moved in 1970 to 1979 (%) - American Indian and Alaska Native
Year householder moved into unit - Moved in 1970 to 1979 (%) - Multirace
Year householder moved into unit - Moved in 1970 to 1979 (%) - Other Race
Year householder moved into unit - Moved in 1969 or earlier (%)
Year householder moved into unit - Moved in 1969 or earlier (%) - White
Year householder moved into unit - Moved in 1969 or earlier (%) - Black or African American
Year householder moved into unit - Moved in 1969 or earlier (%) - Asian
Year householder moved into unit - Moved in 1969 or earlier (%) - Hispanic or Latino
Year householder moved into unit - Moved in 1969 or earlier (%) - American Indian and Alaska Native
Year householder moved into unit - Moved in 1969 or earlier (%) - Multirace
Year householder moved into unit - Moved in 1969 or earlier (%) - Other Race
Housing units lacking complete plumbing facilities (%)
Housing units lacking complete kitchen facilities (%)
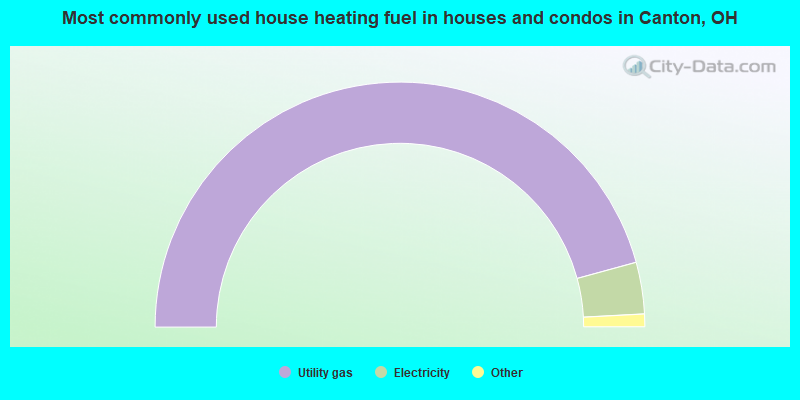
House heating fuel used in houses and condos - Utility gas (%)
House heating fuel used in houses and condos - Bottled, tank, or LP gas (%)
House heating fuel used in houses and condos - Electricity (%)
House heating fuel used in houses and condos - Fuel oil, kerosene, etc. (%)
House heating fuel used in houses and condos - Coal or coke (%)
House heating fuel used in houses and condos - Wood (%)
House heating fuel used in houses and condos - Solar energy (%)
House heating fuel used in houses and condos - Other fuel (%)
House heating fuel used in houses and condos - No fuel used (%)
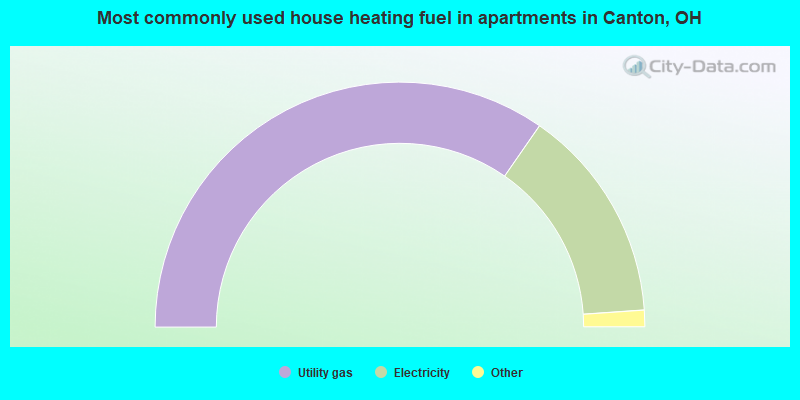
House heating fuel used in apartments - Utility gas (%)
House heating fuel used in apartments - Bottled, tank, or LP gas (%)
House heating fuel used in apartments - Electricity (%)
House heating fuel used in apartments - Fuel oil, kerosene, etc. (%)
House heating fuel used in apartments - Coal or coke (%)
House heating fuel used in apartments - Wood (%)
House heating fuel used in apartments - Solar energy (%)
House heating fuel used in apartments - Other fuel (%)
House heating fuel used in apartments - No fuel used (%)
Latest news about housing in Canton, OH collected exclusively by city-data.com from local newspapers, TV, and radio stations
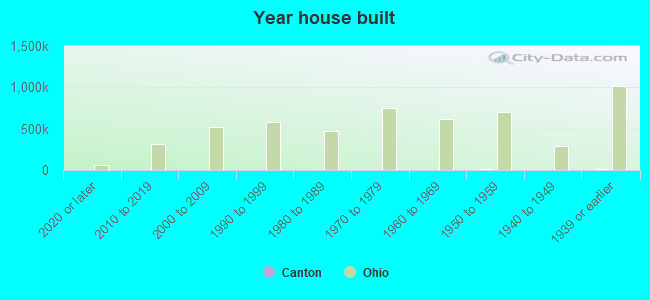
Median year house/condo built: 1948Median year apartment built: 1953Household type by relationship:
Households: 69,666
Male householders: 13,857 (5,621 living alone ), Female householders: 15,836 (5,842 living alone )7,910 spouses (7,910 opposite-sex spouses ), 3,423 unmarried partners , (3,291 opposite-sex unmarried partners ), 18,894 children (18,101 natural , 184 adopted , 609 stepchildren ), 1,683 grandchildren , 627 brothers or sisters , 483 parents , 0 foster children , 2,041 other relatives , 2,855 non-relatives In group quarters: 2,057
Size of family households: 6,451 2-persons , 3,908 3-persons , 2,737 4-persons , 1,500 5-persons , 605 6-persons , 557 7-or-more-persons .
Size of nonfamily households: 11,463 1-person , 2,042 2-persons , 430 3-persons .
6,267 married couples with children. single-parent households (2,800 men , 5,189 women ).
95.6% of residents of Canton speak English at home. of residents speak Spanish at home (52% speak English very well , 15% speak English well , 22% speak English not well , 12% don't speak English at all ).of residents speak other Indo-European language at home (62% speak English very well , 29% speak English well , 8% speak English not well , 1% don't speak English at all ).of residents speak Asian or Pacific Island language at home (58% speak English very well , 17% speak English well , 24% speak English not well , 1% don't speak English at all ).of residents speak other language at home (81% speak English very well , 19% speak English well ).
Foreign born population: 1,828 (2.6%)of them are naturalized citizens )
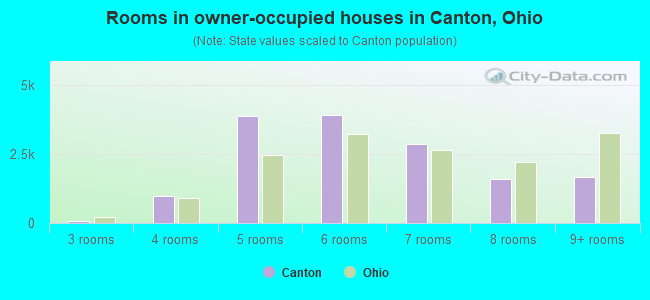
Median number of rooms in houses and condos:
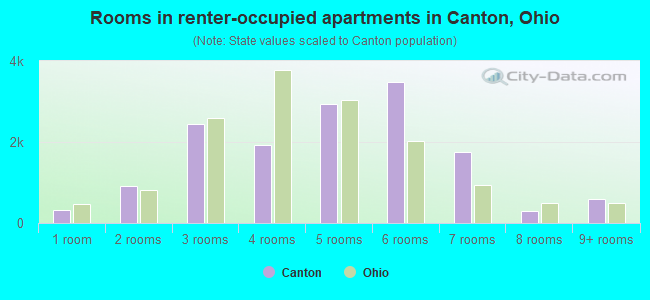
Median number of rooms in apartments
Owner-occupied Renter-occupied
Rooms in owner-occupied houses in Canton, Ohio
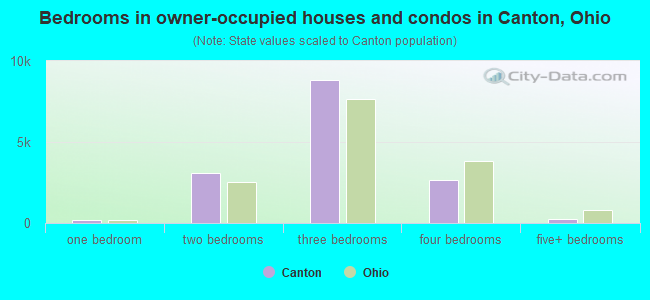
0 1 room 0 2 rooms 58 3 rooms 991 4 rooms 3,889 5 rooms 3,927 6 rooms 2,890 7 rooms 1,593 8 rooms 1,677 9+ rooms
Rooms in renter-occupied apartments in Canton, Ohio
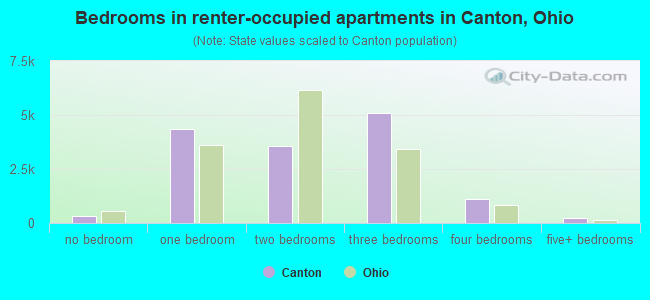
320 1 room 917 2 rooms 2,439 3 rooms 1,927 4 rooms 2,934 5 rooms 3,490 6 rooms 1,741 7 rooms 298 8 rooms 602 9+ rooms
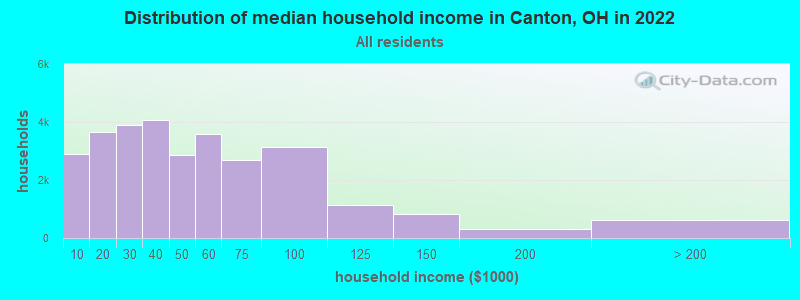
Canton, OH household income distribution 2,893 Less than $10,0003,651 $10,000 to $19,9993,884 $20,000 to $29,9994,067 $30,000 to $39,9992,860 $40,000 to $49,9993,601 $50,000 to $59,9992,697 $60,000 to $74,9993,129 $75,000 to $99,9991,124 $100,000 to $124,999837 $125,000 to $149,999313 $150,000 to $199,999637 $200,000 or more
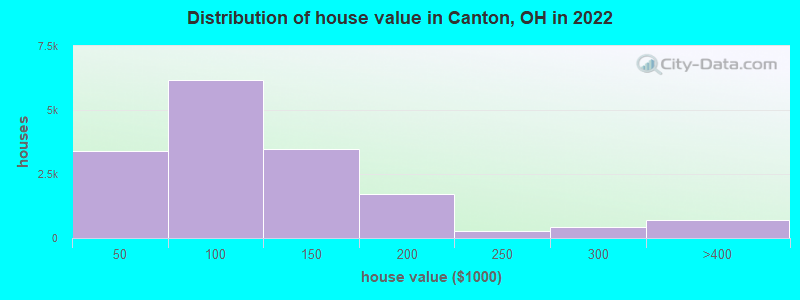
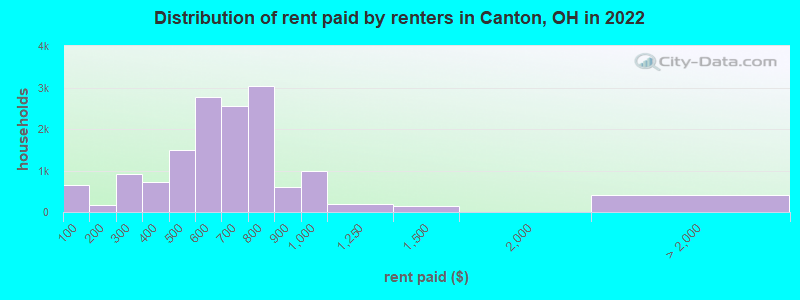
Home value of owner - occupied houses in 2022 in Canton, OH 50 Less than $10,000330 $10,000 to $14,999365 $15,000 to $19,999124 $20,000 to $24,999326 $25,000 to $29,999830 $30,000 to $34,999210 $35,000 to $39,9991,180 $40,000 to $49,999870 $50,000 to $59,9991,258 $60,000 to $69,999923 $70,000 to $79,9991,103 $80,000 to $89,999828 $90,000 to $99,9992,310 $100,000 to $124,9991,151 $125,000 to $149,9991,085 $150,000 to $174,999624 $175,000 to $199,999292 $200,000 to $249,999444 $250,000 to $299,999640 $300,000 to $399,99982 $2,000,000 or moreRent paid by renters in 2022 in Canton, OH 662 Less than $100177 $150 to $199527 $200 to $249393 $250 to $299511 $300 to $349203 $350 to $399597 $400 to $449905 $450 to $4991,615 $500 to $5491,156 $550 to $5991,561 $600 to $6491,005 $650 to $6991,284 $700 to $7491,758 $750 to $799600 $800 to $899980 $900 to $999184 $1,000 to $1,249146 $1,250 to $1,49947 $2,000 to $2,499357 No cash rent
Percentage of workers working in this county: 86.6%Number of people working at home: 2,047 (7.1% of all workers )
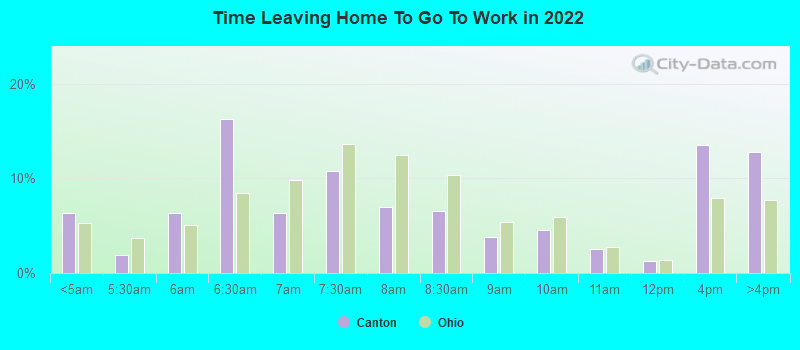
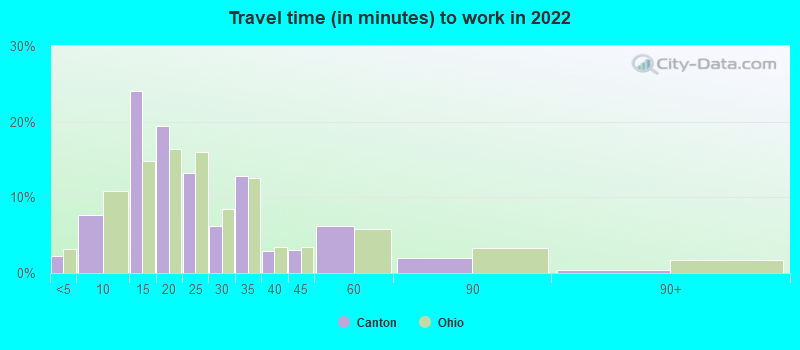
Travel time to work (commute)
Less than 5 minutes: 8045 to 9 minutes: 3,58910 to 14 minutes: 7,07315 to 19 minutes: 6,02520 to 24 minutes: 3,07325 to 29 minutes: 2,16930 to 34 minutes: 2,67535 to 39 minutes: 53440 to 44 minutes: 20445 to 59 minutes: 75060 to 89 minutes: 55890 or more minutes: 0
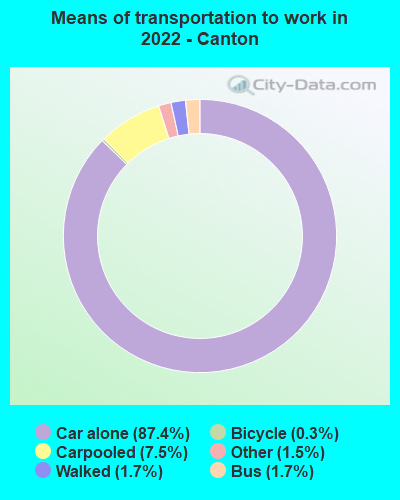
Means of transportation to work:
Drove a car alone: 32,394 (81.3%)Carpooled: 2,947 (7.4%)Bus : 379 (1.0%)Taxi: 920 (2.3%)Bicycle: 93 (0.2%)Walked: 506 (1.3%)Worked at home: 2,047 (5.1%)
Unemployment by race in 2022
Unemployment rate for White non-Hispanic residents 4.2% Males0.8% FemalesUnemployment rate for Black residents 14.9% Males16.4% FemalesUnemployment rate for Asian residents 21.2% Males5.9% FemalesUnemployment rate for other race residents 18.6% Males11.8% FemalesUnemployment rate for two or more race residents 10.2% Males7.0% FemalesUnemployment rate for Hispanic or Latino residents 9.1% Males4.9% Females
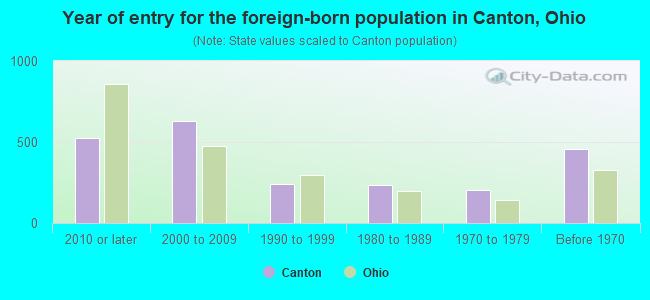
Year of entry for the foreign-born population in Canton, Ohio
523 2010 or later 629 2000 to 2009 239 1990 to 1999 237 1980 to 1989 205 1970 to 1979 454 Before 1970
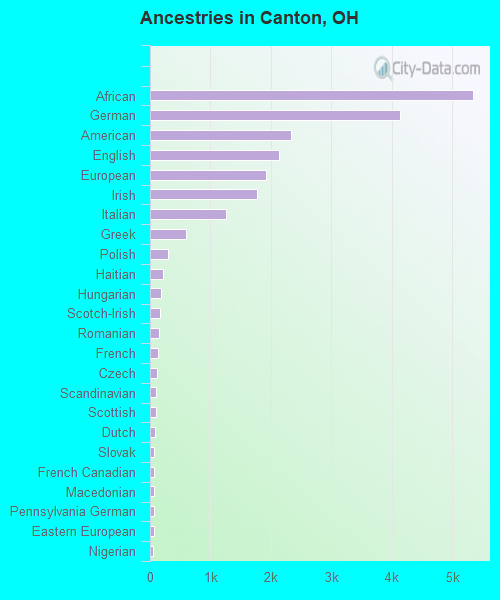
First ancestries reported:
African: 5,344 (15.2%)
German: 4,130 (11.8%)
American: 2,339 (6.7%)
English: 2,139 (6.1%)
European: 1,915 (5.4%)
Irish: 1,764 (5.0%)
Italian: 1,254 (3.6%)
Greek: 588 (1.7%)
Polish: 297 (0.8%)
Haitian: 210 (0.6%)
Hungarian: 180 (0.5%)
Scotch-Irish: 167 (0.5%)
Romanian: 155 (0.4%)
French: 137 (0.4%)
Czech: 122 (0.3%)
Scandinavian: 106 (0.3%)
Scottish: 93 (0.3%)
Dutch: 80 (0.2%)
Slovak: 74 (0.2%)
French Canadian: 73 (0.2%)
Macedonian: 65 (0.2%)
Pennsylvania German: 62 (0.2%)
Eastern European: 59 (0.2%)
Nigerian: 51 (0.1%)
Belgian: 48 (0.1%)
Swedish: 48 (0.1%)
Croatian: 47 (0.1%)
Norwegian: 37 (0.1%)
Portuguese: 36 (0.1%)
Austrian: 34 (0.10%)
Swiss: 33 (0.09%)
Welsh: 31 (0.09%)
Syrian: 30 (0.09%)
Canadian: 29 (0.08%)
Lithuanian: 26 (0.07%)
Cape Verdean: 25 (0.07%)
Serbian: 24 (0.07%)
Czechoslovakian: 20 (0.06%)
Celtic: 18 (0.05%)
Albanian: 17 (0.05%)
Israeli: 17 (0.05%)
British: 14 (0.04%)
Ukrainian: 14 (0.04%)
Lebanese: 12 (0.03%)
Australian: 10 (0.03%)
Egyptian: 10 (0.03%)
South African: 10 (0.03%)
Slovene: 8 (0.02%)
Russian: 4 (0.01%)
Northern European: 3 (0.01%)
Jamaican: 3 (0.01%)
Most common places of birth for foreign-born residents (%): Mexico Canton:
17.6% (324)Ohio:
7.8% (44,796)
Guatemala Canton:
14.9% (275)Ohio:
1.6% (9,312)
El Salvador Canton:
8.5% (157)Ohio:
1.4% (7,947)
Greece Canton:
8.3% (153)Ohio:
0.5% (2,690)
Honduras Canton:
7.0% (129)Ohio:
1.0% (5,553)
Philippines Canton:
5.5% (102)Ohio:
3.1% (17,818)
Cambodia Canton:
3.8% (70)Ohio:
0.5% (2,620)
Korea Canton:
2.5% (47)Ohio:
2.0% (11,398)
Jamaica Canton:
2.4% (44)Ohio:
0.7% (4,187)
Nigeria Canton:
2.3% (43)Ohio:
1.2% (7,029)
India Canton:
2.3% (43)Ohio:
11.6% (66,525)
Germany Canton:
2.2% (41)Ohio:
2.2% (12,846)
Sweden Canton:
1.7% (31)Ohio:
0.1% (499)
Belgium Canton:
1.6% (30)Ohio:
0.1% (700)
Italy Canton:
1.5% (28)Ohio:
1.2% (6,679)
Place of birth for U.S.-born residents:
This state: 57,604Other state: 9,667Northeast: 2,850Midwest: 1,500South: 3,589West: 1,728 85.2% of Canton residents lived in the same house 1 years ago.
Out of people who lived in different houses, 42.9% lived in this county.
Out of people who lived in different counties, 59.9% lived in Ohio.
Canton:
85.2%State average:
87.8%
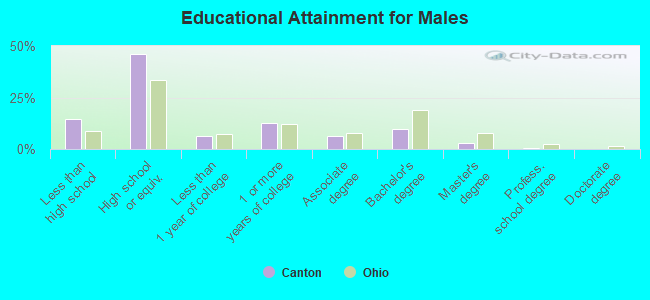
Education attainment for males 25 years and older:
No schooling: 638Nursery to 4th grade: 1115th and 6th grade: 07th and 8th grade: 2519th grade: 27510th grade: 11011th grade: 1,09312th grade, no diploma: 779High school graduate (or equivalency): 10,282Less than 1 year of college: 1,451Some college more than 1 year, no degree: 2,841Associate degree: 1,387Bachelor's degree: 2,197Master's degree: 679Professional school degree: 82Doctorate degree: 36
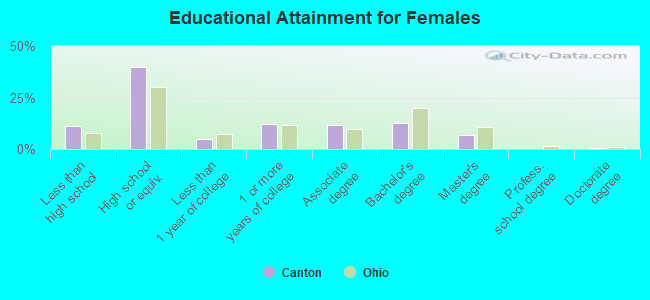
Education attainment for females 25 years and older:
No schooling: 59Nursery to 4th grade: 05th and 6th grade: 07th and 8th grade: 1279th grade: 26010th grade: 95311th grade: 1,02412th grade, no diploma: 233High school graduate (or equivalency): 9,249Less than 1 year of college: 1,142Some college more than 1 year, no degree: 2,878Associate degree: 2,750Bachelor's degree: 2,890Master's degree: 1,593Professional school degree: 0Doctorate degree: 158
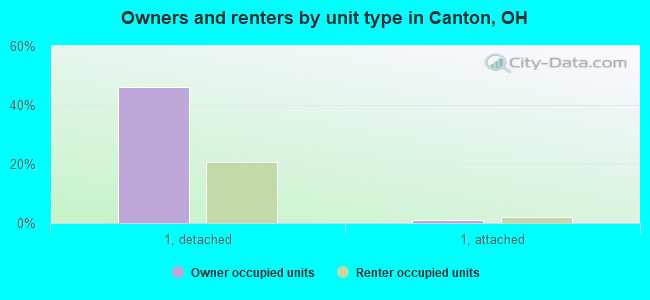
Housing units in structures:
One, detached: 22,501One, attached: 1,221Two: 3,2533 or 4: 9435 to 9: 1,85210 to 19: 1,64620 to 49: 1,26550 or more: 1,559Mobile homes: 65Housing units lacking complete plumbing facilities in 2022: 3.9%Housing units lacking complete kitchen facilities in 2022: 7.1%House/condo owner moved in on average 17 years ago
Renter moved in on average 3 years ago
Private vs. public school enrollment:
Students in private schools in grades 1 to 8 (elementary and middle school): 861 Students in private schools in grades 9 to 12 (high school): 364 Students in private undergraduate colleges: 993