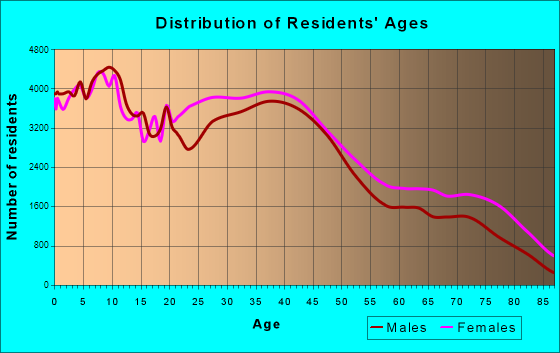
Cleveland, OH (Ohio) Houses and Residents
Estimated median house or condo value in 2022: $102,500 (it was $71,100 in 2000 )
Cleveland:
$102,500Ohio:
$204,100
Lower value quartile - upper value quartile: $62,600 - $159,600Mean price in 2022: Detached houses: $148,398 Here:
$148,398State:
$254,366
Townhouses or other attached units: $186,807 Here:
$186,807State:
$225,733
In 2-unit structures: $92,140 Here:
$92,140State:
$144,384
In 3-to-4-unit structures: $170,097 Here:
$170,097State:
$203,002
In 5-or-more-unit structures: $158,711 Here:
$158,711State:
$211,593
Mobile homes: $30,429 Here:
$30,429State:
$62,719
Total population: 389,521 (All urban)
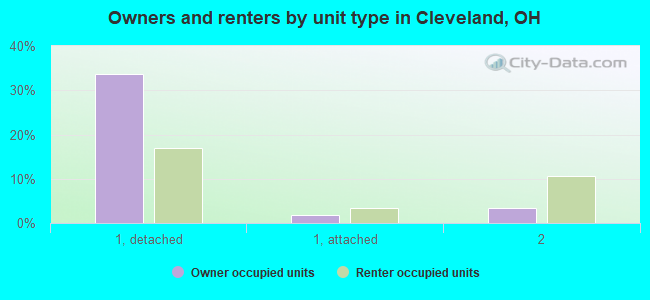
Houses: 200,223 (169,427 occupied: 68,158 owner occupied, 101,269 renter occupied )
% of renters here:
60%State:
33%
Housing density: 2,581 houses/condos per square mile
Median price asked for vacant for-sale houses and condos in 2022: $71,959.
Median contract rent in 2022: $705 (lower quartile is $520, upper quartile is $978)
Median rent asked for vacant for-rent units in 2022: $917
Median gross rent in Cleveland, OH in 2022: $909
Housing units in Cleveland with a mortgage: 34,546 (4,216 second mortgage, 102 home equity loan, 3,203 both second mortgage and home equity loan )Houses without a mortgage: 2,364
Median household income for houses/condos with a mortgage: $62,340
Median household income for apartments without a mortgage: $43,528
Median monthly housing costs: $850
Data:
Median house or condo value ($)
Median house or condo value ($ change since 2000)
Median house or condo value ($) - White
Median house or condo value ($) - Black or African American
Median house or condo value ($) - Asian
Median house or condo value ($) - Hispanic or Latino
Median house or condo value ($) - American Indian and Alaska Native
Median house or condo value ($) - Multirace
Median house or condo value ($) - Other Race
Median price asked for mobile homes ($)
Household density (households per square mile)
Mean house or condo value by units in structure - 1, detached ($)
Mean house or condo value by units in structure - 1, attached ($)
Mean house or condo value by units in structure - 2 ($)
Mean house or condo value by units in structure by units in structure - 3 or 4 ($)
Mean house or condo value by units in structure - 5 or more ($)
Mean house or condo value by units in structure - Boat, RV, van, etc. ($)
Mean house or condo value by units in structure - Mobile home ($)
Median contract rent ($)
Median contract rent - Lower quartile ($)
Median contract rent - Upper quartile ($)
Median gross rent ($)
Urban houses (%)
Rural houses (%)
Houses occupied (%)
Houses occupied (% change since 2000)
Houses owner occupied (%)
Houses owner occupied (% change since 2000)
Houses renter occupied (%)
Houses renter occupied (% change since 2000)
Vacant housing units - For rent (%)
Vacant housing units - For rent (% change since 2000)
Vacant housing units - For sale only (%)
Vacant housing units - For sale only (% change since 2000)
Vacant housing units - Rented or sold, not occupied (%)
Vacant housing units - Rented or sold, not occupied (% change since 2000)
Vacant housing units - For seasonal, recreational, or occasional use (%)
Vacant housing units - For seasonal, recreational, or occasional use (% change since 2000)
Vacant housing units - For migrant workers (%)
Vacant housing units - For migrant workers (% change since 2000)
Vacant housing units - Other vacant (%)
Vacant housing units - Other vacant (% change since 2000)
Median monthly housing costs ($)
Median household income for houses/condos with a mortgage ($)
Median household income for houses/condos without a mortgage ($)
Median household income ($)
Median household income ($) - White
Median household income ($) - Black or African American
Median household income ($) - Asian
Median household income ($) - Hispanic or Latino
Median household income ($) - American Indian and Alaska Native
Median household income ($) - Multirace
Median household income ($) - Other Race
Mortgage status - with mortgage (%)
Mortgage status - with second mortgage (%)
Mortgage status - with home equity loan (%)
Mortgage status - with both second mortgage and home equity loan (%)
Mortgage status - without a mortgage (%)
Median year house/condo built
Median year apartment built
Household type by relationship - Male householder living alone (%)
Household type by relationship - Male householder not living alone (%)
Household type by relationship - Female householder living alone (%)
Household type by relationship - Female householder not living alone (%)
Household type by relationship - Opposite-Sex spouse (%)
Household type by relationship - Same-Sex spouse (%)
Household type by relationship - Opposite-Sex unmarried partner (%)
Household type by relationship - Same-Sex unmarried partner (%)
Household type by relationship - In group quarters (%)
Size of family households - 2-person household (%)
Size of family households - 3-person household (%)
Size of family households - 4-person household (%)
Size of family households - 5-person household (%)
Size of family households - 6-person household (%)
Size of family households - 7-or-more-person household (%)
Size of nonfamily households - 1-person household (%)
Size of nonfamily households - 2-person household (%)
Size of nonfamily households - 3-person household (%)
Size of nonfamily households - 4-person household (%)
Size of nonfamily households - 5-person household (%)
Size of nonfamily households - 6-person household (%)
Size of nonfamily households - 7-or-moreperson household (%)
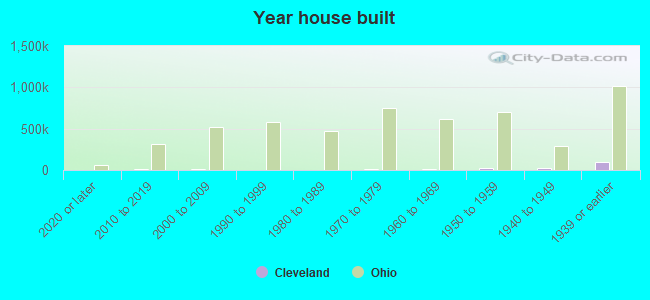
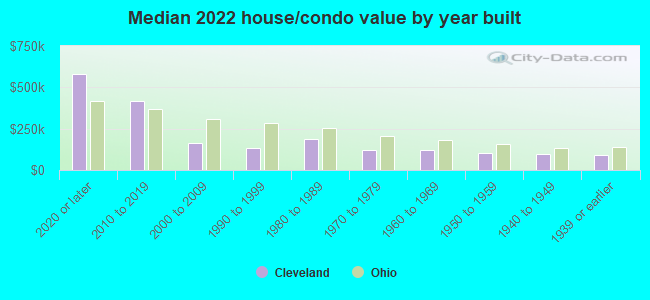
Year house built - Built 2010 or later (%)
Year house built - Built 2000 to 2009 (%)
Year house built - Built 1990 to 1999 (%)
Year house built - Built 1980 to 1989 (%)
Year house built - Built 1970 to 1979 (%)
Year house built - Built 1960 to 1969 (%)
Year house built - Built 1950 to 1959 (%)
Year house built - Built 1940 to 1949 (%)
Year house built - Built 1939 or earlier (%)
Median number of rooms in houses and condos
Median number of rooms in apartments
Median number of bedrooms in owner occupied houses
Mean number of bedrooms in owner occupied houses
Median number of bedrooms in renter occupied houses
Mean number of bedrooms in renter occupied houses
Median number of vehichles in owner occupied houses
Mean number of vehichles in owner occupied houses
Median number of vehichles in renter occupied houses
Mean number of vehichles in renter occupied houses
Rooms in owner-occupied houses - 1 room (%)
Rooms in owner-occupied houses - 2 rooms (%)
Rooms in owner-occupied houses - 3 rooms (%)
Rooms in owner-occupied houses - 4 rooms (%)
Rooms in owner-occupied houses - 5 rooms (%)
Rooms in owner-occupied houses - 6 rooms (%)
Rooms in owner-occupied houses - 7 rooms (%)
Rooms in owner-occupied houses - 8 rooms (%)
Rooms in owner-occupied houses - 9+ rooms (%)
Rooms in renter-occupied houses - 1 room (%)
Rooms in renter-occupied houses - 2 rooms (%)
Rooms in renter-occupied houses - 3 rooms (%)
Rooms in renter-occupied houses - 4 rooms (%)
Rooms in renter-occupied houses - 5 rooms (%)
Rooms in renter-occupied houses - 6 rooms (%)
Rooms in renter-occupied houses - 7 rooms (%)
Rooms in renter-occupied houses - 8 rooms (%)
Rooms in renter-occupied houses - 9+ rooms (%)
Bedrooms in owner-occupied houses - no bedrooms (%)
Bedrooms in owner-occupied houses - 1 bedroom (%)
Bedrooms in owner-occupied houses - 2 bedrooms (%)
Bedrooms in owner-occupied houses - 3 bedrooms (%)
Bedrooms in owner-occupied houses - 4 bedrooms (%)
Bedrooms in owner-occupied houses - 5+ bedrooms (%)
Bedrooms in renter-occupied houses - no bedrooms (%)
Bedrooms in renter-occupied houses - 1 bedroom (%)
Bedrooms in renter-occupied houses - 2 bedrooms (%)
Bedrooms in renter-occupied houses - 3 bedrooms (%)
Bedrooms in renter-occupied houses - 4 bedrooms (%)
Bedrooms in renter-occupied houses - 5+ bedrooms (%)
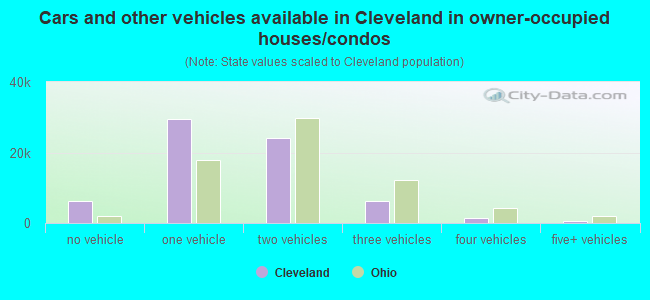
Vehicles available in owner-occupied houses - no vehicle available (%)
Vehicles available in owner-occupied houses - 1 vehicle available(%)
Vehicles available in owner-occupied houses - 2 Vehicles available (%)
Vehicles available in owner-occupied houses - 3 Vehicles available (%)
Vehicles available in owner-occupied houses - 4 Vehicles available (%)
Vehicles available in owner-occupied houses - 5+ Vehicles available (%)
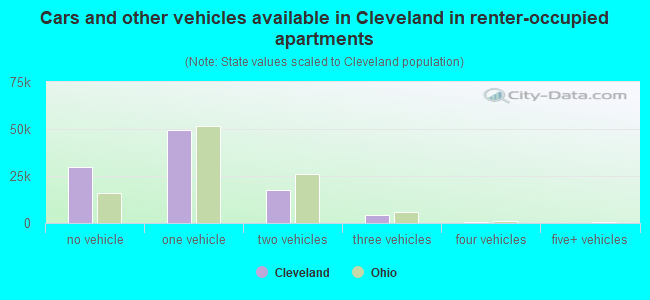
Vehicles available in renter-occupied houses - no vehicle available (%)
Vehicles available in renter-occupied houses - 1 vehicle available (%)
Vehicles available in renter-occupied houses - 2 Vehicles available (%)
Vehicles available in renter-occupied houses - 3 Vehicles available (%)
Vehicles available in renter-occupied houses - 4 Vehicles available (%)
Vehicles available in renter-occupied houses - 5+ Vehicles available (%)
Housing units in structures - 1, detached (%)
Housing units in structures - 1, attached (%)
Housing units in structures - 2 (%)
Housing units in structures - 3 or 4 (%)
Housing units in structures - 5 to 9 (%)
Housing units in structures - 10 to 19 (%)
Housing units in structures - 20 to 49 (%)
Housing units in structures - 50 or more (%)
Housing units in structures - Mobile home (%)
Housing units in structures - Boat, RV, van, etc. (%)
Housing units in structures - Owners - 1, detached (%)
Housing units in structures - Owners - 1, attached (%)
Housing units in structures - Owners - 2 (%)
Housing units in structures - Owners - 3 or 4 (%)
Housing units in structures - Owners - 5 to 9 (%)
Housing units in structures - Owners - 10 to 19 (%)
Housing units in structures - Owners - 20 to 49 (%)
Housing units in structures - Owners - 50 or more (%)
Housing units in structures - Owners - Mobile home (%)
Housing units in structures - Owners - Boat, RV, van, etc. (%)
Housing units in structures - Renters - 1, detached (%)
Housing units in structures - Renters - 1, attached (%)
Housing units in structures - Renters - 2 (%)
Housing units in structures - Renters - 3 or 4 (%)
Housing units in structures - Renters - 5 to 9 (%)
Housing units in structures - Renters - 10 to 19 (%)
Housing units in structures - Renters - 20 to 49 (%)
Housing units in structures - Renters - 50 or more (%)
Housing units in structures - Renters - Mobile home (%)
Housing units in structures - Renters - Boat, RV, van, etc. (%)
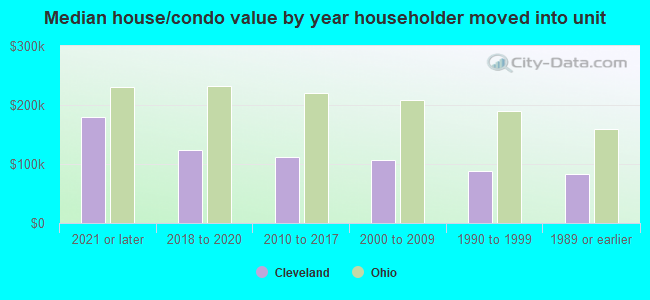
House/condo owner moved in on average (years ago)
Renter moved in on average (years ago)
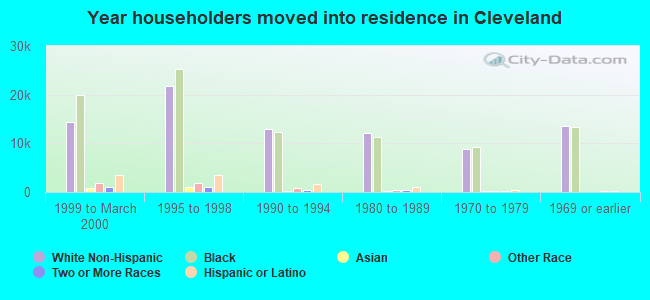
Year householder moved into unit - Moved in 1999 to March 2000 (%)
Year householder moved into unit - Moved in 1999 to March 2000 (%) - White
Year householder moved into unit - Moved in 1999 to March 2000 (%) - Black or African American
Year householder moved into unit - Moved in 1999 to March 2000 (%) - Asian
Year householder moved into unit - Moved in 1999 to March 2000 (%) - Hispanic or Latino
Year householder moved into unit - Moved in 1999 to March 2000 (%) - American Indian and Alaska Native
Year householder moved into unit - Moved in 1999 to March 2000 (%) - Multirace
Year householder moved into unit - Moved in 1999 to March 2000 (%) - Other Race
Year householder moved into unit - Moved in 1995 to 1998 (%)
Year householder moved into unit - Moved in 1995 to 1998 (%) - White
Year householder moved into unit - Moved in 1995 to 1998 (%) - Black or African American
Year householder moved into unit - Moved in 1995 to 1998 (%) - Asian
Year householder moved into unit - Moved in 1995 to 1998 (%) - Hispanic or Latino
Year householder moved into unit - Moved in 1995 to 1998 (%) - American Indian and Alaska Native
Year householder moved into unit - Moved in 1995 to 1998 (%) - Multirace
Year householder moved into unit - Moved in 1995 to 1998 (%) - Other Race
Year householder moved into unit - Moved in 1990 to 1994 (%)
Year householder moved into unit - Moved in 1990 to 1994 (%) - White
Year householder moved into unit - Moved in 1990 to 1994 (%) - Black or African American
Year householder moved into unit - Moved in 1990 to 1994 (%) - Asian
Year householder moved into unit - Moved in 1990 to 1994 (%) - Hispanic or Latino
Year householder moved into unit - Moved in 1990 to 1994 (%) - American Indian and Alaska Native
Year householder moved into unit - Moved in 1990 to 1994 (%) - Multirace
Year householder moved into unit - Moved in 1990 to 1994 (%) - Other Race
Year householder moved into unit - Moved in 1980 to 1989 (%)
Year householder moved into unit - Moved in 1980 to 1989 (%) - White
Year householder moved into unit - Moved in 1980 to 1989 (%) - Black or African American
Year householder moved into unit - Moved in 1980 to 1989 (%) - Asian
Year householder moved into unit - Moved in 1980 to 1989 (%) - Hispanic or Latino
Year householder moved into unit - Moved in 1980 to 1989 (%) - American Indian and Alaska Native
Year householder moved into unit - Moved in 1980 to 1989 (%) - Multirace
Year householder moved into unit - Moved in 1980 to 1989 (%) - Other Race
Year householder moved into unit - Moved in 1970 to 1979 (%)
Year householder moved into unit - Moved in 1970 to 1979 (%) - White
Year householder moved into unit - Moved in 1970 to 1979 (%) - Black or African American
Year householder moved into unit - Moved in 1970 to 1979 (%) - Asian
Year householder moved into unit - Moved in 1970 to 1979 (%) - Hispanic or Latino
Year householder moved into unit - Moved in 1970 to 1979 (%) - American Indian and Alaska Native
Year householder moved into unit - Moved in 1970 to 1979 (%) - Multirace
Year householder moved into unit - Moved in 1970 to 1979 (%) - Other Race
Year householder moved into unit - Moved in 1969 or earlier (%)
Year householder moved into unit - Moved in 1969 or earlier (%) - White
Year householder moved into unit - Moved in 1969 or earlier (%) - Black or African American
Year householder moved into unit - Moved in 1969 or earlier (%) - Asian
Year householder moved into unit - Moved in 1969 or earlier (%) - Hispanic or Latino
Year householder moved into unit - Moved in 1969 or earlier (%) - American Indian and Alaska Native
Year householder moved into unit - Moved in 1969 or earlier (%) - Multirace
Year householder moved into unit - Moved in 1969 or earlier (%) - Other Race
Housing units lacking complete plumbing facilities (%)
Housing units lacking complete kitchen facilities (%)
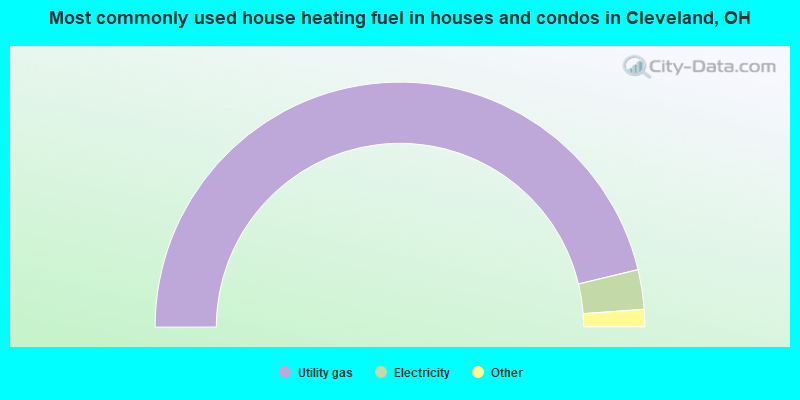
House heating fuel used in houses and condos - Utility gas (%)
House heating fuel used in houses and condos - Bottled, tank, or LP gas (%)
House heating fuel used in houses and condos - Electricity (%)
House heating fuel used in houses and condos - Fuel oil, kerosene, etc. (%)
House heating fuel used in houses and condos - Coal or coke (%)
House heating fuel used in houses and condos - Wood (%)
House heating fuel used in houses and condos - Solar energy (%)
House heating fuel used in houses and condos - Other fuel (%)
House heating fuel used in houses and condos - No fuel used (%)
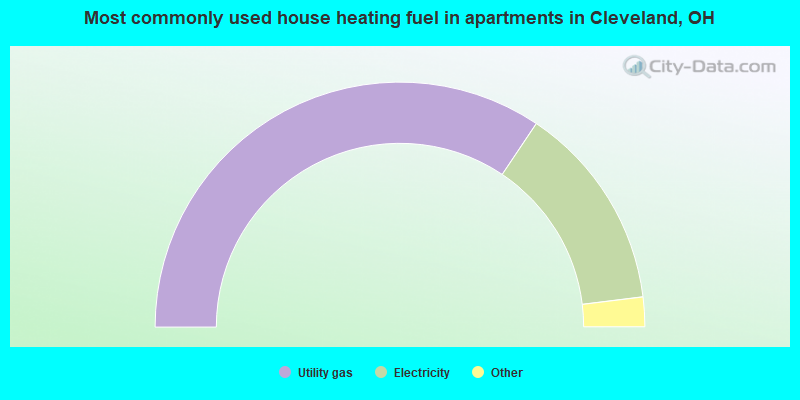
House heating fuel used in apartments - Utility gas (%)
House heating fuel used in apartments - Bottled, tank, or LP gas (%)
House heating fuel used in apartments - Electricity (%)
House heating fuel used in apartments - Fuel oil, kerosene, etc. (%)
House heating fuel used in apartments - Coal or coke (%)
House heating fuel used in apartments - Wood (%)
House heating fuel used in apartments - Solar energy (%)
House heating fuel used in apartments - Other fuel (%)
House heating fuel used in apartments - No fuel used (%)
Latest news about housing in Cleveland, OH collected exclusively by city-data.com from local newspapers, TV, and radio stations
Median year house/condo built: 1938Median year apartment built: 1948Household type by relationship:
Households: 361,654
Male householders: 75,710 (40,801 living alone ), Female householders: 93,717 (37,435 living alone )31,777 spouses (30,762 opposite-sex spouses ), 14,990 unmarried partners , (14,200 opposite-sex unmarried partners ), 92,941 children (88,122 natural , 1,839 adopted , 2,980 stepchildren ), 14,424 grandchildren , 5,440 brothers or sisters , 3,421 parents , 137 foster children , 5,538 other relatives , 11,835 non-relatives In group quarters: 11,724
Size of family households: 35,169 2-persons , 19,133 3-persons , 12,383 4-persons , 5,935 5-persons , 2,291 6-persons , 1,404 7-or-more-persons .
Size of nonfamily households: 78,236 1-person , 12,695 2-persons , 1,543 3-persons , 190 4-persons , 213 5-persons , 235 7-or-more-persons .
13,135 married couples with children. single-parent households (8,631 men , 39,822 women ).
84.8% of residents of Cleveland speak English at home. of residents speak Spanish at home (55% speak English very well , 19% speak English well , 20% speak English not well , 5% don't speak English at all ).of residents speak other Indo-European language at home (69% speak English very well , 22% speak English well , 6% speak English not well , 3% don't speak English at all ).of residents speak Asian or Pacific Island language at home (56% speak English very well , 26% speak English well , 13% speak English not well , 6% don't speak English at all ).of residents speak other language at home (58% speak English very well , 28% speak English well , 9% speak English not well , 5% don't speak English at all ).
Foreign born population: 22,646 (6.3%)of them are naturalized citizens )
Median number of rooms in houses and condos:
Median number of rooms in apartments
Owner-occupied Renter-occupied
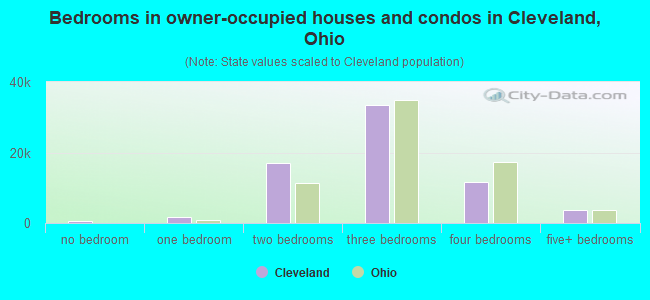
Bedrooms in owner-occupied houses and condos in Cleveland, Ohio
438 no bedroom 1,717 1 bedroom 17,156 2 bedrooms 33,371 3 bedrooms 11,743 4 bedrooms 3,733 5+ bedrooms
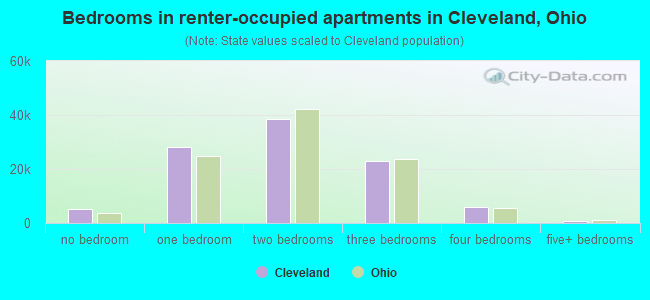
Bedrooms in renter-occupied apartments in Cleveland, Ohio
5,139 no bedroom 27,983 1 bedroom 38,573 2 bedrooms 22,794 3 bedrooms 5,875 4 bedrooms 905 5+ bedrooms
Owner-occupied Renter-occupied
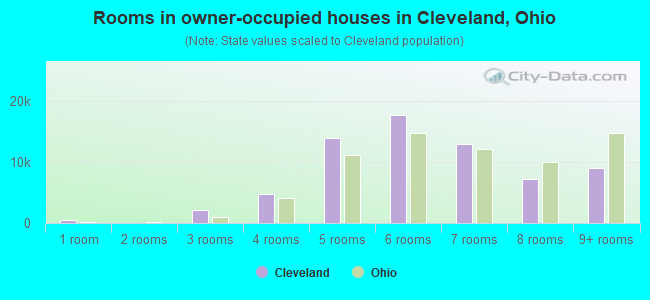
Rooms in owner-occupied houses in Cleveland, Ohio
438 1 room 47 2 rooms 2,061 3 rooms 4,715 4 rooms 13,966 5 rooms 17,706 6 rooms 13,006 7 rooms 7,257 8 rooms 8,962 9+ rooms
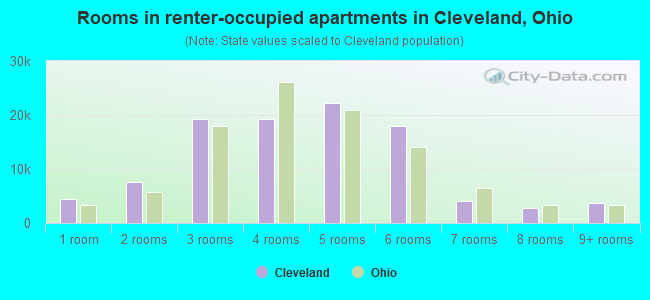
Rooms in renter-occupied apartments in Cleveland, Ohio
4,386 1 room 7,581 2 rooms 19,287 3 rooms 19,237 4 rooms 22,303 5 rooms 17,887 6 rooms 4,120 7 rooms 2,821 8 rooms 3,647 9+ rooms
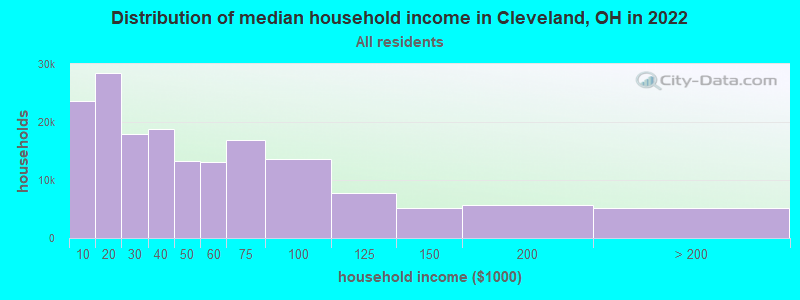
Cleveland, OH household income distribution 23,548 Less than $10,00028,370 $10,000 to $19,99917,936 $20,000 to $29,99918,866 $30,000 to $39,99913,262 $40,000 to $49,99913,175 $50,000 to $59,99916,877 $60,000 to $74,99913,568 $75,000 to $99,9997,779 $100,000 to $124,9995,131 $125,000 to $149,9995,664 $150,000 to $199,9995,251 $200,000 or more
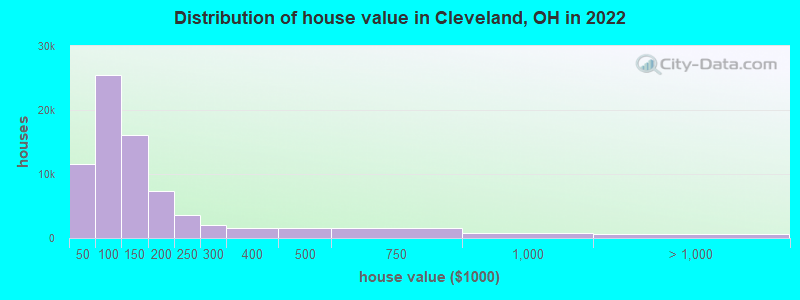
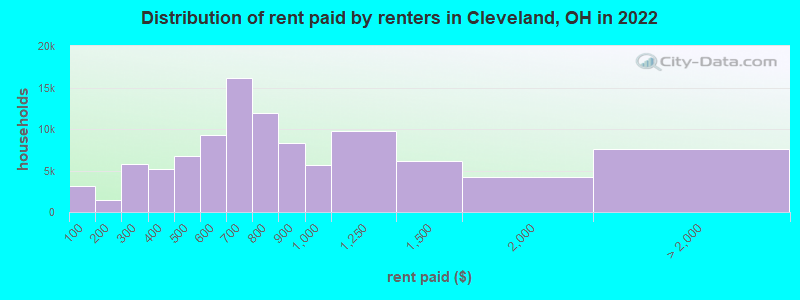
Home value of owner - occupied houses in 2022 in Cleveland, OH 1,005 Less than $10,000995 $10,000 to $14,999352 $15,000 to $19,999893 $20,000 to $24,9991,187 $25,000 to $29,9992,211 $30,000 to $34,999977 $35,000 to $39,9993,915 $40,000 to $49,9994,418 $50,000 to $59,9994,212 $60,000 to $69,9994,117 $70,000 to $79,9994,480 $80,000 to $89,9994,322 $90,000 to $99,9999,871 $100,000 to $124,9996,282 $125,000 to $149,9994,914 $150,000 to $174,9992,392 $175,000 to $199,9993,617 $200,000 to $249,9992,049 $250,000 to $299,9991,523 $300,000 to $399,9991,575 $400,000 to $499,9991,559 $500,000 to $749,999715 $750,000 to $999,999433 $1,000,000 to $1,499,99944 $1,500,000 to $1,999,999100 $2,000,000 or moreRent paid by renters in 2022 in Cleveland, OH 3,074 Less than $100215 $100 to $1491,231 $150 to $1994,083 $200 to $2491,749 $250 to $2992,972 $300 to $3492,247 $350 to $3993,255 $400 to $4493,453 $450 to $4994,527 $500 to $5494,703 $550 to $5998,002 $600 to $6498,097 $650 to $6996,695 $700 to $7495,264 $750 to $7998,358 $800 to $8995,689 $900 to $9999,725 $1,000 to $1,2496,151 $1,250 to $1,4994,221 $1,500 to $1,9992,372 $2,000 to $2,499172 $2,500 to $2,999103 $3,000 to $3,499150 $3,500 or more4,761 No cash rent
Percentage of workers working in this county: 89.6%Number of people working at home: 18,439 (12.0% of all workers )
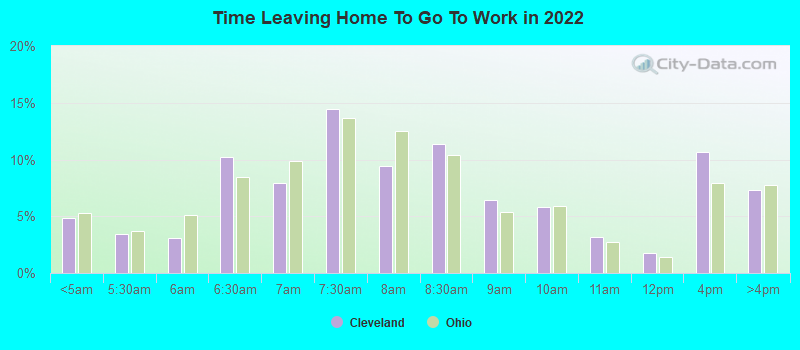
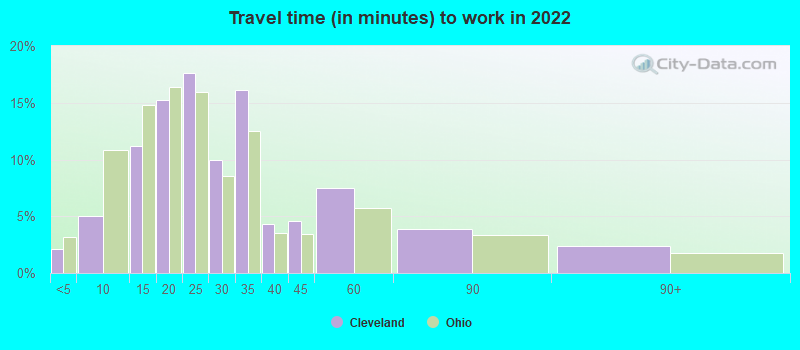
Travel time to work (commute)
Less than 5 minutes: 5,4095 to 9 minutes: 9,56910 to 14 minutes: 24,01215 to 19 minutes: 28,48720 to 24 minutes: 24,44725 to 29 minutes: 10,96030 to 34 minutes: 15,15135 to 39 minutes: 3,87440 to 44 minutes: 2,87145 to 59 minutes: 4,43560 to 89 minutes: 3,37190 or more minutes: 2,341
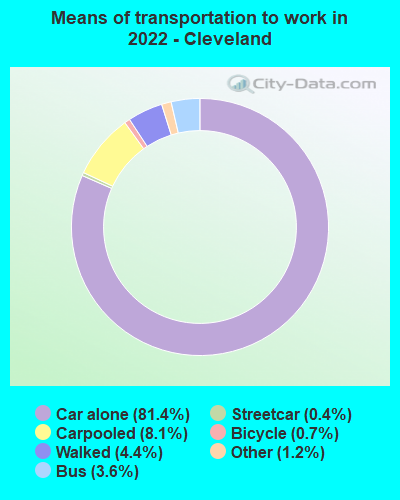
Means of transportation to work:
Drove a car alone: 184,308 (75.2%)Carpooled: 18,323 (7.5%)Bus : 8,188 (3.3%)Subway or elevated rail : 1,009 (0.4%)Long-distance train or commuter rail : 162 (0.1%)Light rail, streetcar or trolley : 172 (0.1%)Taxi: 2,777 (1.1%)Bicycle: 1,571 (0.6%)Walked: 9,981 (4.1%)Worked at home: 18,439 (7.5%)
Unemployment by race in 2022
Unemployment rate for White non-Hispanic residents 3.3% Males2.1% FemalesUnemployment rate for Black residents 17.0% Males13.5% FemalesUnemployment rate for American Indian and Alaska Native residents 5.4% Males4.4% FemalesUnemployment rate for Asian residents 2.1% Males3.0% FemalesUnemployment rate for other race residents 9.6% Males7.0% FemalesUnemployment rate for two or more race residents 13.7% Males13.1% FemalesUnemployment rate for Hispanic or Latino residents 8.0% Males9.6% Females
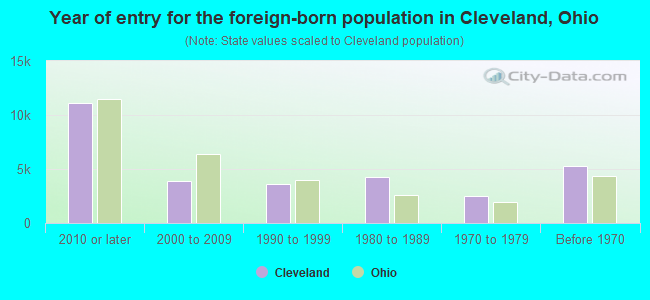
Year of entry for the foreign-born population in Cleveland, Ohio
11,111 2010 or later 3,926 2000 to 2009 3,588 1990 to 1999 4,305 1980 to 1989 2,514 1970 to 1979 5,286 Before 1970
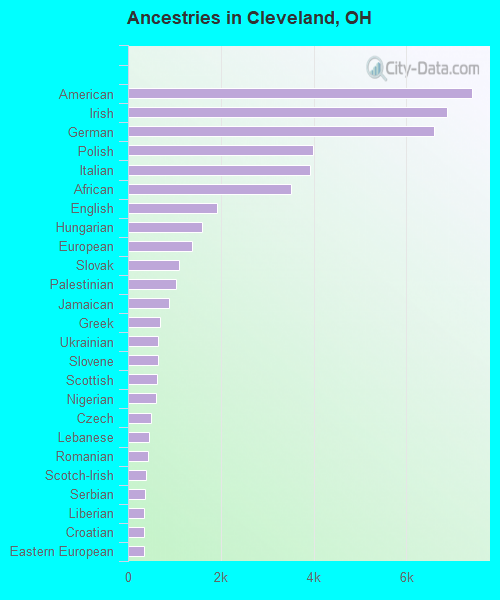
First ancestries reported:
American: 7,409 (3.4%)
Irish: 6,876 (3.2%)
German: 6,595 (3.1%)
Polish: 3,988 (1.9%)
Italian: 3,921 (1.8%)
African: 3,509 (1.6%)
English: 1,910 (0.9%)
Hungarian: 1,590 (0.7%)
European: 1,389 (0.6%)
Slovak: 1,101 (0.5%)
Palestinian: 1,041 (0.5%)
Jamaican: 887 (0.4%)
Greek: 693 (0.3%)
Ukrainian: 651 (0.3%)
Slovene: 649 (0.3%)
Scottish: 630 (0.3%)
Nigerian: 597 (0.3%)
Czech: 496 (0.2%)
Lebanese: 455 (0.2%)
Romanian: 433 (0.2%)
Scotch-Irish: 394 (0.2%)
Serbian: 371 (0.2%)
Liberian: 355 (0.2%)
Croatian: 340 (0.2%)
Eastern European: 336 (0.2%)
Russian: 325 (0.2%)
Syrian: 322 (0.1%)
British: 284 (0.1%)
Arab: 273 (0.1%)
Ghanaian: 245 (0.1%)
Welsh: 219 (0.1%)
Somali: 213 (0.10%)
Lithuanian: 200 (0.09%)
Moroccan: 195 (0.09%)
Trinidadian and Tobagonian: 190 (0.09%)
Yugoslavian: 181 (0.08%)
Iranian: 177 (0.08%)
Sudanese: 158 (0.07%)
French: 157 (0.07%)
Swedish: 144 (0.07%)
Haitian: 141 (0.07%)
Dutch: 130 (0.06%)
Afghan: 129 (0.06%)
Albanian: 128 (0.06%)
Swiss: 127 (0.06%)
Egyptian: 113 (0.05%)
Jordanian: 103 (0.05%)
Israeli: 102 (0.05%)
Austrian: 99 (0.05%)
Iraqi: 91 (0.04%)
Finnish: 87 (0.04%)
Czechoslovakian: 83 (0.04%)
Northern European: 80 (0.04%)
Ethiopian: 80 (0.04%)
French Canadian: 78 (0.04%)
Guyanese: 65 (0.03%)
Canadian: 65 (0.03%)
Zimbabwean: 62 (0.03%)
Icelander: 61 (0.03%)
Norwegian: 56 (0.03%)
Armenian: 56 (0.03%)
Belizean: 54 (0.03%)
Bulgarian: 50 (0.02%)
Portuguese: 49 (0.02%)
Scandinavian: 48 (0.02%)
West Indian: 47 (0.02%)
Barbadian: 35 (0.02%)
South African: 28 (0.01%)
Latvian: 25 (0.01%)
Turkish: 24 (0.01%)
Belgian: 18 (0.01%)
Celtic: 18 (0.01%)
Pennsylvania German: 15 (0.01%)
Slavic: 15 (0.01%)
Brazilian: 12 (0.01%)
Most common places of birth for foreign-born residents (%): China, excluding Hong Kong and Taiwan Cleveland:
6.8% (1,533)Ohio:
6.2% (35,703)
Mexico Cleveland:
5.9% (1,338)Ohio:
7.8% (44,796)
India Cleveland:
5.2% (1,178)Ohio:
11.6% (66,525)
Dominican Republic Cleveland:
3.7% (831)Ohio:
1.1% (6,549)
Bhutan Cleveland:
3.6% (815)Ohio:
2.4% (13,773)
Nigeria Cleveland:
3.3% (753)Ohio:
1.2% (7,029)
Jamaica Cleveland:
3.2% (733)Ohio:
0.7% (4,187)
Afghanistan Cleveland:
2.9% (652)Ohio:
0.2% (1,151)
Guatemala Cleveland:
2.6% (594)Ohio:
1.6% (9,312)
Nepal Cleveland:
2.6% (581)Ohio:
1.9% (10,777)
Philippines Cleveland:
2.4% (548)Ohio:
3.1% (17,818)
Germany Cleveland:
2.4% (541)Ohio:
2.2% (12,846)
Canada Cleveland:
2.2% (486)Ohio:
2.6% (14,988)
Honduras Cleveland:
2.0% (447)Ohio:
1.0% (5,553)
Syria Cleveland:
2.0% (444)Ohio:
0.7% (3,842)
Romania Cleveland:
1.9% (435)Ohio:
1.1% (6,346)
Vietnam Cleveland:
1.8% (410)Ohio:
1.9% (10,960)
Pakistan Cleveland:
1.7% (392)Ohio:
1.0% (5,444)
Poland Cleveland:
1.5% (344)Ohio:
0.8% (4,490)
Place of birth for U.S.-born residents:
This state: 258,495Other state: 64,860Northeast: 14,716Midwest: 12,144South: 32,783West: 5,217 81.2% of Cleveland residents lived in the same house 1 years ago.
Out of people who lived in different houses, 41.1% lived in this county.
Out of people who lived in different counties, 38.3% lived in Ohio.
Cleveland:
81.2%State average:
87.8%
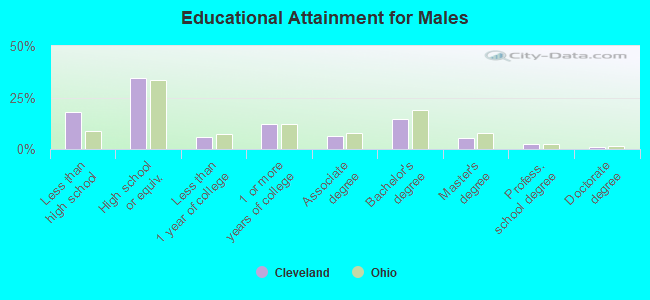
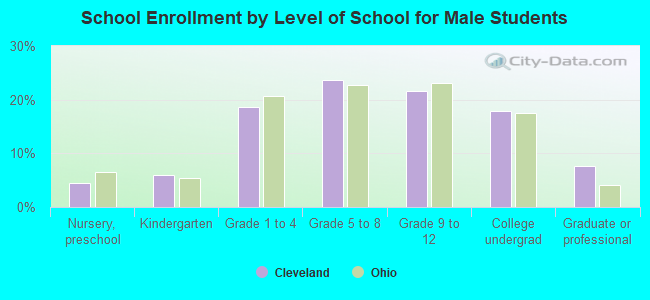
Education attainment for males 25 years and older:
No schooling: 2,699Nursery to 4th grade: 525th and 6th grade: 1,0877th and 8th grade: 1,9359th grade: 3,12410th grade: 3,51411th grade: 5,48012th grade, no diploma: 3,462High school graduate (or equivalency): 40,926Less than 1 year of college: 7,228Some college more than 1 year, no degree: 14,526Associate degree: 7,675Bachelor's degree: 17,360Master's degree: 6,119Professional school degree: 2,695Doctorate degree: 1,419
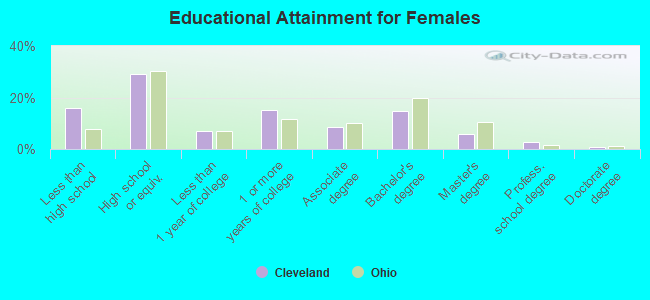
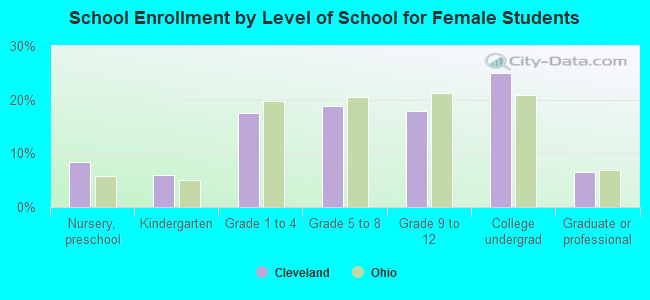
Education attainment for females 25 years and older:
No schooling: 2,237Nursery to 4th grade: 5375th and 6th grade: 7457th and 8th grade: 1,7649th grade: 3,18310th grade: 3,97711th grade: 4,68412th grade, no diploma: 3,620High school graduate (or equivalency): 37,764Less than 1 year of college: 8,951Some college more than 1 year, no degree: 19,625Associate degree: 11,333Bachelor's degree: 19,357Master's degree: 7,509Professional school degree: 3,741Doctorate degree: 918
Housing units in structures:
One, detached: 90,168One, attached: 17,818Two: 30,0513 or 4: 11,2455 to 9: 7,44510 to 19: 9,96920 to 49: 6,10250 or more: 26,706Mobile homes: 534Boats, RVs, vans, etc.: 185Housing units lacking complete plumbing facilities in 2022: 4.1%Housing units lacking complete kitchen facilities in 2022: 6.7%House/condo owner moved in on average 18 years ago
Renter moved in on average 3 years ago
Private vs. public school enrollment:
Students in private schools in grades 1 to 8 (elementary and middle school): 7,425 Students in private schools in grades 9 to 12 (high school): 2,774 Students in private undergraduate colleges: 7,669