Housing density: 1,776 houses/condos per square mile
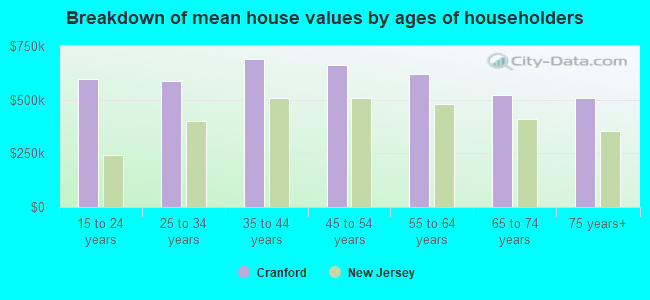
Median price asked for vacant for-sale houses and condos in 2022 in this county: $468,662.
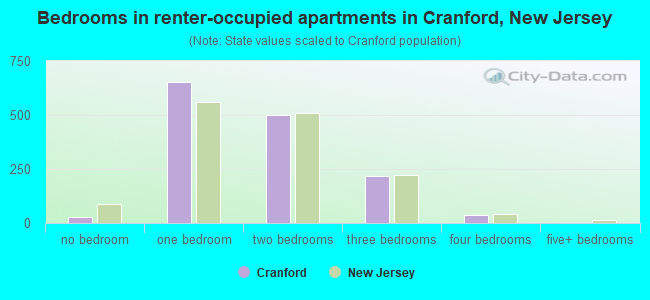
Median contract rent in 2022: $1,680 (lower quartile is $1,192, upper quartile is over $2,000)
Median rent asked for vacant for-rent units in 2022: $2,774
Median gross rent in Cranford, NJ in 2022: $1,863
Housing units in Cranford with a mortgage: 4,183 (495 second mortgage, 679 home equity loan, 28 both second mortgage and home equity loan) Houses without a mortgage: 2,053
In family households: 464,085 (87,269 male householders, 47,405 female householders)
94,325 spouses, 171,221 children (162,243 natural, 3,299 adopted, 5,679 stepchildren), 11,365 grandchildren, 8,963 brothers or sisters, 8,956 parents, foster children, 13,013 other relatives, 16,322 non-relatives
In nonfamily households: 65,610 (23,484 male householders (18,363 living alone)), 29,960 female householders (26,038 living alone)), 12,166 nonrelatives
In group quarters: 6,804 (4,209 institutionalized population)
88,023 married couples with children.
26,686 single-parent households (5,364 men, 21,322 women).
87.5% of residents of Cranford speak English at home.
3.0% of residents speak Spanish at home (70% speak English very well, 18% speak English well, 11% speak English not well, 1% don't speak English at all).
7.4% of residents speak other Indo-European language at home (76% speak English very well, 16% speak English well, 7% speak English not well, 1% don't speak English at all).
1.4% of residents speak Asian or Pacific Island language at home (62% speak English very well, 20% speak English well, 18% speak English not well).
0.7% of residents speak other language at home (86% speak English very well, 14% speak English well).
Foreign born population: 2,838 (11.5%)
(73.8% of them are naturalized citizens)
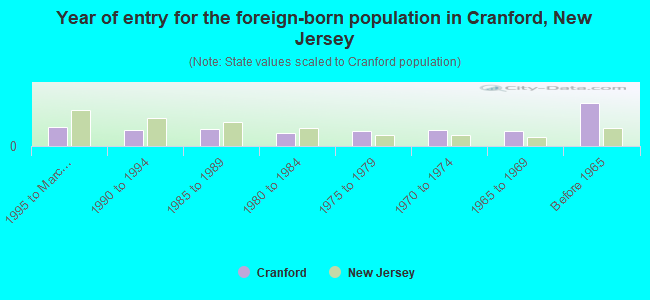
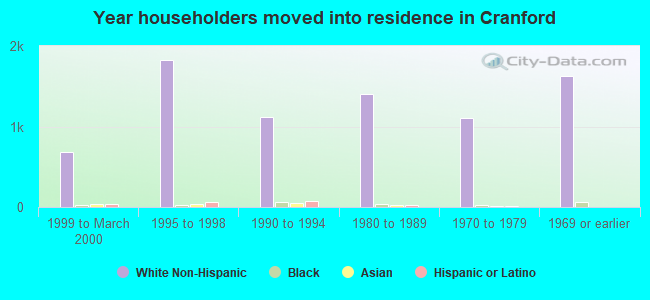
Year of entry for the foreign-born population in Cranford, New Jersey
2381995 to March 2000
2021990 to 1994
2221985 to 1989
1711980 to 1984
1961975 to 1979
1981970 to 1974
1961965 to 1969
542Before 1965
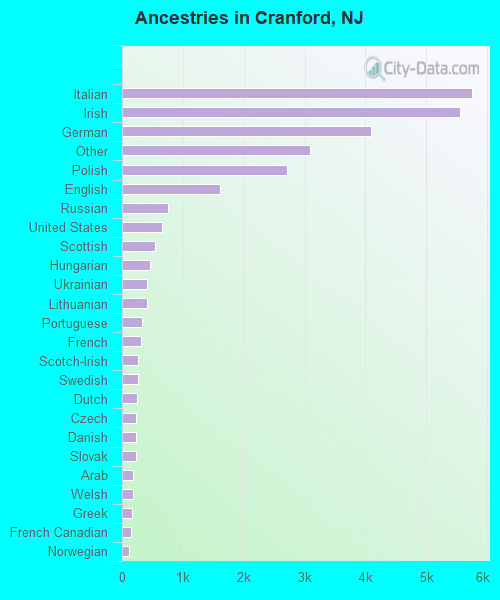
First ancestries reported:
Italian: 5,742 (19.7%)
Irish: 5,549 (19.1%)
German: 4,097 (14.1%)
Other: 3,091 (10.6%)
Polish: 2,705 (9.3%)
English: 1,616 (5.6%)
Russian: 750 (2.6%)
United States: 662 (2.3%)
Scottish: 545 (1.9%)
Hungarian: 468 (1.6%)
Ukrainian: 412 (1.4%)
Lithuanian: 406 (1.4%)
Portuguese: 326 (1.1%)
French: 318 (1.1%)
Scotch-Irish: 269 (0.9%)
Swedish: 260 (0.9%)
Dutch: 254 (0.9%)
Czech: 232 (0.8%)
Danish: 229 (0.8%)
Slovak: 223 (0.8%)
Arab: 186 (0.6%)
Welsh: 183 (0.6%)
Greek: 162 (0.6%)
French Canadian: 145 (0.5%)
Norwegian: 110 (0.4%)
Swiss: 84 (0.3%)
West Indian: 42 (0.1%)
Subsaharan African: 30 (0.1%)
Most common places of birth for foreign-born residents (%):
Italy
Cranford:
13.5% (266)
New Jersey:
4.0% (58,395)
Cuba
Cranford:
6.8% (134)
New Jersey:
3.7% (55,241)
United Kingdom
Cranford:
6.2% (121)
New Jersey:
2.1% (30,355)
Poland
Cranford:
6.0% (118)
New Jersey:
3.8% (55,466)
Philippines
Cranford:
5.2% (102)
New Jersey:
4.7% (69,773)
Portugal
Cranford:
4.3% (85)
New Jersey:
2.5% (37,183)
Germany
Cranford:
4.3% (84)
New Jersey:
2.3% (33,531)
Ukraine
Cranford:
3.9% (77)
New Jersey:
1.0% (14,768)
Russia
Cranford:
3.6% (71)
New Jersey:
1.4% (20,243)
Ireland
Cranford:
3.5% (69)
New Jersey:
0.8% (12,082)
Canada
Cranford:
3.0% (58)
New Jersey:
1.1% (16,333)
China, excluding Hong Kong and Taiwan
Cranford:
2.7% (54)
New Jersey:
2.7% (40,092)
Hungary
Cranford:
2.5% (50)
New Jersey:
0.5% (7,426)
Argentina
Cranford:
2.4% (48)
New Jersey:
0.6% (9,102)
India
Cranford:
2.4% (47)
New Jersey:
8.1% (119,497)
Other Eastern Europe
Cranford:
2.4% (47)
New Jersey:
1.2% (17,647)
Guatemala
Cranford:
1.6% (32)
New Jersey:
1.4% (20,190)
Czechoslovakia (includes Czech Republic and Slovakia)
Cranford:
1.6% (31)
New Jersey:
0.4% (5,744)
Korea
Cranford:
1.6% (31)
New Jersey:
3.5% (51,970)
Bangladesh
Cranford:
1.5% (30)
New Jersey:
0.4% (5,929)
Place of birth for U.S.-born residents:
This state: 15,301
Other state: 5,167
Northeast: 3,975
Midwest: 459
South: 520
West: 213
71% of Cranford residents lived in the same house 5 years ago. Out of people who lived in different houses, 61% lived in this county. Out of people who lived in different counties, 58% lived in New Jersey.
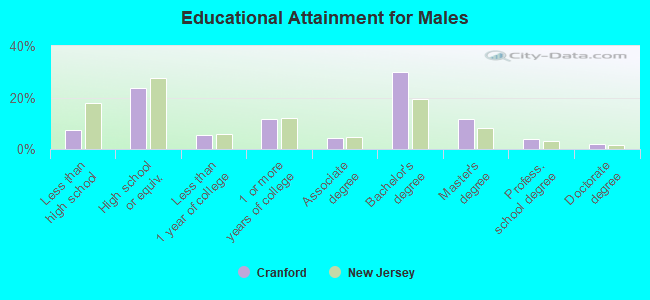
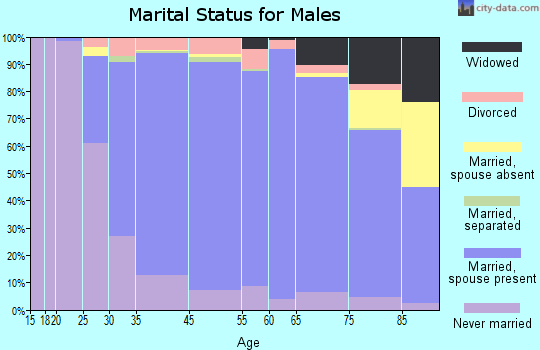
Education attainment for males 25 years and older:
No schooling: 12
Nursery to 4th grade: 5
5th and 6th grade: 52
7th and 8th grade: 87
9th grade: 71
10th grade: 150
11th grade: 57
12th grade, no diploma: 102
High school graduate (or equivalency): 1,753
Less than 1 year of college: 412
Some college more than 1 year, no degree: 862
Associate degree: 313
Bachelor's degree: 2,193
Master's degree: 867
Professional school degree: 292
Doctorate degree: 153
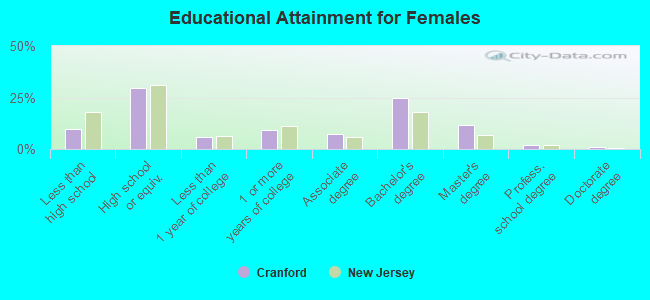
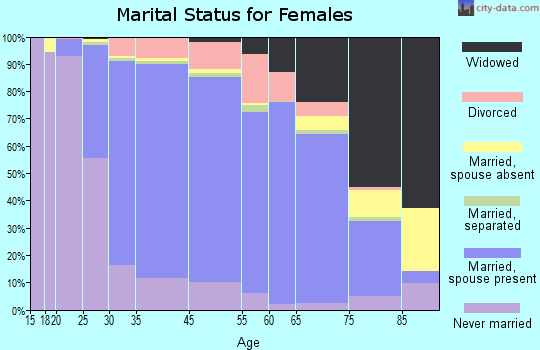
Education attainment for females 25 years and older:
No schooling: 34
Nursery to 4th grade: 15
5th and 6th grade: 54
7th and 8th grade: 203
9th grade: 114
10th grade: 129
11th grade: 87
12th grade, no diploma: 204
High school graduate (or equivalency): 2,602
Less than 1 year of college: 497
Some college more than 1 year, no degree: 800
Associate degree: 626
Bachelor's degree: 2,175
Master's degree: 1,044
Professional school degree: 158
Doctorate degree: 81
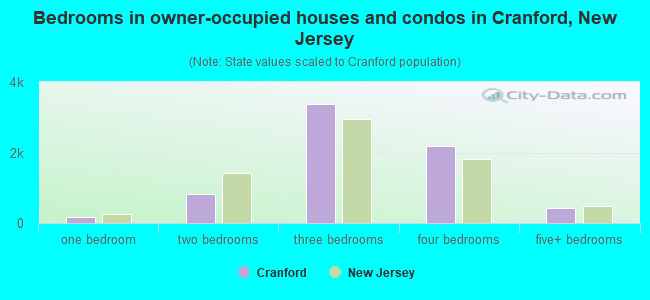
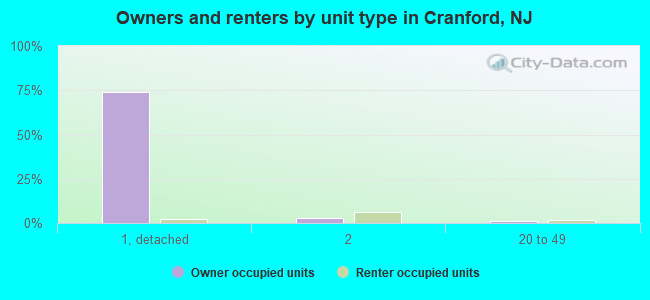
Housing units in structures:
One, detached: 6,523
One, attached: 232
Two: 816
3 or 4: 192
5 to 9: 120
10 to 19: 108
20 to 49: 253
50 or more: 310
Mobile homes: 6
Median worth of mobile homes: $304,705
Housing units lacking complete plumbing facilities: 0.4%
Housing units lacking complete kitchen facilities: 0.2%