Cumberland, KY (Kentucky) Houses and Residents
| Cumberland: | $66,431 |
| Kentucky: | $196,300 |
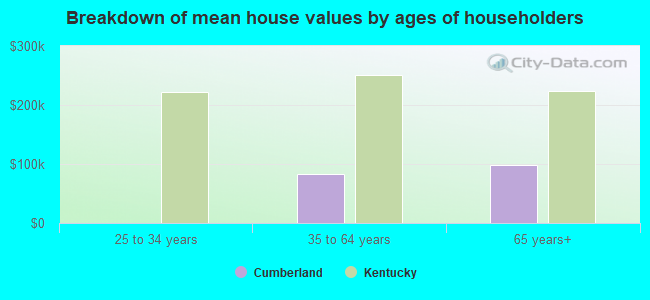
Mean price in 2022:
Detached houses: $86,160
Here: $86,160 State: $256,452 Mobile homes: $50,970
Here: $50,970 State: $84,635
Total population: 2,140 (Urban population: 2,122 (all inside urban clusters), Rural population: 504 (all nonfarm))
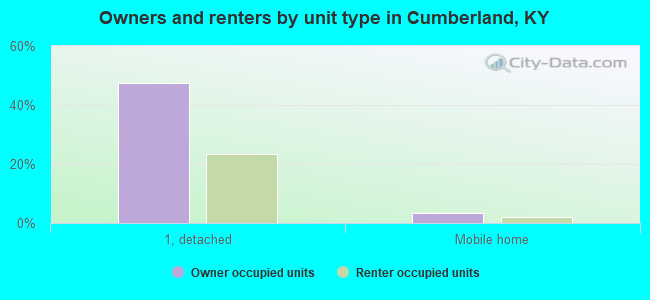
Houses: 1,085 (839 occupied: 432 owner occupied, 424 renter occupied)
| % of renters here: | 50% |
| State: | 31% |
Housing density: 237 houses/condos per square mile
Median price asked for vacant for-sale houses and condos in 2022 in this county: $174,943.
Median contract rent in 2022: $370 (lower quartile is $273, upper quartile is $538)
Median rent asked for vacant for-rent units in 2022: $1,496
Median gross rent in Cumberland, KY in 2022: $536
Housing units in Cumberland with a mortgage: 106 (3 second mortgage, 0 home equity loan, 3 both second mortgage and home equity loan)
Houses without a mortgage: 3
Median household income for houses/condos with a mortgage: $36,939
Median household income for apartments without a mortgage: $42,007
Median monthly housing costs: $488
Compare current foreclosures near Cumberland, KY:
| Photo | Address | Area | Beds / Baths | Price | Details |
|---|---|---|---|---|---|

|
#1
Highway 522
Cumberland, KY 40823
|
2,000 sq. feet
|
1 baths 3 beds |
$120,000
|
show details |

|
#2
Woodland Ln
Cumberland, KY 40823
|
- sq. feet
|
- baths - beds |
show details | |

|
#3
Railroad St
Cumberland, KY 40823
|
- sq. feet
|
- baths - beds |
show details | |

|
#4
Bedrock Dr
Dryden, VA 24243
|
1,597 sq. feet
|
2 baths 3 beds |
show details | |

|
#5
Cornelia Ave
Whitesburg, KY 41858
|
1,894 sq. feet
|
2 baths 3 beds |
show details | |

|
#6
Foothills Rd
Whitesburg, KY 41858
|
1,104 sq. feet
|
1 baths 3 beds |
show details | |

|
#7
Spike Dr
Jeremiah, KY 41826
|
2,149 sq. feet
|
2 baths 3 beds |
show details | |

|
#8
4th Ave E
Big Stone Gap, VA 24219
|
2,072 sq. feet
|
3 baths 4 beds |
show details | |

|
#9
Hazelnut Dr
Yeaddiss, KY 41777
|
1,680 sq. feet
|
1 baths 4 beds |
show details | |

|
#10
Parks St
Whitesburg, KY 41858
|
752 sq. feet
|
1 baths 2 beds |
show details |
| Photo | Address | Area | Beds / Baths | Price | Details |
|---|---|---|---|---|---|

|
#11
Big Fork Rd
Yeaddiss, KY 41777
|
768 sq. feet
|
1 baths 3 beds |
show details | |

|
#12
Veterans Memorial Hwy
Big Stone Gap, VA 24219
|
- sq. feet
|
2 baths 3 beds |
show details | |

|
#13
Upper River Rd
Viper, KY 41774
|
- sq. feet
|
1 baths 4 beds |
show details | |

|
#14
Delvale Rd
Keokee, VA 24265
|
- sq. feet
|
1 baths 3 beds |
show details | |

|
#15
S Ky Highway 15
Happy, KY 41746
|
- sq. feet
|
- baths - beds |
show details | |

|
#16
Sunset View Loop
Mayking, KY 41837
|
- sq. feet
|
- baths - beds |
show details | |

|
#17
Lewis Hollow Rd
Viper, KY 41774
|
1,050 sq. feet
|
- baths - beds |
show details | |

|
#18
Highway 215
Evarts, KY 40828
|
- sq. feet
|
- baths - beds |
show details | |

|
#19
Montgomery Creek Rd
Vicco, KY 41773
|
- sq. feet
|
- baths - beds |
show details | |

|
#20
Low Gap Br
Isom, KY 41824
|
- sq. feet
|
- baths - beds |
show details |
| Photo | Address | Area | Beds / Baths | Price | Details |
|---|---|---|---|---|---|

|
#21
Ky Highway 7
Viper, KY 41774
|
- sq. feet
|
- baths - beds |
show details | |

|
#22
Mountain Ash Dr
Dryden, VA 24243
|
- sq. feet
|
- baths - beds |
show details | |

|
#23
Hall Mountain Rd
Viper, KY 41774
|
- sq. feet
|
- baths - beds |
show details | |

|
#24
Kenny Phillips Rd
Eolia, KY 40826
|
- sq. feet
|
- baths - beds |
show details | |

|
#25
Blackberry Rd
Mayking, KY 41837
|
- sq. feet
|
- baths - beds |
show details | |

|
#26
Goldenrod Ln
Vicco, KY 41773
|
- sq. feet
|
- baths - beds |
show details | |

|
#27
Heritage Dr
Whitesburg, KY 41858
|
- sq. feet
|
- baths - beds |
show details | |

|
#28
Highway 931 N
Whitesburg, KY 41858
|
- sq. feet
|
- baths - beds |
show details | |

|
#29
Beatty Branch Rd
Wooton, KY 41776
|
720 sq. feet
|
- baths - beds |
show details | |

|
#30
Baum Hollow Rd
Big Stone Gap, VA 24219
|
- sq. feet
|
- baths - beds |
show details |
| Photo | Address | Area | Beds / Baths | Price | Details |
|---|---|---|---|---|---|

|
#31
Hales Branch Rd
Redfox, KY 41847
|
- sq. feet
|
- baths - beds |
show details | |

|
#32
Stonegate Dr Apt 335
Pennington Gap, VA 24277
|
- sq. feet
|
- baths - beds |
show details | |

|
#33
Angler Rd
Eolia, KY 40826
|
- sq. feet
|
- baths - beds |
show details | |

|
#34
Highway 588
Whitesburg, KY 41858
|
- sq. feet
|
- baths - beds |
show details | |

|
#35
Westend Dr
Whitesburg, KY 41858
|
- sq. feet
|
- baths - beds |
show details | |

|
#36
Edith Dr
Jeremiah, KY 41826
|
- sq. feet
|
- baths - beds |
show details | |

|
#37
Spruce St
Benham, KY 40807
|
- sq. feet
|
- baths - beds |
show details | |

|
#38
Highway 160
Linefork, KY 41833
|
- sq. feet
|
- baths - beds |
show details | |

|
#39
Highway 3403
Partridge, KY 40862
|
- sq. feet
|
- baths - beds |
show details | |

|
#40
Big Jakes Br
Gordon, KY 41819
|
- sq. feet
|
- baths - beds |
show details |
| Photo | Address | Area | Beds / Baths | Price | Details |
|---|---|---|---|---|---|

|
#41
Ky Highway 463
Delphia, KY 41735
|
- sq. feet
|
- baths - beds |
show details | |

|
#42
Elkins Br
Partridge, KY 40862
|
- sq. feet
|
- baths - beds |
show details | |

|
#43
Seibers Rd
Closplint, KY 40927
|
- sq. feet
|
- baths - beds |
show details | |

|
#44
Highway 522
Totz, KY 40870
|
- sq. feet
|
- baths - beds |
show details | |

|
#45
Highway 160
Whitesburg, KY 41858
|
- sq. feet
|
- baths - beds |
show details | |

|
#46
Highway 1103
Hallie, KY 41821
|
- sq. feet
|
- baths - beds |
show details | |

|
#47
Newtown Rd
Appalachia, VA 24216
|
- sq. feet
|
- baths - beds |
show details | |

|
#48
Bent Branch Rd
Cornettsville, KY 41731
|
- sq. feet
|
- baths - beds |
show details | |

|
#49
Sycamore Rd
Appalachia, VA 24216
|
- sq. feet
|
- baths - beds |
show details | |

|
Check over 1 million property listings on Foreclosure.com!
|
browse all offers | |||

Latest news about housing in Cumberland, KY collected exclusively by city-data.com from local newspapers, TV, and radio stations


Median year apartment built: 1971
Household type by relationship:
Households: 2,394- Male householders: 230 (78 living alone), Female householders: 600 (211 living alone)
317 spouses (303 opposite-sex spouses), 18 unmarried partners, (18 opposite-sex unmarried partners), 811 children (779 natural, 32 adopted, 0 stepchildren), 116 grandchildren, 7 brothers or sisters, 80 parents, 0 foster children, 89 other relatives, 45 non-relatives
- In group quarters: 79
Size of family households: 226 2-persons, 83 3-persons, 89 4-persons, 30 5-persons, 108 6-persons, 5 7-or-more-persons.
Size of nonfamily households: 305 1-person, 9 2-persons.
419 married couples with children.
269 single-parent households (10 men, 259 women).
98.6% of residents of Cumberland speak English at home.
1.2% of residents speak Spanish at home (100% speak English very well).
0.5% of residents speak Asian or Pacific Island language at home (70% speak English very well, 30% speak English not well).
Foreign born population: 3 (0.1%)
(0.0% of them are naturalized citizens)
| Here: | 6.6 |
| State: | 6.4 |
| Here: | 5.1 |
| State: | 4.4 |
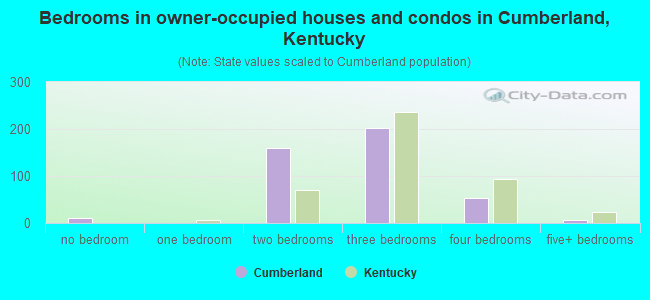
- Bedrooms in owner-occupied houses and condos in Cumberland, Kentucky
- 10no bedroom
- 01 bedroom
- 1592 bedrooms
- 2033 bedrooms
- 544 bedrooms
- 65+ bedrooms
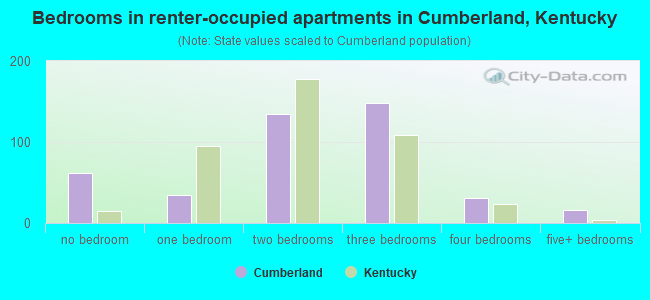
- Bedrooms in renter-occupied apartments in Cumberland, Kentucky
- 62no bedroom
- 341 bedroom
- 1342 bedrooms
- 1483 bedrooms
- 314 bedrooms
- 165+ bedrooms
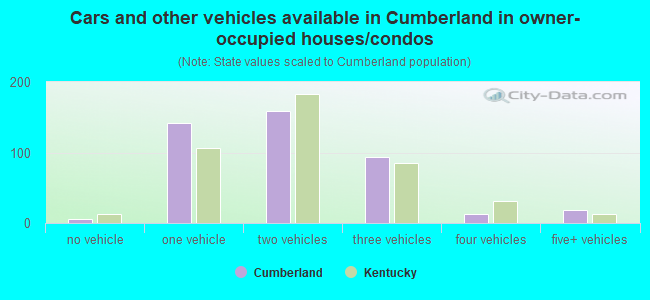
- Cars and other vehicles available in Cumberland in owner-occupied houses/condos
- 6no vehicle
- 1421 vehicle
- 1592 vehicles
- 933 vehicles
- 134 vehicles
- 195+ vehicles
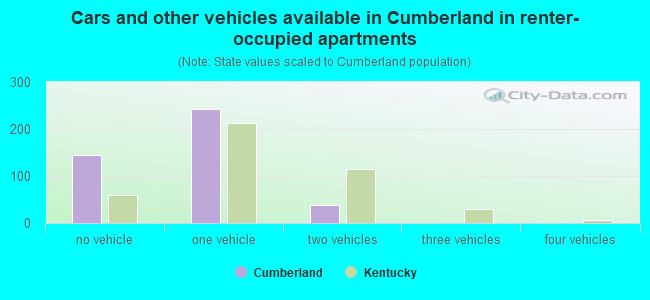
- Cars and other vehicles available in Cumberland in renter-occupied apartments
- 144no vehicle
- 2431 vehicle
- 382 vehicles
- 03 vehicles
- 04 vehicles
- 05+ vehicles
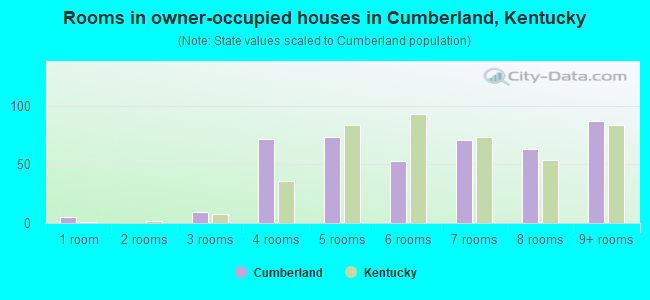
- Rooms in owner-occupied houses in Cumberland, Kentucky
- 51 room
- 02 rooms
- 93 rooms
- 714 rooms
- 735 rooms
- 536 rooms
- 707 rooms
- 638 rooms
- 879+ rooms
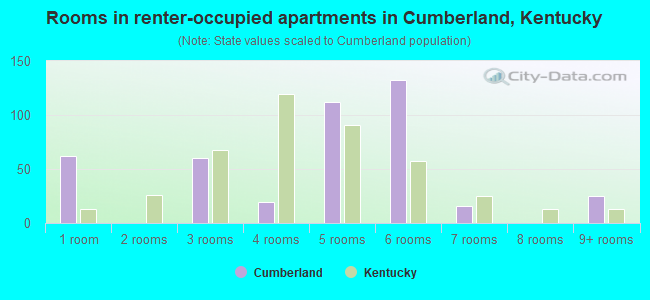
- Rooms in renter-occupied apartments in Cumberland, Kentucky
- 621 room
- 02 rooms
- 603 rooms
- 194 rooms
- 1125 rooms
- 1326 rooms
- 167 rooms
- 08 rooms
- 259+ rooms
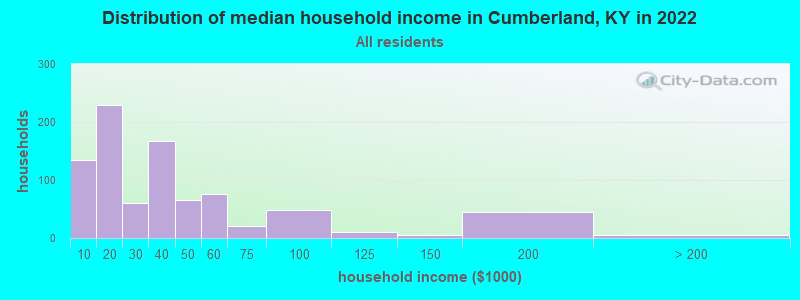
Cumberland, KY household income distribution

- 135Less than $10,000
- 230$10,000 to $19,999
- 61$20,000 to $29,999
- 167$30,000 to $39,999
- 66$40,000 to $49,999
- 76$50,000 to $59,999
- 21$60,000 to $74,999
- 49$75,000 to $99,999
- 10$100,000 to $124,999
- 6$125,000 to $149,999
- 44$150,000 to $199,999
- 6$200,000 or more
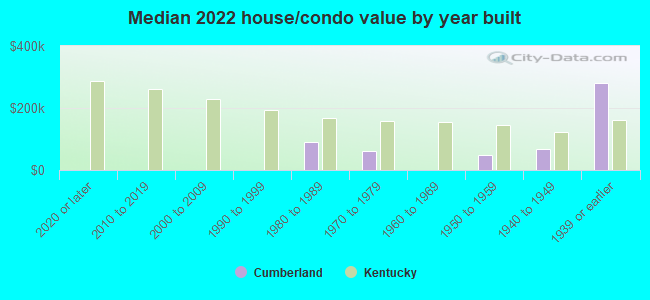
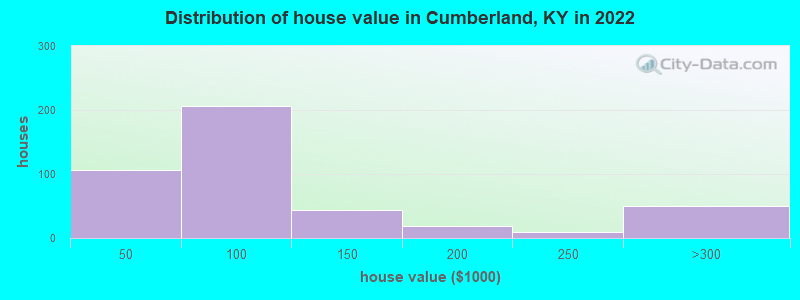
Home value of owner - occupied houses in 2022 in Cumberland, KY
-
- 19Less than $10,000
- 7$10,000 to $14,999
- 34$15,000 to $19,999
- 4$25,000 to $29,999
- 4$30,000 to $34,999
- 2$35,000 to $39,999
- 35$40,000 to $49,999
- 84$50,000 to $59,999
- 45$60,000 to $69,999
- 11$70,000 to $79,999
- 24$80,000 to $89,999
- 5$90,000 to $99,999
- 20$100,000 to $124,999
- 23$125,000 to $149,999
- 5$150,000 to $174,999
- 13$175,000 to $199,999
- 9$200,000 to $249,999
- 50$250,000 to $299,999
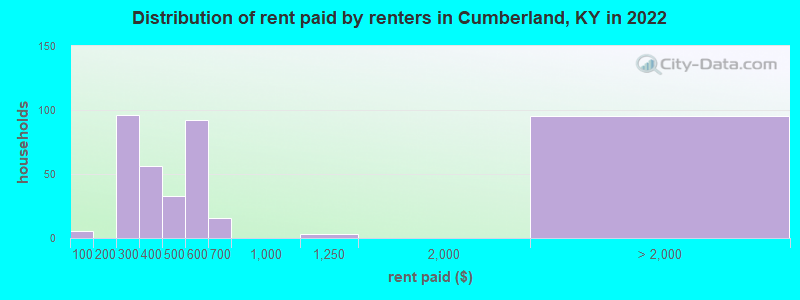
Rent paid by renters in 2022 in Cumberland, KY
-
- 5Less than $100
- 35$200 to $249
- 60$250 to $299
- 36$300 to $349
- 19$350 to $399
- 13$400 to $449
- 19$450 to $499
- 61$500 to $549
- 30$550 to $599
- 15$650 to $699
- 3$1,000 to $1,249
- 95No cash rent
Percentage of workers working in this county: 93.4%
Number of people working at home: 46 (13.7% of all workers)
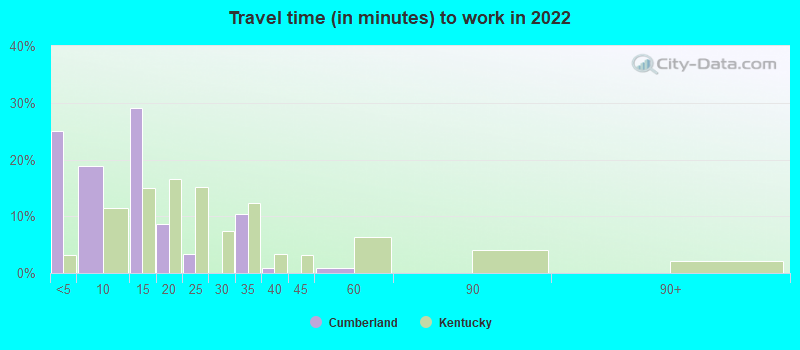
Travel time to work (commute)
- Less than 5 minutes: 65
- 5 to 9 minutes: 73
- 10 to 14 minutes: 69
- 15 to 19 minutes: 15
- 20 to 24 minutes: 16
- 25 to 29 minutes: 0
- 30 to 34 minutes: 27
- 35 to 39 minutes: 0
- 40 to 44 minutes: 0
- 45 to 59 minutes: 0
- 60 to 89 minutes: 16
- 90 or more minutes: 0
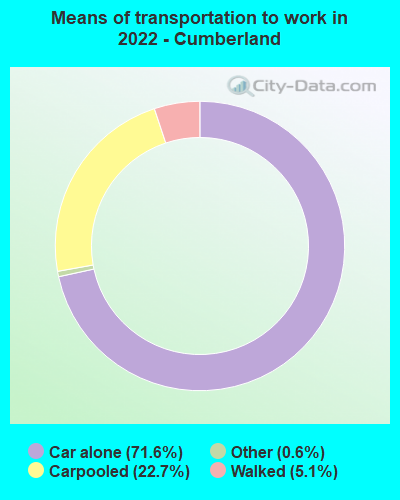
Means of transportation to work:
- Drove a car alone: 359 (64.6%)
- Carpooled: 125 (22.5%)
- Taxi: 3 (0.5%)
- Walked: 25 (4.5%)
- Worked at home: 46 (8.3%)
- Unemployment by race in 2022
- Unemployment rate for White non-Hispanic residents
- 37.9%Males
- 29.7%Females
- Unemployment rate for two or more race residents
- 100.0%Males
- 68.7%Females
- Unemployment rate for Hispanic or Latino residents
- 100.0%Females
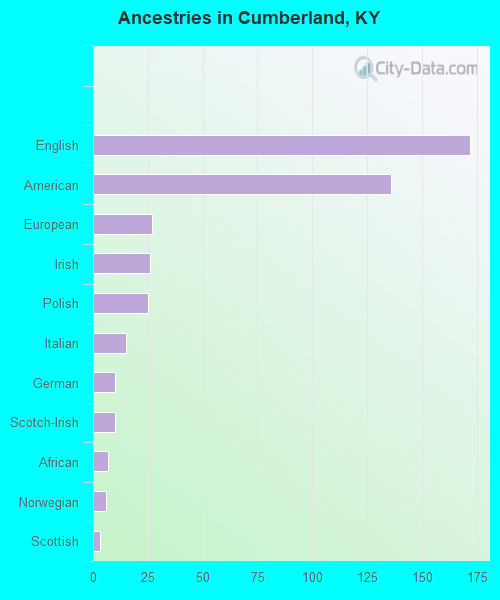
First ancestries reported:
- English: 172 (24.1%)
- American: 136 (19.1%)
- European: 27 (3.8%)
- Irish: 26 (3.6%)
- Polish: 25 (3.5%)
- Italian: 15 (2.1%)
- German: 10 (1.4%)
- Scotch-Irish: 10 (1.4%)
- African: 7 (1.0%)
- Norwegian: 6 (0.8%)
- Scottish: 3 (0.4%)
Most common places of birth for foreign-born residents (%):
| Cumberland: | 75.0% (3) |
| Kentucky: | 3.3% (6,109) |
Place of birth for U.S.-born residents:
- This state: 1,914
- Other state: 465
- Northeast: 10
- Midwest: 87
- South: 344
- West: 20
82.7% of Cumberland residents lived in the same house 1 years ago.
Out of people who lived in different houses, 41.4% lived in this county.
Out of people who lived in different counties, 63.6% lived in Kentucky.
| Cumberland: | 82.7% |
| State average: | 87.2% |
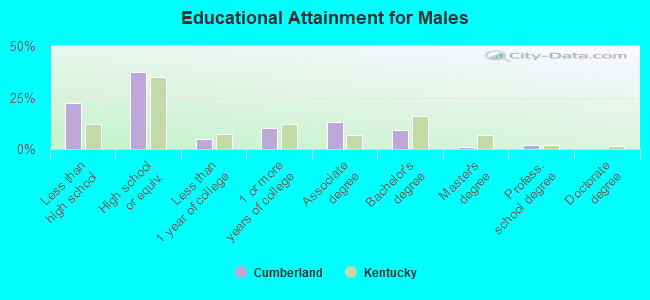
Education attainment for males 25 years and older:
- No schooling: 0
- Nursery to 4th grade: 3
- 5th and 6th grade: 16
- 7th and 8th grade: 6
- 9th grade: 40
- 10th grade: 24
- 11th grade: 41
- 12th grade, no diploma: 0
- High school graduate (or equivalency): 215
- Less than 1 year of college: 29
- Some college more than 1 year, no degree: 59
- Associate degree: 75
- Bachelor's degree: 53
- Master's degree: 7
- Professional school degree: 10
- Doctorate degree: 0
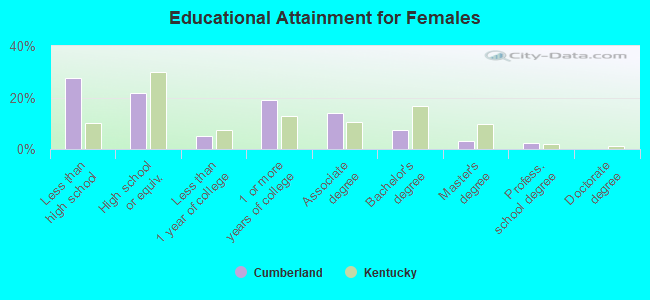
Education attainment for females 25 years and older:
- No schooling: 19
- Nursery to 4th grade: 3
- 5th and 6th grade: 0
- 7th and 8th grade: 128
- 9th grade: 35
- 10th grade: 8
- 11th grade: 25
- 12th grade, no diploma: 9
- High school graduate (or equivalency): 178
- Less than 1 year of college: 41
- Some college more than 1 year, no degree: 155
- Associate degree: 114
- Bachelor's degree: 62
- Master's degree: 25
- Professional school degree: 18
- Doctorate degree: 0


Housing units in structures:
- One, detached: 712
- One, attached: 31
- Two: 36
- 3 or 4: 39
- 5 to 9: 55
- 10 to 19: 17
- 20 to 49: 31
- Mobile homes: 160
Median worth of mobile homes: $70,508
Housing units lacking complete kitchen facilities in 2022: 4.5%
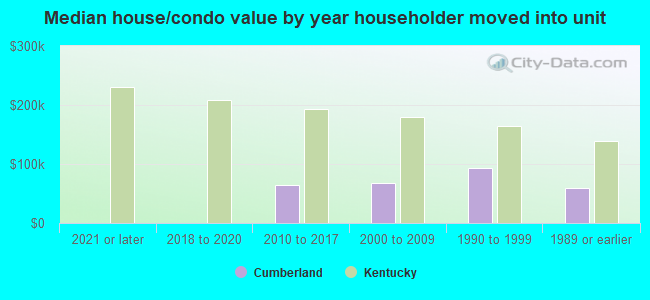
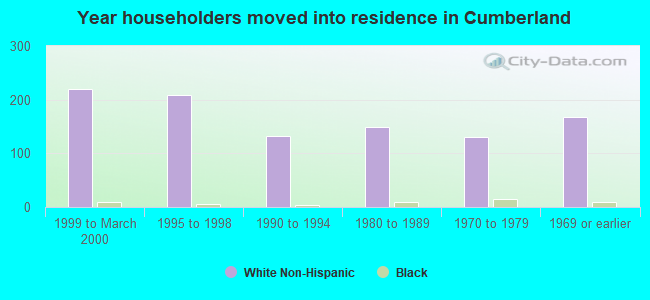
House/condo owner moved in on average 21 years ago
Renter moved in on average 1 years ago
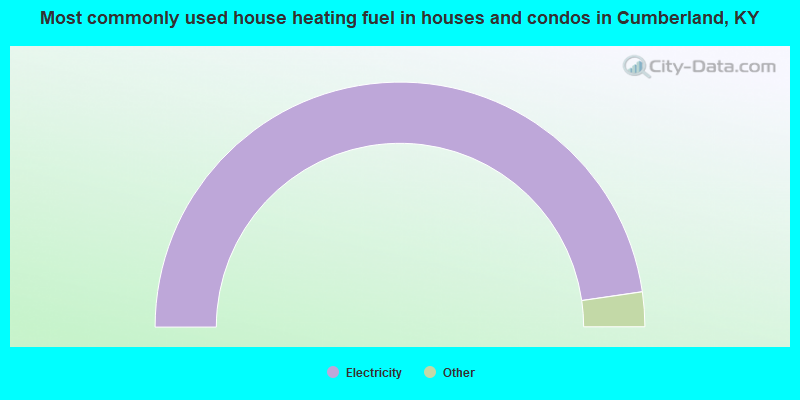
- 95.5%Electricity
- 2.2%Bottled, tank, or LP gas
- 1.4%Fuel oil, kerosene, etc.
- 1.0%No fuel used
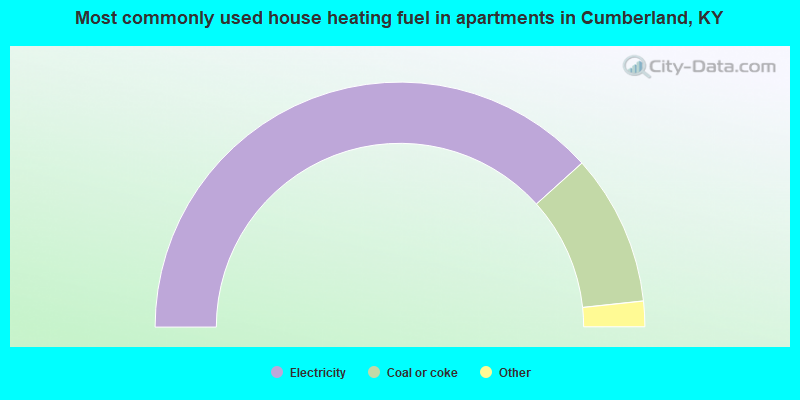
- 76.9%Electricity
- 20.0%Coal or coke
- 1.9%Utility gas
- 1.2%Bottled, tank, or LP gas
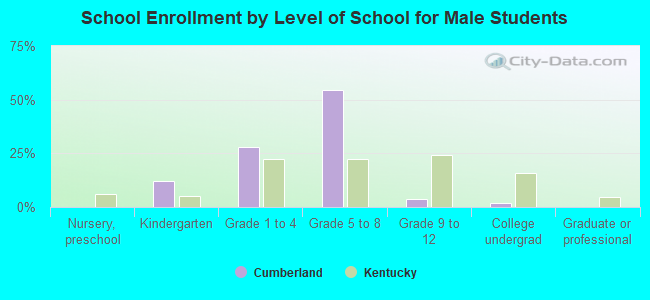
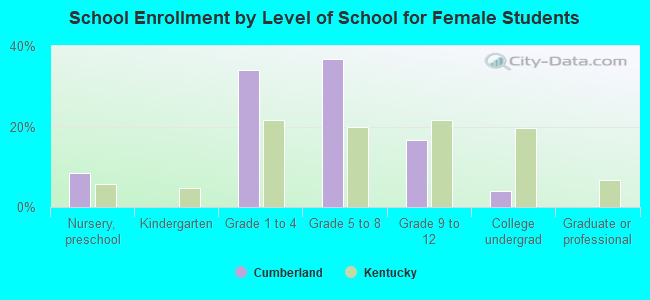
Private vs. public school enrollment:
| Here: | 1.6% |
| Kentucky: | 17.2% |
| Here: | 43.8% |
| Kentucky: | 15.2% |
| Here: | 0.0% |
| Kentucky: | 19.6% |