Dayton, OH (Ohio) Houses and Residents
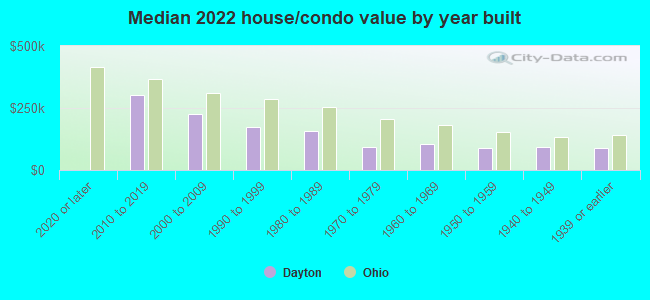
Estimated median house or condo value in 2022: $97,700 (it was $66,700 in 2000 )
Dayton:
$97,700Ohio:
$204,100
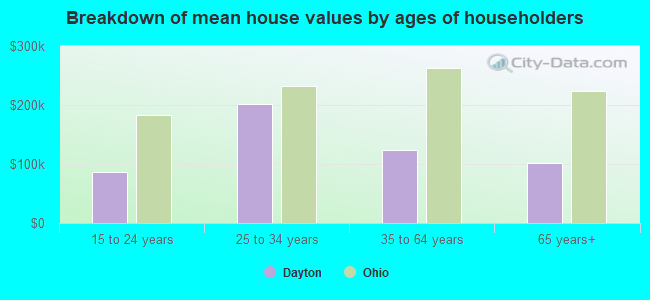
Lower value quartile - upper value quartile: $64,900 - $166,700Mean price in 2022: Detached houses: $118,555 Here:
$118,555State:
$254,366
Townhouses or other attached units: $161,663 Here:
$161,663State:
$225,733
In 2-unit structures: $98,242 Here:
$98,242State:
$144,384
In 3-to-4-unit structures: $163,520 Here:
$163,520State:
$203,002
In 5-or-more-unit structures: $187,975 Here:
$187,975State:
$211,593
Mobile homes: $18,721 Here:
$18,721State:
$62,719
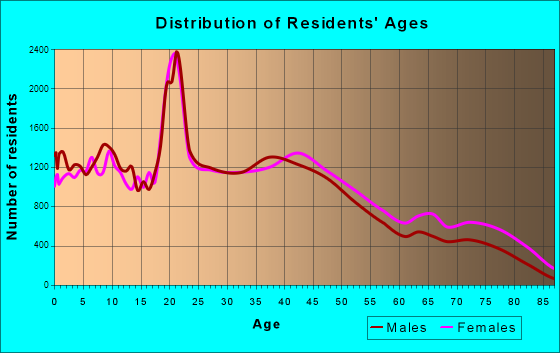
Total population: 141,003 (All urban)
Houses: 72,874 (63,308 occupied: 32,464 owner occupied, 30,844 renter occupied )
% of renters here:
49%State:
33%
Housing density: 1,307 houses/condos per square mile
Median price asked for vacant for-sale houses and condos in 2022: $99,503.
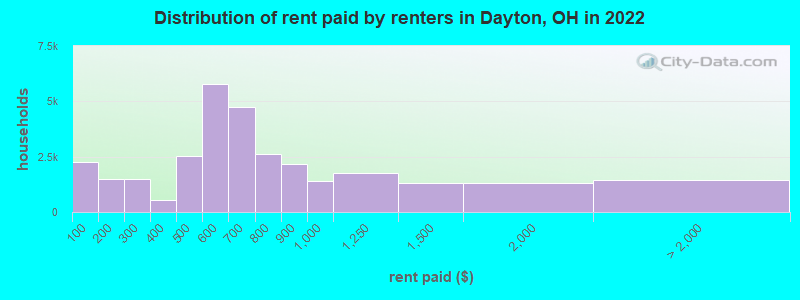
Median contract rent in 2022: $612 (lower quartile is $469, upper quartile is $838)
Median rent asked for vacant for-rent units in 2022: $358
Median gross rent in Dayton, OH in 2022: $824
Housing units in Dayton with a mortgage: 17,748 (1,413 second mortgage, 0 home equity loan, 1,083 both second mortgage and home equity loan )Houses without a mortgage: 1,061
Median household income for houses/condos with a mortgage: $75,236
Median household income for apartments without a mortgage: $49,058
Median monthly housing costs: $803
Data:
Median house or condo value ($)
Median house or condo value ($ change since 2000)
Median house or condo value ($) - White
Median house or condo value ($) - Black or African American
Median house or condo value ($) - Asian
Median house or condo value ($) - Hispanic or Latino
Median house or condo value ($) - American Indian and Alaska Native
Median house or condo value ($) - Multirace
Median house or condo value ($) - Other Race
Median price asked for mobile homes ($)
Household density (households per square mile)
Mean house or condo value by units in structure - 1, detached ($)
Mean house or condo value by units in structure - 1, attached ($)
Mean house or condo value by units in structure - 2 ($)
Mean house or condo value by units in structure by units in structure - 3 or 4 ($)
Mean house or condo value by units in structure - 5 or more ($)
Mean house or condo value by units in structure - Boat, RV, van, etc. ($)
Mean house or condo value by units in structure - Mobile home ($)
Median contract rent ($)
Median contract rent - Lower quartile ($)
Median contract rent - Upper quartile ($)
Median gross rent ($)
Urban houses (%)
Rural houses (%)
Houses occupied (%)
Houses occupied (% change since 2000)
Houses owner occupied (%)
Houses owner occupied (% change since 2000)
Houses renter occupied (%)
Houses renter occupied (% change since 2000)
Vacant housing units - For rent (%)
Vacant housing units - For rent (% change since 2000)
Vacant housing units - For sale only (%)
Vacant housing units - For sale only (% change since 2000)
Vacant housing units - Rented or sold, not occupied (%)
Vacant housing units - Rented or sold, not occupied (% change since 2000)
Vacant housing units - For seasonal, recreational, or occasional use (%)
Vacant housing units - For seasonal, recreational, or occasional use (% change since 2000)
Vacant housing units - For migrant workers (%)
Vacant housing units - For migrant workers (% change since 2000)
Vacant housing units - Other vacant (%)
Vacant housing units - Other vacant (% change since 2000)
Median monthly housing costs ($)
Median household income for houses/condos with a mortgage ($)
Median household income for houses/condos without a mortgage ($)
Median household income ($)
Median household income ($) - White
Median household income ($) - Black or African American
Median household income ($) - Asian
Median household income ($) - Hispanic or Latino
Median household income ($) - American Indian and Alaska Native
Median household income ($) - Multirace
Median household income ($) - Other Race
Mortgage status - with mortgage (%)
Mortgage status - with second mortgage (%)
Mortgage status - with home equity loan (%)
Mortgage status - with both second mortgage and home equity loan (%)
Mortgage status - without a mortgage (%)
Median year house/condo built
Median year apartment built
Household type by relationship - Male householder living alone (%)
Household type by relationship - Male householder not living alone (%)
Household type by relationship - Female householder living alone (%)
Household type by relationship - Female householder not living alone (%)
Household type by relationship - Opposite-Sex spouse (%)
Household type by relationship - Same-Sex spouse (%)
Household type by relationship - Opposite-Sex unmarried partner (%)
Household type by relationship - Same-Sex unmarried partner (%)
Household type by relationship - In group quarters (%)
Size of family households - 2-person household (%)
Size of family households - 3-person household (%)
Size of family households - 4-person household (%)
Size of family households - 5-person household (%)
Size of family households - 6-person household (%)
Size of family households - 7-or-more-person household (%)
Size of nonfamily households - 1-person household (%)
Size of nonfamily households - 2-person household (%)
Size of nonfamily households - 3-person household (%)
Size of nonfamily households - 4-person household (%)
Size of nonfamily households - 5-person household (%)
Size of nonfamily households - 6-person household (%)
Size of nonfamily households - 7-or-moreperson household (%)
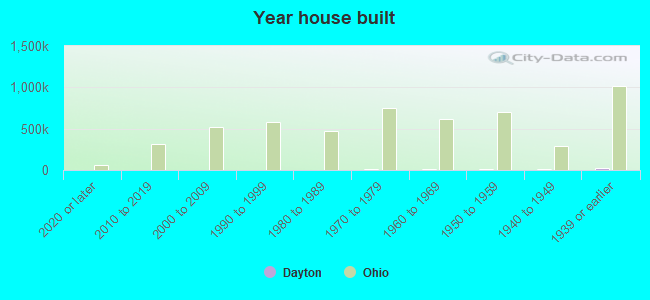
Year house built - Built 2010 or later (%)
Year house built - Built 2000 to 2009 (%)
Year house built - Built 1990 to 1999 (%)
Year house built - Built 1980 to 1989 (%)
Year house built - Built 1970 to 1979 (%)
Year house built - Built 1960 to 1969 (%)
Year house built - Built 1950 to 1959 (%)
Year house built - Built 1940 to 1949 (%)
Year house built - Built 1939 or earlier (%)
Median number of rooms in houses and condos
Median number of rooms in apartments
Median number of bedrooms in owner occupied houses
Mean number of bedrooms in owner occupied houses
Median number of bedrooms in renter occupied houses
Mean number of bedrooms in renter occupied houses
Median number of vehichles in owner occupied houses
Mean number of vehichles in owner occupied houses
Median number of vehichles in renter occupied houses
Mean number of vehichles in renter occupied houses
Rooms in owner-occupied houses - 1 room (%)
Rooms in owner-occupied houses - 2 rooms (%)
Rooms in owner-occupied houses - 3 rooms (%)
Rooms in owner-occupied houses - 4 rooms (%)
Rooms in owner-occupied houses - 5 rooms (%)
Rooms in owner-occupied houses - 6 rooms (%)
Rooms in owner-occupied houses - 7 rooms (%)
Rooms in owner-occupied houses - 8 rooms (%)
Rooms in owner-occupied houses - 9+ rooms (%)
Rooms in renter-occupied houses - 1 room (%)
Rooms in renter-occupied houses - 2 rooms (%)
Rooms in renter-occupied houses - 3 rooms (%)
Rooms in renter-occupied houses - 4 rooms (%)
Rooms in renter-occupied houses - 5 rooms (%)
Rooms in renter-occupied houses - 6 rooms (%)
Rooms in renter-occupied houses - 7 rooms (%)
Rooms in renter-occupied houses - 8 rooms (%)
Rooms in renter-occupied houses - 9+ rooms (%)
Bedrooms in owner-occupied houses - no bedrooms (%)
Bedrooms in owner-occupied houses - 1 bedroom (%)
Bedrooms in owner-occupied houses - 2 bedrooms (%)
Bedrooms in owner-occupied houses - 3 bedrooms (%)
Bedrooms in owner-occupied houses - 4 bedrooms (%)
Bedrooms in owner-occupied houses - 5+ bedrooms (%)
Bedrooms in renter-occupied houses - no bedrooms (%)
Bedrooms in renter-occupied houses - 1 bedroom (%)
Bedrooms in renter-occupied houses - 2 bedrooms (%)
Bedrooms in renter-occupied houses - 3 bedrooms (%)
Bedrooms in renter-occupied houses - 4 bedrooms (%)
Bedrooms in renter-occupied houses - 5+ bedrooms (%)
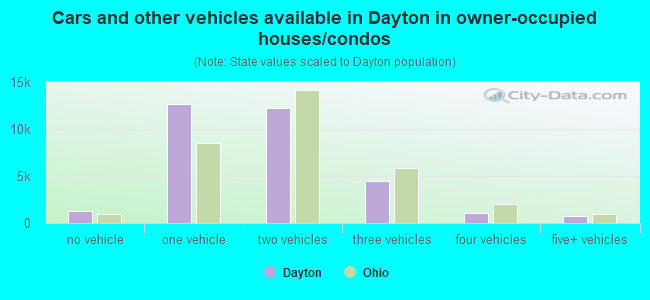
Vehicles available in owner-occupied houses - no vehicle available (%)
Vehicles available in owner-occupied houses - 1 vehicle available(%)
Vehicles available in owner-occupied houses - 2 Vehicles available (%)
Vehicles available in owner-occupied houses - 3 Vehicles available (%)
Vehicles available in owner-occupied houses - 4 Vehicles available (%)
Vehicles available in owner-occupied houses - 5+ Vehicles available (%)
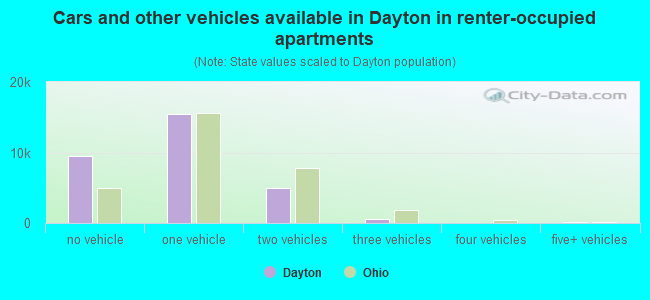
Vehicles available in renter-occupied houses - no vehicle available (%)
Vehicles available in renter-occupied houses - 1 vehicle available (%)
Vehicles available in renter-occupied houses - 2 Vehicles available (%)
Vehicles available in renter-occupied houses - 3 Vehicles available (%)
Vehicles available in renter-occupied houses - 4 Vehicles available (%)
Vehicles available in renter-occupied houses - 5+ Vehicles available (%)
Housing units in structures - 1, detached (%)
Housing units in structures - 1, attached (%)
Housing units in structures - 2 (%)
Housing units in structures - 3 or 4 (%)
Housing units in structures - 5 to 9 (%)
Housing units in structures - 10 to 19 (%)
Housing units in structures - 20 to 49 (%)
Housing units in structures - 50 or more (%)
Housing units in structures - Mobile home (%)
Housing units in structures - Boat, RV, van, etc. (%)
Housing units in structures - Owners - 1, detached (%)
Housing units in structures - Owners - 1, attached (%)
Housing units in structures - Owners - 2 (%)
Housing units in structures - Owners - 3 or 4 (%)
Housing units in structures - Owners - 5 to 9 (%)
Housing units in structures - Owners - 10 to 19 (%)
Housing units in structures - Owners - 20 to 49 (%)
Housing units in structures - Owners - 50 or more (%)
Housing units in structures - Owners - Mobile home (%)
Housing units in structures - Owners - Boat, RV, van, etc. (%)
Housing units in structures - Renters - 1, detached (%)
Housing units in structures - Renters - 1, attached (%)
Housing units in structures - Renters - 2 (%)
Housing units in structures - Renters - 3 or 4 (%)
Housing units in structures - Renters - 5 to 9 (%)
Housing units in structures - Renters - 10 to 19 (%)
Housing units in structures - Renters - 20 to 49 (%)
Housing units in structures - Renters - 50 or more (%)
Housing units in structures - Renters - Mobile home (%)
Housing units in structures - Renters - Boat, RV, van, etc. (%)
House/condo owner moved in on average (years ago)
Renter moved in on average (years ago)
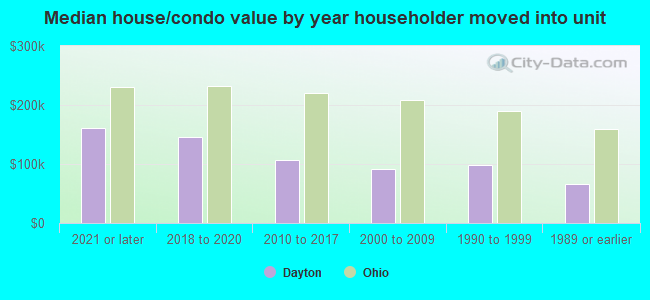
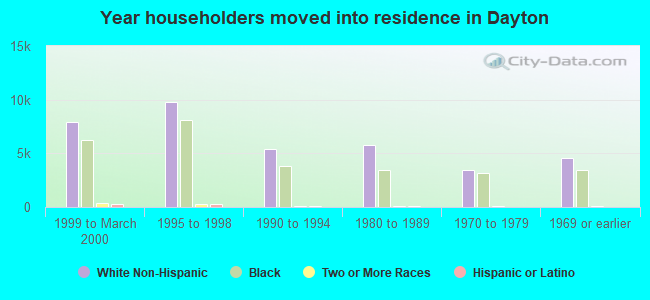
Year householder moved into unit - Moved in 1999 to March 2000 (%)
Year householder moved into unit - Moved in 1999 to March 2000 (%) - White
Year householder moved into unit - Moved in 1999 to March 2000 (%) - Black or African American
Year householder moved into unit - Moved in 1999 to March 2000 (%) - Asian
Year householder moved into unit - Moved in 1999 to March 2000 (%) - Hispanic or Latino
Year householder moved into unit - Moved in 1999 to March 2000 (%) - American Indian and Alaska Native
Year householder moved into unit - Moved in 1999 to March 2000 (%) - Multirace
Year householder moved into unit - Moved in 1999 to March 2000 (%) - Other Race
Year householder moved into unit - Moved in 1995 to 1998 (%)
Year householder moved into unit - Moved in 1995 to 1998 (%) - White
Year householder moved into unit - Moved in 1995 to 1998 (%) - Black or African American
Year householder moved into unit - Moved in 1995 to 1998 (%) - Asian
Year householder moved into unit - Moved in 1995 to 1998 (%) - Hispanic or Latino
Year householder moved into unit - Moved in 1995 to 1998 (%) - American Indian and Alaska Native
Year householder moved into unit - Moved in 1995 to 1998 (%) - Multirace
Year householder moved into unit - Moved in 1995 to 1998 (%) - Other Race
Year householder moved into unit - Moved in 1990 to 1994 (%)
Year householder moved into unit - Moved in 1990 to 1994 (%) - White
Year householder moved into unit - Moved in 1990 to 1994 (%) - Black or African American
Year householder moved into unit - Moved in 1990 to 1994 (%) - Asian
Year householder moved into unit - Moved in 1990 to 1994 (%) - Hispanic or Latino
Year householder moved into unit - Moved in 1990 to 1994 (%) - American Indian and Alaska Native
Year householder moved into unit - Moved in 1990 to 1994 (%) - Multirace
Year householder moved into unit - Moved in 1990 to 1994 (%) - Other Race
Year householder moved into unit - Moved in 1980 to 1989 (%)
Year householder moved into unit - Moved in 1980 to 1989 (%) - White
Year householder moved into unit - Moved in 1980 to 1989 (%) - Black or African American
Year householder moved into unit - Moved in 1980 to 1989 (%) - Asian
Year householder moved into unit - Moved in 1980 to 1989 (%) - Hispanic or Latino
Year householder moved into unit - Moved in 1980 to 1989 (%) - American Indian and Alaska Native
Year householder moved into unit - Moved in 1980 to 1989 (%) - Multirace
Year householder moved into unit - Moved in 1980 to 1989 (%) - Other Race
Year householder moved into unit - Moved in 1970 to 1979 (%)
Year householder moved into unit - Moved in 1970 to 1979 (%) - White
Year householder moved into unit - Moved in 1970 to 1979 (%) - Black or African American
Year householder moved into unit - Moved in 1970 to 1979 (%) - Asian
Year householder moved into unit - Moved in 1970 to 1979 (%) - Hispanic or Latino
Year householder moved into unit - Moved in 1970 to 1979 (%) - American Indian and Alaska Native
Year householder moved into unit - Moved in 1970 to 1979 (%) - Multirace
Year householder moved into unit - Moved in 1970 to 1979 (%) - Other Race
Year householder moved into unit - Moved in 1969 or earlier (%)
Year householder moved into unit - Moved in 1969 or earlier (%) - White
Year householder moved into unit - Moved in 1969 or earlier (%) - Black or African American
Year householder moved into unit - Moved in 1969 or earlier (%) - Asian
Year householder moved into unit - Moved in 1969 or earlier (%) - Hispanic or Latino
Year householder moved into unit - Moved in 1969 or earlier (%) - American Indian and Alaska Native
Year householder moved into unit - Moved in 1969 or earlier (%) - Multirace
Year householder moved into unit - Moved in 1969 or earlier (%) - Other Race
Housing units lacking complete plumbing facilities (%)
Housing units lacking complete kitchen facilities (%)
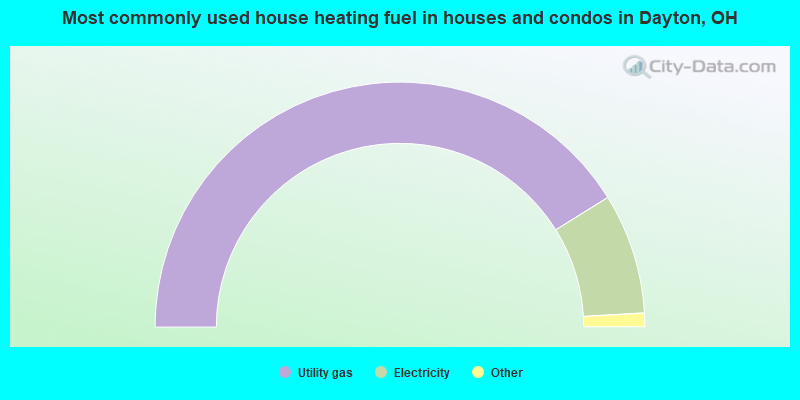
House heating fuel used in houses and condos - Utility gas (%)
House heating fuel used in houses and condos - Bottled, tank, or LP gas (%)
House heating fuel used in houses and condos - Electricity (%)
House heating fuel used in houses and condos - Fuel oil, kerosene, etc. (%)
House heating fuel used in houses and condos - Coal or coke (%)
House heating fuel used in houses and condos - Wood (%)
House heating fuel used in houses and condos - Solar energy (%)
House heating fuel used in houses and condos - Other fuel (%)
House heating fuel used in houses and condos - No fuel used (%)
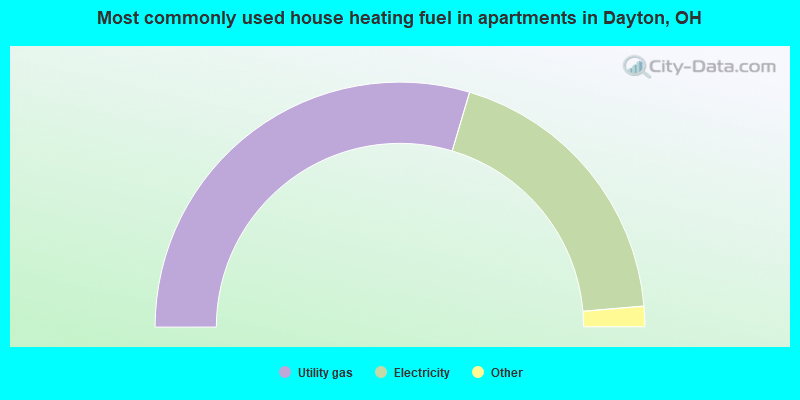
House heating fuel used in apartments - Utility gas (%)
House heating fuel used in apartments - Bottled, tank, or LP gas (%)
House heating fuel used in apartments - Electricity (%)
House heating fuel used in apartments - Fuel oil, kerosene, etc. (%)
House heating fuel used in apartments - Coal or coke (%)
House heating fuel used in apartments - Wood (%)
House heating fuel used in apartments - Solar energy (%)
House heating fuel used in apartments - Other fuel (%)
House heating fuel used in apartments - No fuel used (%)
Latest news about housing in Dayton, OH collected exclusively by city-data.com from local newspapers, TV, and radio stations
Median year house/condo built: 1946Median year apartment built: 1960Household type by relationship:
Households: 135,938
Male householders: 29,674 (16,279 living alone ), Female householders: 33,634 (13,736 living alone )15,755 spouses (15,457 opposite-sex spouses ), 3,908 unmarried partners , (3,799 opposite-sex unmarried partners ), 30,398 children (28,928 natural , 471 adopted , 999 stepchildren ), 3,460 grandchildren , 1,160 brothers or sisters , 759 parents , 113 foster children , 1,141 other relatives , 3,400 non-relatives In group quarters: 12,536
Size of family households: 13,284 2-persons , 7,293 3-persons , 4,026 4-persons , 2,964 5-persons , 902 6-persons , 298 7-or-more-persons .
Size of nonfamily households: 30,015 1-person , 3,577 2-persons , 528 3-persons , 136 4-persons , 166 5-persons , 119 7-or-more-persons .
9,312 married couples with children. single-parent households (987 men , 11,800 women ).
92.3% of residents of Dayton speak English at home. of residents speak Spanish at home (56% speak English very well , 20% speak English well , 16% speak English not well , 8% don't speak English at all ).of residents speak other Indo-European language at home (66% speak English very well , 23% speak English well , 9% speak English not well , 1% don't speak English at all ).of residents speak Asian or Pacific Island language at home (46% speak English very well , 26% speak English well , 24% speak English not well , 4% don't speak English at all ).of residents speak other language at home (59% speak English very well , 17% speak English well , 15% speak English not well , 9% don't speak English at all ).
Foreign born population: 5,168 (3.8%)of them are naturalized citizens )
Median number of rooms in houses and condos:
Median number of rooms in apartments
Owner-occupied Renter-occupied
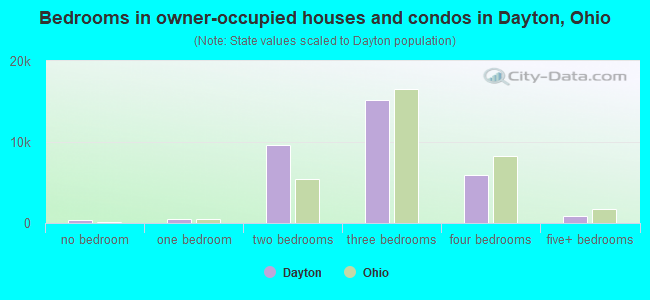
Bedrooms in owner-occupied houses and condos in Dayton, Ohio
403 no bedroom 508 1 bedroom 9,585 2 bedrooms 15,191 3 bedrooms 5,874 4 bedrooms 903 5+ bedrooms
Bedrooms in renter-occupied apartments in Dayton, Ohio
2,577 no bedroom 8,020 1 bedroom 10,105 2 bedrooms 7,652 3 bedrooms 2,109 4 bedrooms 381 5+ bedrooms
Owner-occupied Renter-occupied
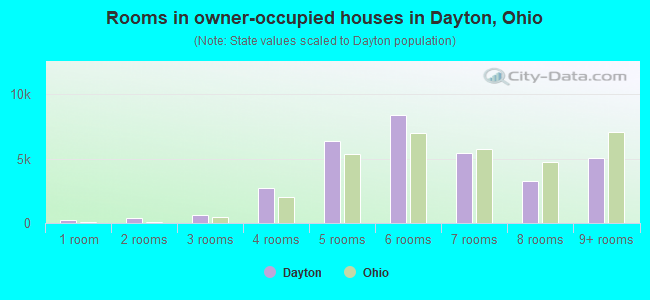
Rooms in owner-occupied houses in Dayton, Ohio
267 1 room 389 2 rooms 593 3 rooms 2,708 4 rooms 6,364 5 rooms 8,395 6 rooms 5,446 7 rooms 3,259 8 rooms 5,043 9+ rooms
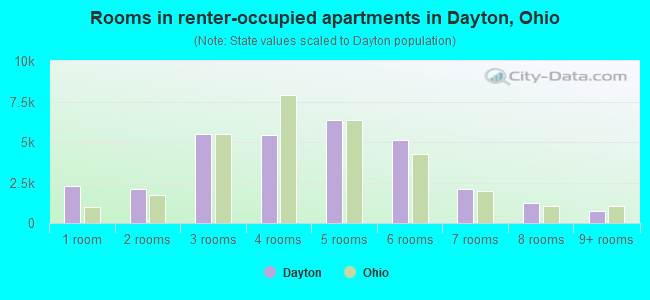
Rooms in renter-occupied apartments in Dayton, Ohio
2,267 1 room 2,102 2 rooms 5,523 3 rooms 5,410 4 rooms 6,360 5 rooms 5,134 6 rooms 2,118 7 rooms 1,213 8 rooms 717 9+ rooms
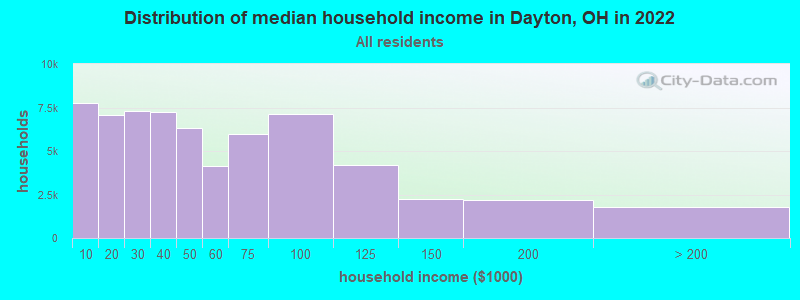
Dayton, OH household income distribution 7,768 Less than $10,0007,078 $10,000 to $19,9997,320 $20,000 to $29,9997,243 $30,000 to $39,9996,333 $40,000 to $49,9994,137 $50,000 to $59,9995,967 $60,000 to $74,9997,142 $75,000 to $99,9994,184 $100,000 to $124,9992,216 $125,000 to $149,9992,166 $150,000 to $199,9991,754 $200,000 or more
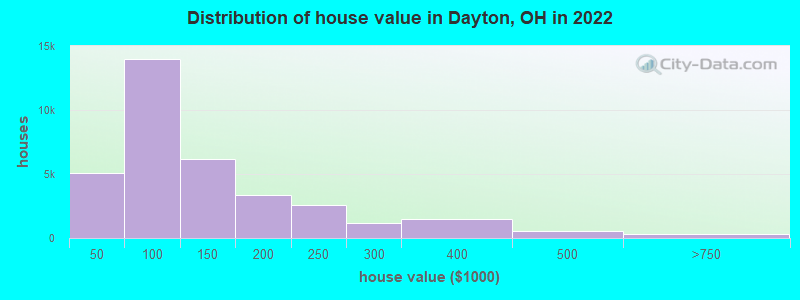
Home value of owner - occupied houses in 2022 in Dayton, OH 231 Less than $10,000280 $15,000 to $19,999554 $20,000 to $24,999287 $25,000 to $29,9991,257 $30,000 to $34,999303 $35,000 to $39,9992,128 $40,000 to $49,9991,609 $50,000 to $59,9993,007 $60,000 to $69,9992,589 $70,000 to $79,9991,733 $80,000 to $89,9992,934 $90,000 to $99,9994,379 $100,000 to $124,9991,783 $125,000 to $149,9991,902 $150,000 to $174,9991,476 $175,000 to $199,9992,561 $200,000 to $249,9991,167 $250,000 to $299,9991,451 $300,000 to $399,999557 $400,000 to $499,999245 $500,000 to $749,99931 $750,000 to $999,999Rent paid by renters in 2022 in Dayton, OH 2,273 Less than $100196 $100 to $1491,313 $150 to $199787 $200 to $249722 $250 to $299169 $300 to $349392 $350 to $3991,025 $400 to $4491,509 $450 to $4994,056 $500 to $5491,728 $550 to $5993,028 $600 to $6491,707 $650 to $699726 $700 to $7491,874 $750 to $7992,154 $800 to $8991,395 $900 to $9991,752 $1,000 to $1,2491,293 $1,250 to $1,4991,294 $1,500 to $1,99977 $2,000 to $2,499119 $2,500 to $2,999189 $3,500 or more1,066 No cash rent
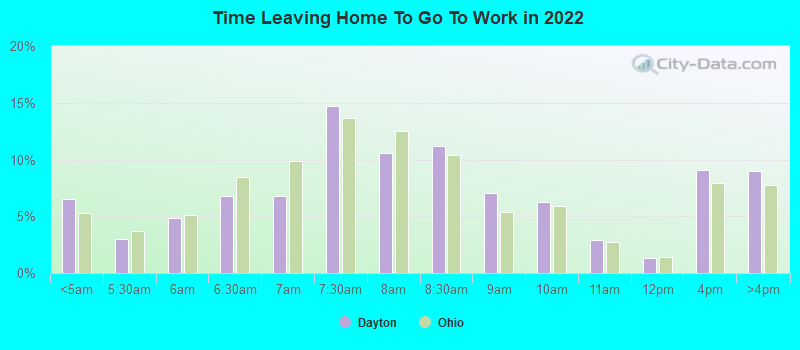
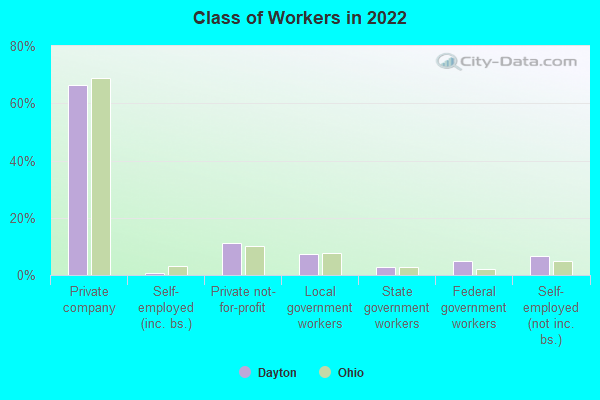
Percentage of workers working in this county: 78.6%Number of people working at home: 5,171 (8.5% of all workers )
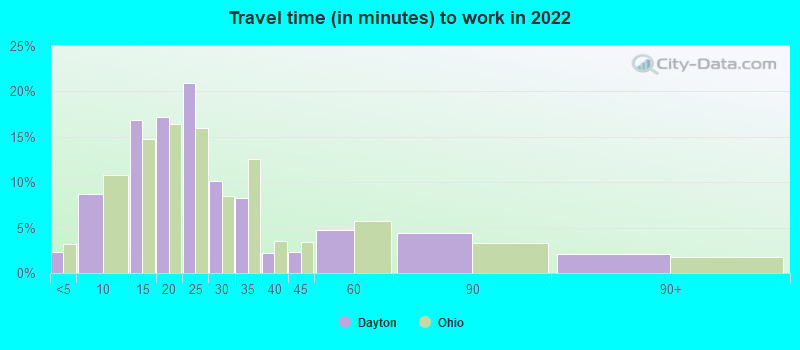
Travel time to work (commute)
Less than 5 minutes: 9565 to 9 minutes: 5,75810 to 14 minutes: 12,07615 to 19 minutes: 12,22320 to 24 minutes: 8,84825 to 29 minutes: 5,06430 to 34 minutes: 5,33035 to 39 minutes: 40640 to 44 minutes: 81645 to 59 minutes: 1,18160 to 89 minutes: 2,08190 or more minutes: 570
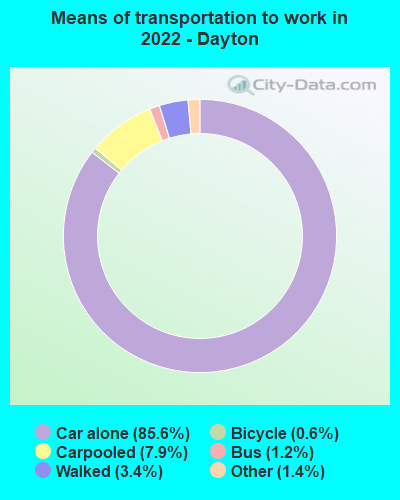
Means of transportation to work:
Drove a car alone: 67,698 (80.3%)Carpooled: 6,212 (7.4%)Bus : 939 (1.1%)Taxi: 1,092 (1.3%)Bicycle: 499 (0.6%)Walked: 2,660 (3.2%)Worked at home: 5,171 (6.1%)
Unemployment by race in 2022
Unemployment rate for White non-Hispanic residents 7.2% Males3.8% FemalesUnemployment rate for Black residents 13.5% Males11.5% FemalesUnemployment rate for American Indian and Alaska Native residents 18.3% Males54.3% FemalesUnemployment rate for Asian residents 11.2% Males0.8% FemalesUnemployment rate for other race residents 1.7% Males10.5% FemalesUnemployment rate for two or more race residents 10.3% Males25.7% FemalesUnemployment rate for Hispanic or Latino residents 4.3% Males17.1% Females
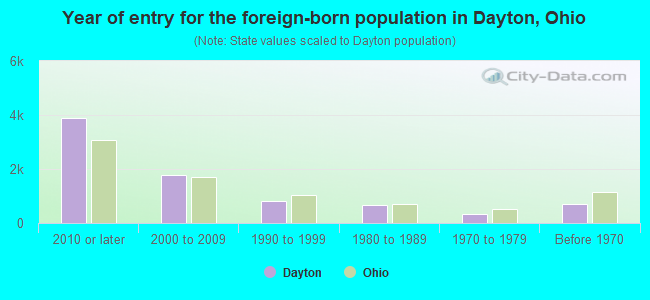
Year of entry for the foreign-born population in Dayton, Ohio
3,878 2010 or later 1,775 2000 to 2009 829 1990 to 1999 676 1980 to 1989 322 1970 to 1979 704 Before 1970
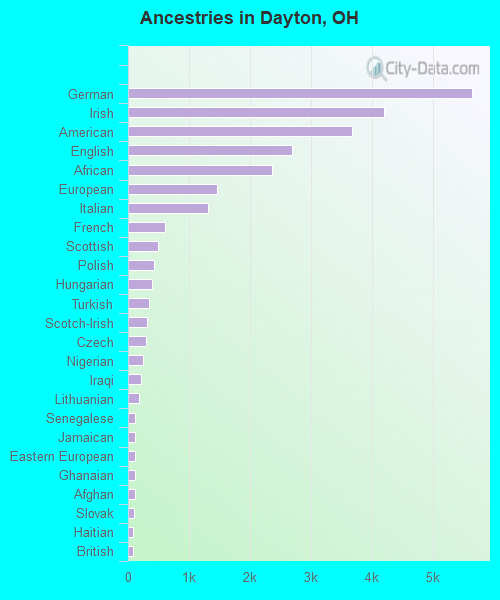
First ancestries reported:
German: 5,642 (7.7%)
Irish: 4,206 (5.7%)
American: 3,668 (5.0%)
English: 2,697 (3.7%)
African: 2,366 (3.2%)
European: 1,457 (2.0%)
Italian: 1,308 (1.8%)
French: 601 (0.8%)
Scottish: 486 (0.7%)
Polish: 425 (0.6%)
Hungarian: 399 (0.5%)
Turkish: 351 (0.5%)
Scotch-Irish: 313 (0.4%)
Czech: 300 (0.4%)
Nigerian: 242 (0.3%)
Iraqi: 212 (0.3%)
Lithuanian: 183 (0.2%)
Senegalese: 119 (0.2%)
Jamaican: 112 (0.2%)
Eastern European: 108 (0.1%)
Ghanaian: 108 (0.1%)
Afghan: 108 (0.1%)
Slovak: 98 (0.1%)
Haitian: 86 (0.1%)
British: 82 (0.1%)
Danish: 80 (0.1%)
Greek: 79 (0.1%)
Welsh: 75 (0.1%)
Norwegian: 72 (0.10%)
Arab: 63 (0.09%)
Croatian: 63 (0.09%)
Russian: 62 (0.08%)
Macedonian: 58 (0.08%)
Ethiopian: 53 (0.07%)
Portuguese: 48 (0.07%)
Swedish: 38 (0.05%)
Dutch: 36 (0.05%)
Lebanese: 32 (0.04%)
Bulgarian: 25 (0.03%)
Slovene: 23 (0.03%)
Brazilian: 22 (0.03%)
West Indian: 22 (0.03%)
Finnish: 20 (0.03%)
Scandinavian: 19 (0.03%)
French Canadian: 18 (0.02%)
Serbian: 15 (0.02%)
Iranian: 14 (0.02%)
Northern European: 13 (0.02%)
Yugoslavian: 13 (0.02%)
Swiss: 12 (0.02%)
Ukrainian: 12 (0.02%)
Austrian: 11 (0.01%)
Armenian: 9 (0.01%)
Moroccan: 9 (0.01%)
Slavic: 9 (0.01%)
Palestinian: 7 (0.01%)
Romanian: 6 (0.01%)
Pennsylvania German: 6 (0.01%)
Most common places of birth for foreign-born residents (%): Mexico Dayton:
17.3% (1,179)Ohio:
7.8% (44,796)
Sudan Dayton:
7.1% (486)Ohio:
0.3% (1,707)
Uzbekistan Dayton:
6.0% (410)Ohio:
0.7% (3,864)
India Dayton:
4.9% (334)Ohio:
11.6% (66,525)
Guatemala Dayton:
3.8% (261)Ohio:
1.6% (9,312)
Other Eastern Africa Dayton:
3.7% (254)Ohio:
0.5% (3,042)
China, excluding Hong Kong and Taiwan Dayton:
3.6% (244)Ohio:
6.2% (35,703)
Honduras Dayton:
3.4% (229)Ohio:
1.0% (5,553)
Dominican Republic Dayton:
3.2% (216)Ohio:
1.1% (6,549)
Democratic Republic of Congo (Zaire) Dayton:
3.2% (215)Ohio:
0.4% (2,154)
Vietnam Dayton:
3.0% (205)Ohio:
1.9% (10,960)
Iraq Dayton:
2.5% (173)Ohio:
0.6% (3,414)
Ivory Coast Dayton:
2.4% (162)Ohio:
0.3% (1,682)
Nigeria Dayton:
2.3% (158)Ohio:
1.2% (7,029)
Ecuador Dayton:
2.3% (156)Ohio:
0.3% (1,918)
Russia Dayton:
2.1% (140)Ohio:
1.5% (8,452)
Singapore Dayton:
1.9% (129)Ohio:
0.1% (549)
El Salvador Dayton:
1.9% (129)Ohio:
1.4% (7,947)
Cameroon Dayton:
1.7% (115)Ohio:
0.5% (2,773)
Afghanistan Dayton:
1.5% (104)Ohio:
0.2% (1,151)
Senegal Dayton:
1.5% (103)Ohio:
0.5% (3,061)
Place of birth for U.S.-born residents:
This state: 92,486Other state: 35,925Northeast: 6,264Midwest: 8,810South: 16,143West: 4,708 77.3% of Dayton residents lived in the same house 1 years ago.
Out of people who lived in different houses, 32.8% lived in this county.
Out of people who lived in different counties, 54.6% lived in Ohio.
Dayton:
77.3%State average:
87.8%
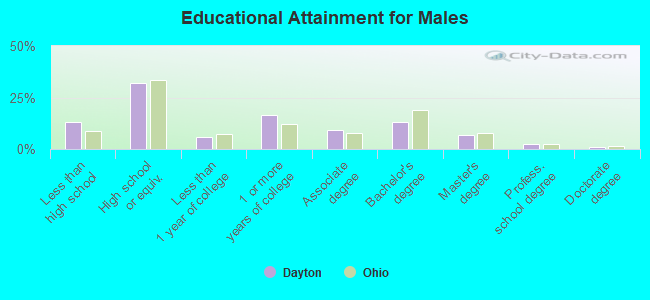
Education attainment for males 25 years and older:
No schooling: 749Nursery to 4th grade: 755th and 6th grade: 2827th and 8th grade: 6659th grade: 33210th grade: 1,72511th grade: 1,08612th grade, no diploma: 1,110High school graduate (or equivalency): 14,500Less than 1 year of college: 2,666Some college more than 1 year, no degree: 7,499Associate degree: 4,074Bachelor's degree: 5,893Master's degree: 2,984Professional school degree: 1,200Doctorate degree: 489
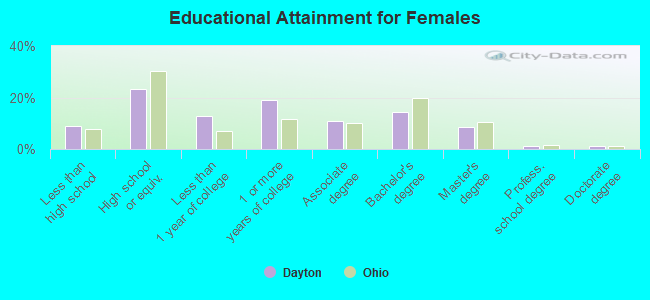
Education attainment for females 25 years and older:
No schooling: 391Nursery to 4th grade: 975th and 6th grade: 4787th and 8th grade: 5149th grade: 37710th grade: 1,02511th grade: 70212th grade, no diploma: 667High school graduate (or equivalency): 11,281Less than 1 year of college: 6,202Some college more than 1 year, no degree: 9,185Associate degree: 5,262Bachelor's degree: 7,034Master's degree: 4,175Professional school degree: 542Doctorate degree: 542
Housing units in structures:
One, detached: 47,490One, attached: 5,874Two: 1,5763 or 4: 4,0605 to 9: 4,42510 to 19: 2,12220 to 49: 1,78150 or more: 4,867Mobile homes: 679Median worth of mobile homes: $27,000
Housing units lacking complete plumbing facilities in 2022: 9.6%Housing units lacking complete kitchen facilities in 2022: 4.1%House/condo owner moved in on average 14 years ago
Renter moved in on average 3 years ago
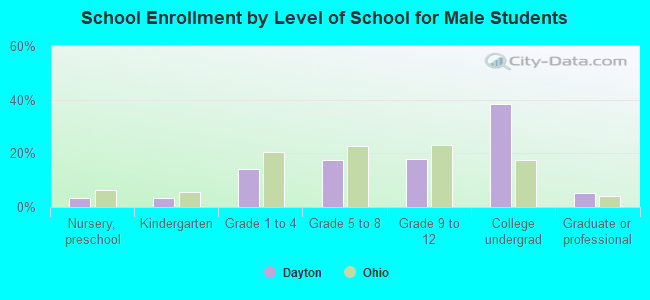
Private vs. public school enrollment:
Students in private schools in grades 1 to 8 (elementary and middle school): 3,200 Students in private schools in grades 9 to 12 (high school): 1,138 Students in private undergraduate colleges: 8,884