East Hemet, CA (California) Houses and Residents
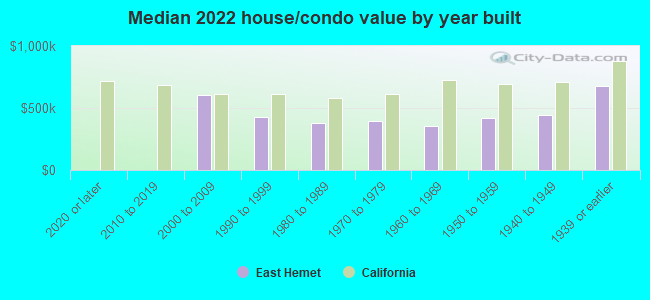
Estimated median house or condo value in 2022: $398,823 (it was $98,700 in 2000 )
East Hemet:
$398,823California:
$715,900
Lower value quartile - upper value quartile: $330,757 - $450,062Total population: 17,418 (Urban population: 14,718, Rural population: 0)
Houses: 6,044 (5,754 occupied: 3,678 owner occupied, 2,114 renter occupied )
% of renters here:
36%State:
44%
Housing density: 1,875 houses/condos per square mile
Median price asked for vacant for-sale houses and condos in 2022: $444,450.
Median contract rent in 2022: $1,296 (lower quartile is $1,010, upper quartile is $1,658)
Median rent asked for vacant for-rent units in 2022: $4,218
Median gross rent in East Hemet, CA in 2022: $1,564
Housing units in East Hemet with a mortgage: 2,624 (150 second mortgage, 0 home equity loan, 57 both second mortgage and home equity loan )Houses without a mortgage: 7
Median household income for houses/condos with a mortgage: $95,460
Median household income for apartments without a mortgage: $81,085
Median monthly housing costs: $1,548
Data:
Median house or condo value ($)
Median house or condo value ($ change since 2000)
Median house or condo value ($) - White
Median house or condo value ($) - Black or African American
Median house or condo value ($) - Asian
Median house or condo value ($) - Hispanic or Latino
Median house or condo value ($) - American Indian and Alaska Native
Median house or condo value ($) - Multirace
Median house or condo value ($) - Other Race
Median price asked for mobile homes ($)
Household density (households per square mile)
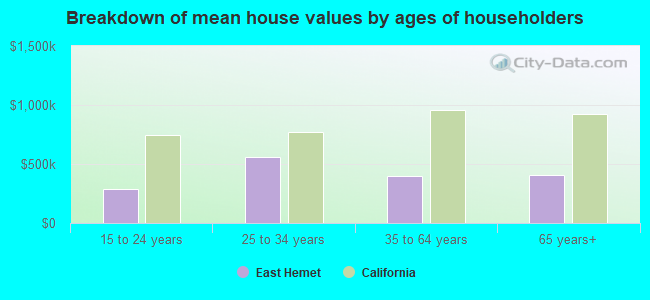
Mean house or condo value by units in structure - 1, detached ($)
Mean house or condo value by units in structure - 1, attached ($)
Mean house or condo value by units in structure - 2 ($)
Mean house or condo value by units in structure by units in structure - 3 or 4 ($)
Mean house or condo value by units in structure - 5 or more ($)
Mean house or condo value by units in structure - Boat, RV, van, etc. ($)
Mean house or condo value by units in structure - Mobile home ($)
Median contract rent ($)
Median contract rent - Lower quartile ($)
Median contract rent - Upper quartile ($)
Median gross rent ($)
Urban houses (%)
Rural houses (%)
Houses occupied (%)
Houses occupied (% change since 2000)
Houses owner occupied (%)
Houses owner occupied (% change since 2000)
Houses renter occupied (%)
Houses renter occupied (% change since 2000)
Vacant housing units - For rent (%)
Vacant housing units - For rent (% change since 2000)
Vacant housing units - For sale only (%)
Vacant housing units - For sale only (% change since 2000)
Vacant housing units - Rented or sold, not occupied (%)
Vacant housing units - Rented or sold, not occupied (% change since 2000)
Vacant housing units - For seasonal, recreational, or occasional use (%)
Vacant housing units - For seasonal, recreational, or occasional use (% change since 2000)
Vacant housing units - For migrant workers (%)
Vacant housing units - For migrant workers (% change since 2000)
Vacant housing units - Other vacant (%)
Vacant housing units - Other vacant (% change since 2000)
Median monthly housing costs ($)
Median household income for houses/condos with a mortgage ($)
Median household income for houses/condos without a mortgage ($)
Median household income ($)
Median household income ($) - White
Median household income ($) - Black or African American
Median household income ($) - Asian
Median household income ($) - Hispanic or Latino
Median household income ($) - American Indian and Alaska Native
Median household income ($) - Multirace
Median household income ($) - Other Race
Mortgage status - with mortgage (%)
Mortgage status - with second mortgage (%)
Mortgage status - with home equity loan (%)
Mortgage status - with both second mortgage and home equity loan (%)
Mortgage status - without a mortgage (%)
Median year house/condo built
Median year apartment built
Household type by relationship - Male householder living alone (%)
Household type by relationship - Male householder not living alone (%)
Household type by relationship - Female householder living alone (%)
Household type by relationship - Female householder not living alone (%)
Household type by relationship - Opposite-Sex spouse (%)
Household type by relationship - Same-Sex spouse (%)
Household type by relationship - Opposite-Sex unmarried partner (%)
Household type by relationship - Same-Sex unmarried partner (%)
Household type by relationship - In group quarters (%)
Size of family households - 2-person household (%)
Size of family households - 3-person household (%)
Size of family households - 4-person household (%)
Size of family households - 5-person household (%)
Size of family households - 6-person household (%)
Size of family households - 7-or-more-person household (%)
Size of nonfamily households - 1-person household (%)
Size of nonfamily households - 2-person household (%)
Size of nonfamily households - 3-person household (%)
Size of nonfamily households - 4-person household (%)
Size of nonfamily households - 5-person household (%)
Size of nonfamily households - 6-person household (%)
Size of nonfamily households - 7-or-moreperson household (%)
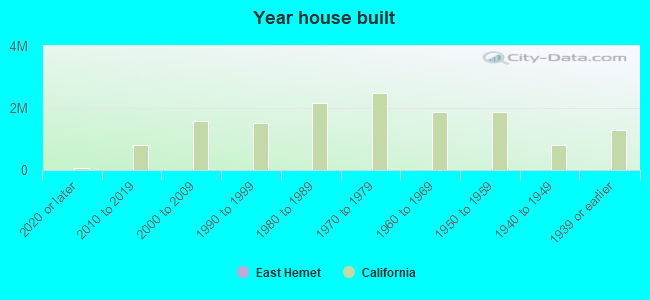
Year house built - Built 2010 or later (%)
Year house built - Built 2000 to 2009 (%)
Year house built - Built 1990 to 1999 (%)
Year house built - Built 1980 to 1989 (%)
Year house built - Built 1970 to 1979 (%)
Year house built - Built 1960 to 1969 (%)
Year house built - Built 1950 to 1959 (%)
Year house built - Built 1940 to 1949 (%)
Year house built - Built 1939 or earlier (%)
Median number of rooms in houses and condos
Median number of rooms in apartments
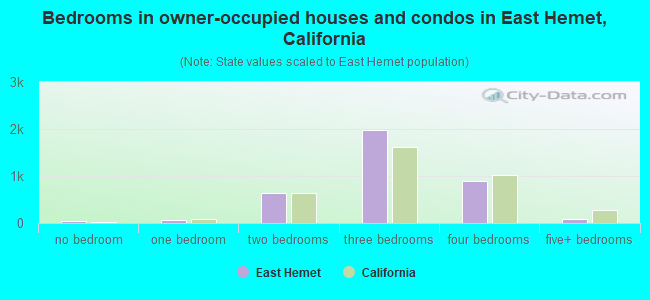
Median number of bedrooms in owner occupied houses
Mean number of bedrooms in owner occupied houses
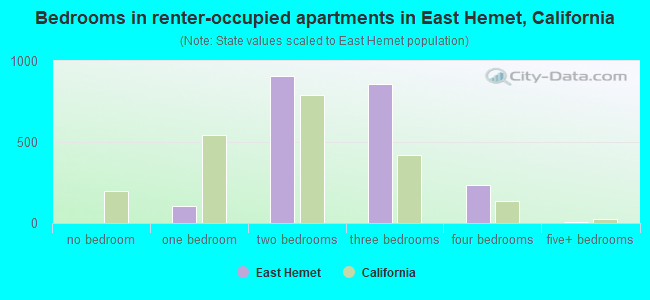
Median number of bedrooms in renter occupied houses
Mean number of bedrooms in renter occupied houses
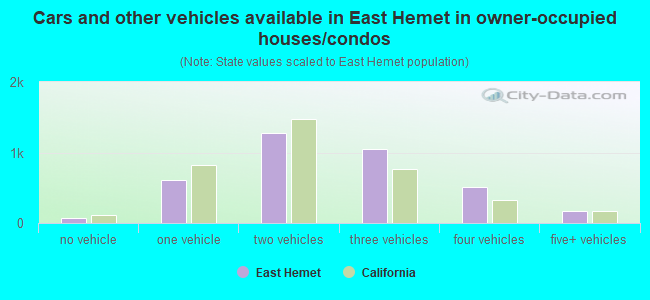
Median number of vehichles in owner occupied houses
Mean number of vehichles in owner occupied houses
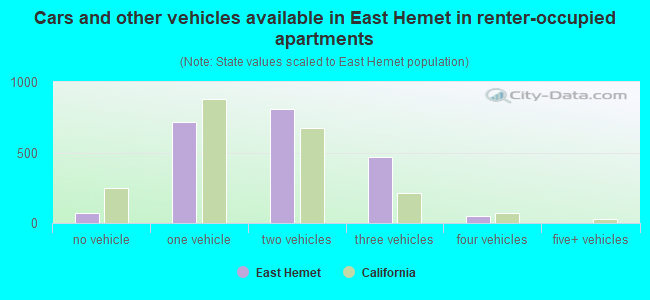
Median number of vehichles in renter occupied houses
Mean number of vehichles in renter occupied houses
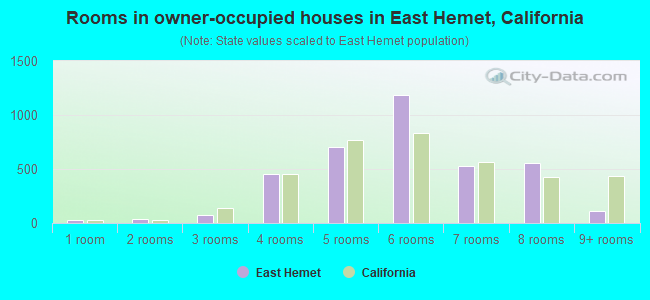
Rooms in owner-occupied houses - 1 room (%)
Rooms in owner-occupied houses - 2 rooms (%)
Rooms in owner-occupied houses - 3 rooms (%)
Rooms in owner-occupied houses - 4 rooms (%)
Rooms in owner-occupied houses - 5 rooms (%)
Rooms in owner-occupied houses - 6 rooms (%)
Rooms in owner-occupied houses - 7 rooms (%)
Rooms in owner-occupied houses - 8 rooms (%)
Rooms in owner-occupied houses - 9+ rooms (%)
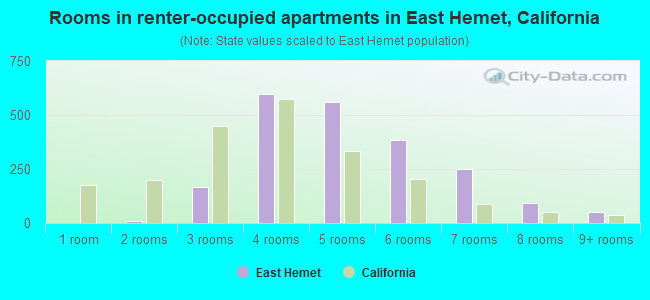
Rooms in renter-occupied houses - 1 room (%)
Rooms in renter-occupied houses - 2 rooms (%)
Rooms in renter-occupied houses - 3 rooms (%)
Rooms in renter-occupied houses - 4 rooms (%)
Rooms in renter-occupied houses - 5 rooms (%)
Rooms in renter-occupied houses - 6 rooms (%)
Rooms in renter-occupied houses - 7 rooms (%)
Rooms in renter-occupied houses - 8 rooms (%)
Rooms in renter-occupied houses - 9+ rooms (%)
Bedrooms in owner-occupied houses - no bedrooms (%)
Bedrooms in owner-occupied houses - 1 bedroom (%)
Bedrooms in owner-occupied houses - 2 bedrooms (%)
Bedrooms in owner-occupied houses - 3 bedrooms (%)
Bedrooms in owner-occupied houses - 4 bedrooms (%)
Bedrooms in owner-occupied houses - 5+ bedrooms (%)
Bedrooms in renter-occupied houses - no bedrooms (%)
Bedrooms in renter-occupied houses - 1 bedroom (%)
Bedrooms in renter-occupied houses - 2 bedrooms (%)
Bedrooms in renter-occupied houses - 3 bedrooms (%)
Bedrooms in renter-occupied houses - 4 bedrooms (%)
Bedrooms in renter-occupied houses - 5+ bedrooms (%)
Vehicles available in owner-occupied houses - no vehicle available (%)
Vehicles available in owner-occupied houses - 1 vehicle available(%)
Vehicles available in owner-occupied houses - 2 Vehicles available (%)
Vehicles available in owner-occupied houses - 3 Vehicles available (%)
Vehicles available in owner-occupied houses - 4 Vehicles available (%)
Vehicles available in owner-occupied houses - 5+ Vehicles available (%)
Vehicles available in renter-occupied houses - no vehicle available (%)
Vehicles available in renter-occupied houses - 1 vehicle available (%)
Vehicles available in renter-occupied houses - 2 Vehicles available (%)
Vehicles available in renter-occupied houses - 3 Vehicles available (%)
Vehicles available in renter-occupied houses - 4 Vehicles available (%)
Vehicles available in renter-occupied houses - 5+ Vehicles available (%)
Housing units in structures - 1, detached (%)
Housing units in structures - 1, attached (%)
Housing units in structures - 2 (%)
Housing units in structures - 3 or 4 (%)
Housing units in structures - 5 to 9 (%)
Housing units in structures - 10 to 19 (%)
Housing units in structures - 20 to 49 (%)
Housing units in structures - 50 or more (%)
Housing units in structures - Mobile home (%)
Housing units in structures - Boat, RV, van, etc. (%)
Housing units in structures - Owners - 1, detached (%)
Housing units in structures - Owners - 1, attached (%)
Housing units in structures - Owners - 2 (%)
Housing units in structures - Owners - 3 or 4 (%)
Housing units in structures - Owners - 5 to 9 (%)
Housing units in structures - Owners - 10 to 19 (%)
Housing units in structures - Owners - 20 to 49 (%)
Housing units in structures - Owners - 50 or more (%)
Housing units in structures - Owners - Mobile home (%)
Housing units in structures - Owners - Boat, RV, van, etc. (%)
Housing units in structures - Renters - 1, detached (%)
Housing units in structures - Renters - 1, attached (%)
Housing units in structures - Renters - 2 (%)
Housing units in structures - Renters - 3 or 4 (%)
Housing units in structures - Renters - 5 to 9 (%)
Housing units in structures - Renters - 10 to 19 (%)
Housing units in structures - Renters - 20 to 49 (%)
Housing units in structures - Renters - 50 or more (%)
Housing units in structures - Renters - Mobile home (%)
Housing units in structures - Renters - Boat, RV, van, etc. (%)
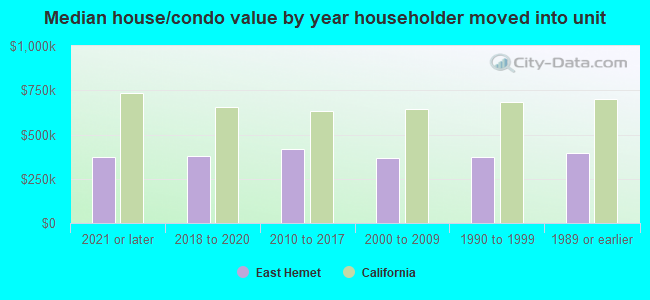
House/condo owner moved in on average (years ago)
Renter moved in on average (years ago)
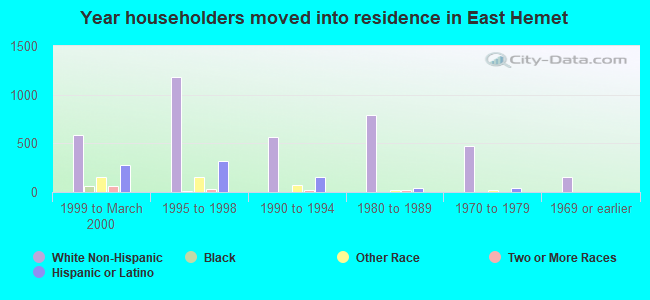
Year householder moved into unit - Moved in 1999 to March 2000 (%)
Year householder moved into unit - Moved in 1999 to March 2000 (%) - White
Year householder moved into unit - Moved in 1999 to March 2000 (%) - Black or African American
Year householder moved into unit - Moved in 1999 to March 2000 (%) - Asian
Year householder moved into unit - Moved in 1999 to March 2000 (%) - Hispanic or Latino
Year householder moved into unit - Moved in 1999 to March 2000 (%) - American Indian and Alaska Native
Year householder moved into unit - Moved in 1999 to March 2000 (%) - Multirace
Year householder moved into unit - Moved in 1999 to March 2000 (%) - Other Race
Year householder moved into unit - Moved in 1995 to 1998 (%)
Year householder moved into unit - Moved in 1995 to 1998 (%) - White
Year householder moved into unit - Moved in 1995 to 1998 (%) - Black or African American
Year householder moved into unit - Moved in 1995 to 1998 (%) - Asian
Year householder moved into unit - Moved in 1995 to 1998 (%) - Hispanic or Latino
Year householder moved into unit - Moved in 1995 to 1998 (%) - American Indian and Alaska Native
Year householder moved into unit - Moved in 1995 to 1998 (%) - Multirace
Year householder moved into unit - Moved in 1995 to 1998 (%) - Other Race
Year householder moved into unit - Moved in 1990 to 1994 (%)
Year householder moved into unit - Moved in 1990 to 1994 (%) - White
Year householder moved into unit - Moved in 1990 to 1994 (%) - Black or African American
Year householder moved into unit - Moved in 1990 to 1994 (%) - Asian
Year householder moved into unit - Moved in 1990 to 1994 (%) - Hispanic or Latino
Year householder moved into unit - Moved in 1990 to 1994 (%) - American Indian and Alaska Native
Year householder moved into unit - Moved in 1990 to 1994 (%) - Multirace
Year householder moved into unit - Moved in 1990 to 1994 (%) - Other Race
Year householder moved into unit - Moved in 1980 to 1989 (%)
Year householder moved into unit - Moved in 1980 to 1989 (%) - White
Year householder moved into unit - Moved in 1980 to 1989 (%) - Black or African American
Year householder moved into unit - Moved in 1980 to 1989 (%) - Asian
Year householder moved into unit - Moved in 1980 to 1989 (%) - Hispanic or Latino
Year householder moved into unit - Moved in 1980 to 1989 (%) - American Indian and Alaska Native
Year householder moved into unit - Moved in 1980 to 1989 (%) - Multirace
Year householder moved into unit - Moved in 1980 to 1989 (%) - Other Race
Year householder moved into unit - Moved in 1970 to 1979 (%)
Year householder moved into unit - Moved in 1970 to 1979 (%) - White
Year householder moved into unit - Moved in 1970 to 1979 (%) - Black or African American
Year householder moved into unit - Moved in 1970 to 1979 (%) - Asian
Year householder moved into unit - Moved in 1970 to 1979 (%) - Hispanic or Latino
Year householder moved into unit - Moved in 1970 to 1979 (%) - American Indian and Alaska Native
Year householder moved into unit - Moved in 1970 to 1979 (%) - Multirace
Year householder moved into unit - Moved in 1970 to 1979 (%) - Other Race
Year householder moved into unit - Moved in 1969 or earlier (%)
Year householder moved into unit - Moved in 1969 or earlier (%) - White
Year householder moved into unit - Moved in 1969 or earlier (%) - Black or African American
Year householder moved into unit - Moved in 1969 or earlier (%) - Asian
Year householder moved into unit - Moved in 1969 or earlier (%) - Hispanic or Latino
Year householder moved into unit - Moved in 1969 or earlier (%) - American Indian and Alaska Native
Year householder moved into unit - Moved in 1969 or earlier (%) - Multirace
Year householder moved into unit - Moved in 1969 or earlier (%) - Other Race
Housing units lacking complete plumbing facilities (%)
Housing units lacking complete kitchen facilities (%)
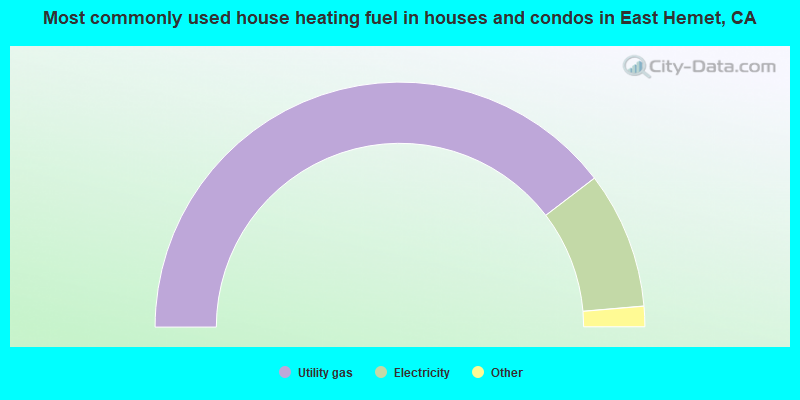
House heating fuel used in houses and condos - Utility gas (%)
House heating fuel used in houses and condos - Bottled, tank, or LP gas (%)
House heating fuel used in houses and condos - Electricity (%)
House heating fuel used in houses and condos - Fuel oil, kerosene, etc. (%)
House heating fuel used in houses and condos - Coal or coke (%)
House heating fuel used in houses and condos - Wood (%)
House heating fuel used in houses and condos - Solar energy (%)
House heating fuel used in houses and condos - Other fuel (%)
House heating fuel used in houses and condos - No fuel used (%)
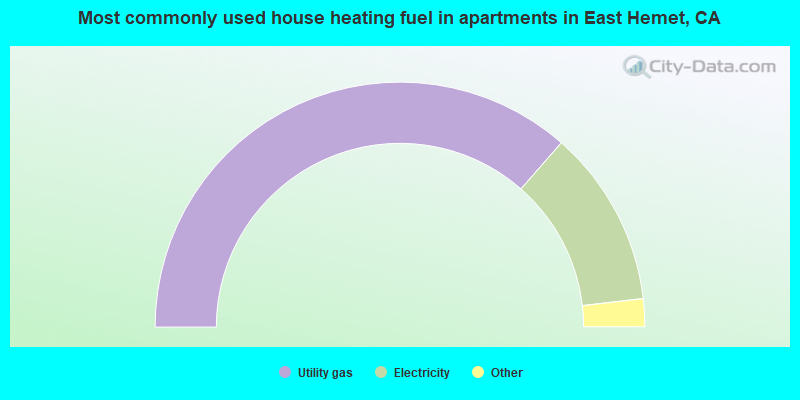
House heating fuel used in apartments - Utility gas (%)
House heating fuel used in apartments - Bottled, tank, or LP gas (%)
House heating fuel used in apartments - Electricity (%)
House heating fuel used in apartments - Fuel oil, kerosene, etc. (%)
House heating fuel used in apartments - Coal or coke (%)
House heating fuel used in apartments - Wood (%)
House heating fuel used in apartments - Solar energy (%)
House heating fuel used in apartments - Other fuel (%)
House heating fuel used in apartments - No fuel used (%)
Median year house/condo built: 1973Median year apartment built: 1977Household type by relationship:
Households: 20,631
Male householders: 2,831 (394 living alone ), Female householders: 2,917 (330 living alone )3,199 spouses (3,187 opposite-sex spouses ), 541 unmarried partners , (532 opposite-sex unmarried partners ), 8,075 children (7,648 natural , 157 adopted , 269 stepchildren ), 730 grandchildren , 263 brothers or sisters , 515 parents , 25 foster children , 685 other relatives , 715 non-relatives In group quarters: 129
Size of family households: 1,209 2-persons , 1,266 3-persons , 1,173 4-persons , 474 5-persons , 386 6-persons , 256 7-or-more-persons .
Size of nonfamily households: 702 1-person , 203 2-persons , 113 3-persons , 7 4-persons , 5 5-persons .
3,285 married couples with children. single-parent households (281 men , 1,451 women ).
63.4% of residents of East Hemet speak English at home. of residents speak Spanish at home (61% speak English very well , 22% speak English well , 13% speak English not well , 4% don't speak English at all ).of residents speak other Indo-European language at home (73% speak English very well , 14% speak English well , 8% speak English not well , 5% don't speak English at all ).of residents speak Asian or Pacific Island language at home (53% speak English very well , 32% speak English well , 10% speak English not well , 4% don't speak English at all ).of residents speak other language at home (95% speak English very well , 5% speak English well ).
Foreign born population: 3,636 (17.6%)of them are naturalized citizens )
Median number of rooms in houses and condos:
Median number of rooms in apartments
East Hemet, CA household income distribution 408 Less than $10,000289 $10,000 to $19,999520 $20,000 to $29,999318 $30,000 to $39,999261 $40,000 to $49,999522 $50,000 to $59,999581 $60,000 to $74,999858 $75,000 to $99,999860 $100,000 to $124,999366 $125,000 to $149,999467 $150,000 to $199,999347 $200,000 or more
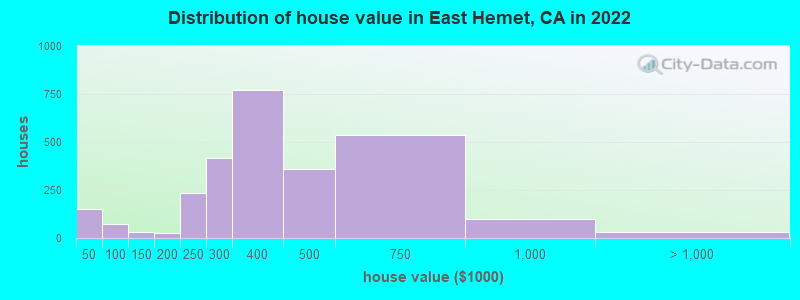
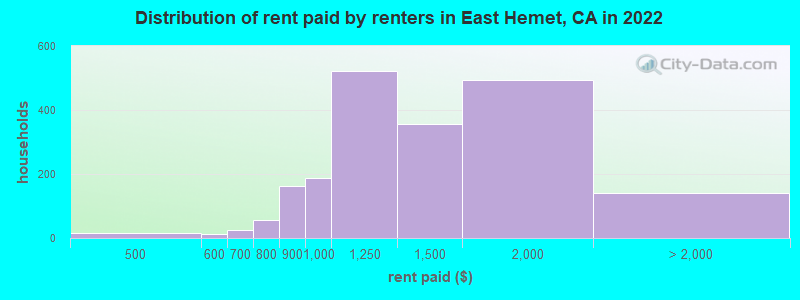
Home value of owner - occupied houses in 2022 in East Hemet, CA 79 Less than $10,0006 $20,000 to $24,9992 $30,000 to $34,99961 $40,000 to $49,9995 $80,000 to $89,9994 $90,000 to $99,99924 $100,000 to $124,9998 $125,000 to $149,99915 $150,000 to $174,99910 $175,000 to $199,999234 $200,000 to $249,999415 $250,000 to $299,999772 $300,000 to $399,999360 $400,000 to $499,999534 $500,000 to $749,999101 $750,000 to $999,99917 $1,000,000 to $1,499,99912 $2,000,000 or moreRent paid by renters in 2022 in East Hemet, CA 15 $450 to $49912 $550 to $59921 $600 to $6494 $650 to $69938 $700 to $74917 $750 to $799162 $800 to $899185 $900 to $999521 $1,000 to $1,249355 $1,250 to $1,499493 $1,500 to $1,99982 $2,000 to $2,49914 $3,500 or more43 No cash rent
Percentage of workers working in this county: 84.3%Number of people working at home: 938 (10.6% of all workers )
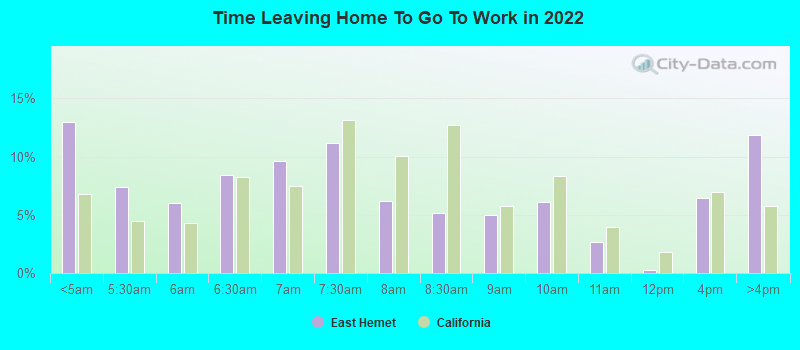
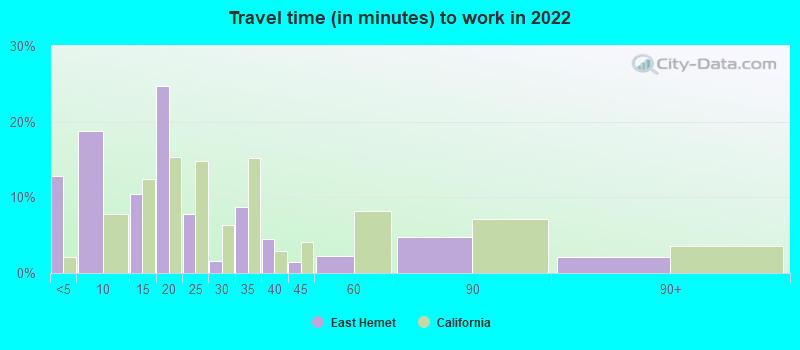
Travel time to work (commute)
Less than 5 minutes: 3215 to 9 minutes: 66610 to 14 minutes: 1,23315 to 19 minutes: 84520 to 24 minutes: 37225 to 29 minutes: 23130 to 34 minutes: 64835 to 39 minutes: 27240 to 44 minutes: 44945 to 59 minutes: 1,04960 to 89 minutes: 1,06690 or more minutes: 616
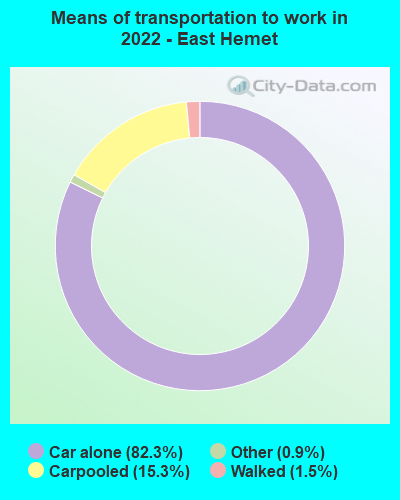
Means of transportation to work:
Drove a car alone: 1,508 (56.7%)Carpooled: 304 (11.4%)Taxi: 17 (0.6%)Walked: 26 (1.0%)Worked at home: 938 (35.2%)
Unemployment by race in 2022
Unemployment rate for White non-Hispanic residents 5.2% Males5.0% FemalesUnemployment rate for Black residents 24.2% MalesUnemployment rate for American Indian and Alaska Native residents 3.2% FemalesUnemployment rate for Asian residents 5.5% MalesUnemployment rate for other race residents 9.9% FemalesUnemployment rate for two or more race residents 1.4% Males12.2% FemalesUnemployment rate for Hispanic or Latino residents 1.5% Males9.6% Females
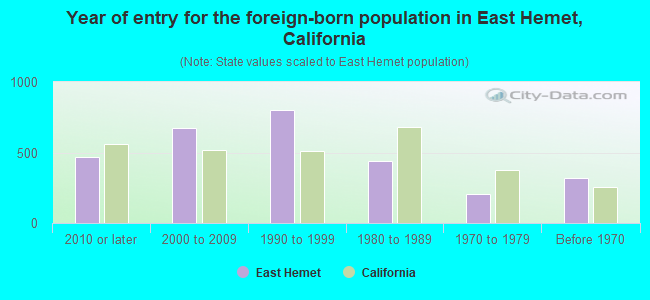
Year of entry for the foreign-born population in East Hemet, California
466 2010 or later 672 2000 to 2009 800 1990 to 1999 438 1980 to 1989 207 1970 to 1979 318 Before 1970
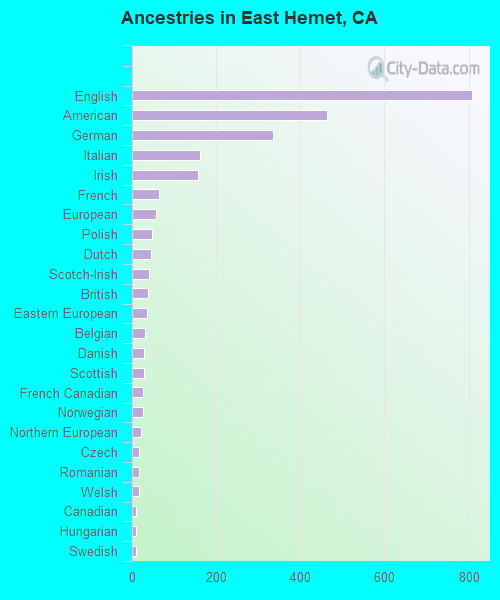
First ancestries reported:
English: 808 (7.3%)
American: 464 (4.2%)
German: 334 (3.0%)
Italian: 162 (1.5%)
Irish: 157 (1.4%)
French: 64 (0.6%)
European: 57 (0.5%)
Polish: 47 (0.4%)
Dutch: 44 (0.4%)
Scotch-Irish: 41 (0.4%)
British: 39 (0.4%)
Eastern European: 35 (0.3%)
Belgian: 30 (0.3%)
Danish: 29 (0.3%)
Scottish: 29 (0.3%)
French Canadian: 27 (0.2%)
Norwegian: 26 (0.2%)
Northern European: 22 (0.2%)
Czech: 16 (0.1%)
Romanian: 16 (0.1%)
Welsh: 16 (0.1%)
Canadian: 10 (0.09%)
Hungarian: 9 (0.08%)
Swedish: 9 (0.08%)
Jamaican: 7 (0.06%)
Scandinavian: 4 (0.04%)
Haitian: 3 (0.03%)
Portuguese: 1 (0.01%) Most common places of birth for foreign-born residents (%): Mexico East Hemet:
70.9% (2,579)California:
37.2% (3,881,193)
Denmark East Hemet:
4.7% (171)California:
0.1% (6,555)
China, excluding Hong Kong and Taiwan East Hemet:
4.6% (168)California:
6.6% (684,672)
Philippines East Hemet:
4.1% (149)California:
7.8% (818,297)
India East Hemet:
3.7% (134)California:
5.2% (539,184)
El Salvador East Hemet:
2.4% (89)California:
4.2% (440,287)
Chile East Hemet:
2.0% (72)California:
0.1% (15,357)
Guatemala East Hemet:
2.0% (71)California:
2.8% (290,436)
Place of birth for U.S.-born residents:
This state: 13,710Other state: 2,905Northeast: 464Midwest: 988South: 868West: 578 90.4% of East Hemet residents lived in the same house 1 years ago.
Out of people who lived in different houses, 36.0% lived in this county.
Out of people who lived in different counties, 90.2% lived in California.
East Hemet:
90.4%State average:
88.9%
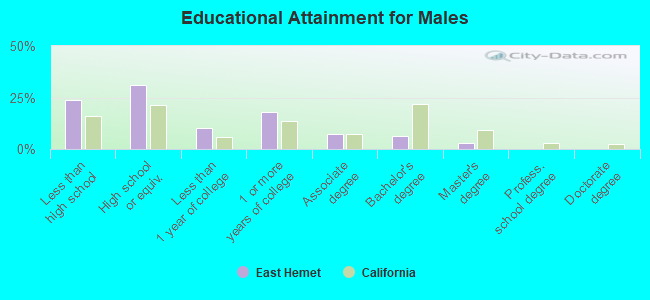
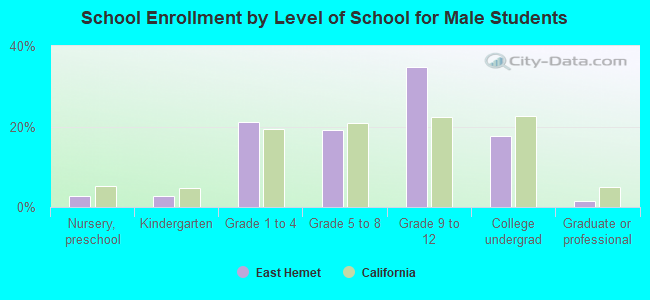
Education attainment for males 25 years and older:
No schooling: 335Nursery to 4th grade: 1375th and 6th grade: 467th and 8th grade: 1009th grade: 10410th grade: 24111th grade: 23412th grade, no diploma: 371High school graduate (or equivalency): 2,074Less than 1 year of college: 673Some college more than 1 year, no degree: 1,195Associate degree: 487Bachelor's degree: 430Master's degree: 194Professional school degree: 14Doctorate degree: 4
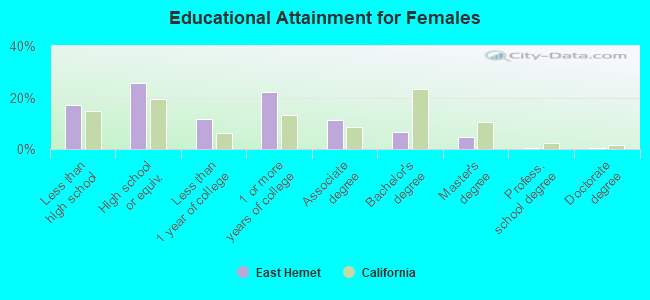
Education attainment for females 25 years and older:
No schooling: 196Nursery to 4th grade: 345th and 6th grade: 1377th and 8th grade: 569th grade: 11210th grade: 6111th grade: 14012th grade, no diploma: 334High school graduate (or equivalency): 1,580Less than 1 year of college: 717Some college more than 1 year, no degree: 1,372Associate degree: 698Bachelor's degree: 408Master's degree: 294Professional school degree: 36Doctorate degree: 20
Housing units in structures:
One, detached: 5,143One, attached: 207Two: 1443 or 4: 2015 to 9: 11710 to 19: 6020 to 49: 950 or more: 61Mobile homes: 91Boats, RVs, vans, etc.: 7Housing units lacking complete plumbing facilities in 2022: 0.2%Housing units lacking complete kitchen facilities in 2022: 2.1%House/condo owner moved in on average 9 years ago
Renter moved in on average 3 years ago
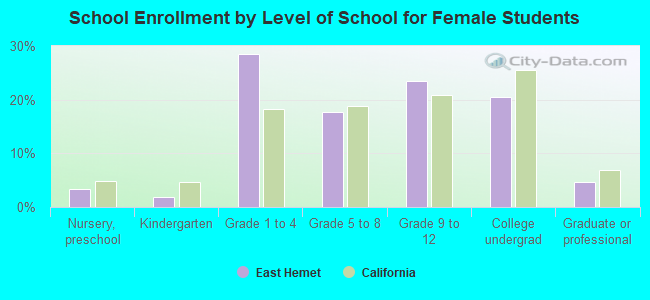
Private vs. public school enrollment:
Students in private schools in grades 1 to 8 (elementary and middle school): 219 Here:
8.4%California:
10.5%
Students in private schools in grades 9 to 12 (high school): 103 Students in private undergraduate colleges: 132 Here:
11.3%California:
15.9%