Estill Springs, TN (Tennessee) Houses and Residents
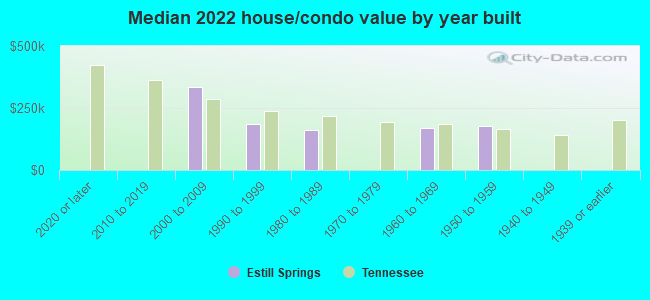
| Estill Springs: | $203,814 |
| Tennessee: | $284,800 |
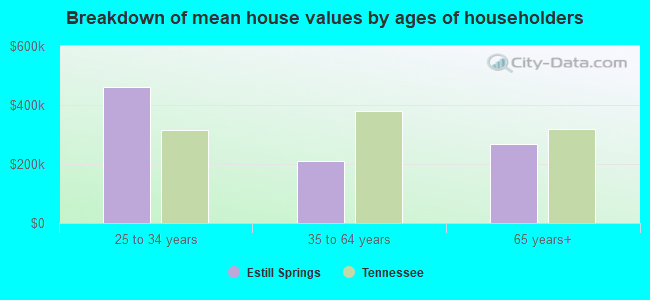
Mean price in 2022:
Detached houses: $289,213
Here: $289,213 State: $374,382 Mobile homes: $56,338
Here: $56,338 State: $101,421
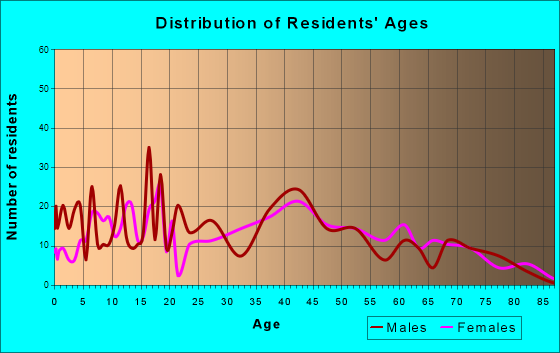
Total population: 2,049 (Urban population: 0, Rural population: 2,175 (all nonfarm))
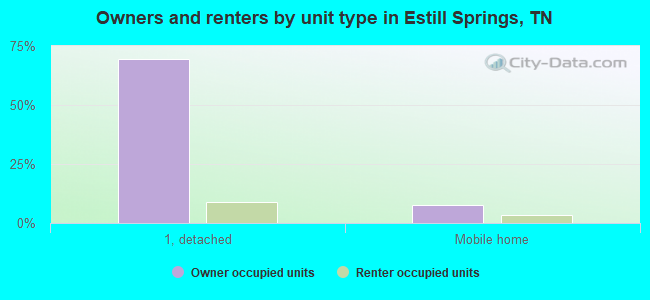
Houses: 893 (823 occupied: 676 owner occupied, 161 renter occupied)
| % of renters here: | 19% |
| State: | 33% |
Housing density: 190 houses/condos per square mile
Median price asked for vacant for-sale houses and condos in 2022 in this county: $628,743.
Median contract rent in 2022: $659 (lower quartile is $556, upper quartile is $952)
Median rent asked for vacant for-rent units in 2022: $383
Median gross rent in Estill Springs, TN in 2022: $861
Housing units in Estill Springs with a mortgage: 446 (42 second mortgage, 0 home equity loan, 25 both second mortgage and home equity loan)
Houses without a mortgage: 0
Median household income for houses/condos with a mortgage: $55,196
Median household income for apartments without a mortgage: $40,286
Median monthly housing costs: $955
Compare current foreclosures near Estill Springs, TN:
| Photo | Address | Area | Beds / Baths | Price | Details |
|---|---|---|---|---|---|

|
#1
Bjs Lndg
Estill Springs, TN 37330
|
1,326 sq. feet
|
2 baths 3 beds |
show details | |

|
#2
Twerp Trl
Estill Springs, TN 37330
|
1,129 sq. feet
|
2 baths 3 beds |
show details | |

|
#3
Hope Dr
Estill Springs, TN 37330
|
1,305 sq. feet
|
2 baths - beds |
show details | |

|
#4
Deer Cir
Estill Springs, TN 37330
|
1,581 sq. feet
|
2 baths - beds |
show details | |

|
#5
Shasteen St
Estill Springs, TN 37330
|
1,200 sq. feet
|
1 baths - beds |
show details | |

|
#6
Rock Creek Rd
Estill Springs, TN 37330
|
1,500 sq. feet
|
2 baths - beds |
show details | |

|
#7
Mckinney St
Estill Springs, TN 37330
|
1,275 sq. feet
|
2 baths - beds |
show details | |

|
#8
Pleasant Grove Rd
Estill Springs, TN 37330
|
1,120 sq. feet
|
1 baths - beds |
show details | |

|
#9
Elklore Ave
Estill Springs, TN 37330
|
- sq. feet
|
- baths - beds |
show details | |

|
#10
Spring Creek Rd
Estill Springs, TN 37330
|
- sq. feet
|
- baths - beds |
show details |
| Photo | Address | Area | Beds / Baths | Price | Details |
|---|---|---|---|---|---|

|
#11
Summerset Pl
Estill Springs, TN 37330
|
- sq. feet
|
- baths - beds |
show details | |

|
#12
Elk River Dr # 108
Estill Springs, TN 37330
|
- sq. feet
|
- baths - beds |
show details | |

|
#13
Elkins St
Estill Springs, TN 37330
|
- sq. feet
|
- baths - beds |
show details | |

|
#14
N West St
Decherd, TN 37324
|
1,742 sq. feet
|
2 baths 4 beds |
show details | |

|
#15
Mccormick St
Manchester, TN 37355
|
1,402 sq. feet
|
1 baths 3 beds |
show details | |

|
#16
Polk St
Manchester, TN 37355
|
1,143 sq. feet
|
2 baths 3 beds |
show details | |

|
#17
Burger St
Manchester, TN 37355
|
1,832 sq. feet
|
3 baths 3 beds |
show details | |

|
#18
Jackson St
Cowan, TN 37318
|
2,224 sq. feet
|
2 baths 3 beds |
show details | |

|
#19
Garner St
Cowan, TN 37318
|
- sq. feet
|
2 baths 3 beds |
show details | |

|
#20
Country Club Dr
Tullahoma, TN 37388
|
2,076 sq. feet
|
2 baths 4 beds |
show details |
| Photo | Address | Area | Beds / Baths | Price | Details |
|---|---|---|---|---|---|

|
#21
Marks Ave
Tullahoma, TN 37388
|
1,440 sq. feet
|
3 baths 4 beds |
show details | |

|
#22
Thomaswood Chase
Tullahoma, TN 37388
|
3,064 sq. feet
|
2 baths 4 beds |
show details | |

|
#23
Bottle Hollow Rd
Shelbyville, TN 37160
|
1,274 sq. feet
|
1 baths - beds |
show details | |

|
#24
Steelman Rd
Mulberry, TN 37359
|
2,100 sq. feet
|
2 baths - beds |
show details | |

|
#25
Greenwood Ave
Tullahoma, TN 37388
|
1,056 sq. feet
|
1 baths - beds |
show details | |

|
#26
Garland Crest Ct S
Tullahoma, TN 37388
|
2,261 sq. feet
|
3 baths - beds |
show details | |

|
#27
Pleasant Hill Rd
Lynchburg, TN 37352
|
3,150 sq. feet
|
2 baths - beds |
show details | |

|
#28
Anthony Mill Rd
Tullahoma, TN 37388
|
912 sq. feet
|
1 baths - beds |
show details | |

|
#29
Dunk Blanton Rd
Tullahoma, TN 37388
|
818 sq. feet
|
1 baths - beds |
show details | |

|
#30
Flowertown Rd
Normandy, TN 37360
|
916 sq. feet
|
1 baths - beds |
show details |
| Photo | Address | Area | Beds / Baths | Price | Details |
|---|---|---|---|---|---|

|
#31
Turkey Creek Run
Tullahoma, TN 37388
|
888 sq. feet
|
1 baths - beds |
show details | |

|
#32
Swann Ln
Decherd, TN 37324
|
1,300 sq. feet
|
1 baths - beds |
show details | |

|
#33
Cumberland Ave
Tullahoma, TN 37388
|
1,794 sq. feet
|
2 baths - beds |
show details | |

|
#34
Bible Crossing Rd
Winchester, TN 37398
|
1,446 sq. feet
|
2 baths - beds |
show details | |

|
#35
Central Ave
Tullahoma, TN 37388
|
800 sq. feet
|
1 baths - beds |
show details | |

|
#36
Westwood Dr
Tullahoma, TN 37388
|
1,459 sq. feet
|
1 baths - beds |
show details | |

|
#37
Roys Ln
Winchester, TN 37398
|
1,300 sq. feet
|
2 baths - beds |
show details | |

|
#38
Linda Ln
Tullahoma, TN 37388
|
1,706 sq. feet
|
2 baths - beds |
show details | |

|
#39
Westwood Dr
Tullahoma, TN 37388
|
2,656 sq. feet
|
2 baths - beds |
show details | |

|
#40
Crestwood Dr
Tullahoma, TN 37388
|
1,425 sq. feet
|
1 baths - beds |
show details |
| Photo | Address | Area | Beds / Baths | Price | Details |
|---|---|---|---|---|---|

|
#41
Westlake Pl
Tullahoma, TN 37388
|
992 sq. feet
|
1 baths - beds |
show details | |

|
#42
Country Club Dr
Tullahoma, TN 37388
|
1,375 sq. feet
|
1 baths - beds |
show details | |

|
#43
Woods Edge Rd
Winchester, TN 37398
|
1,511 sq. feet
|
2 baths - beds |
show details | |

|
#44
N Summit St
Tullahoma, TN 37388
|
960 sq. feet
|
1 baths - beds |
show details | |

|
#45
E Moore St
Tullahoma, TN 37388
|
1,152 sq. feet
|
2 baths - beds |
show details | |

|
#46
Lynn St
Tullahoma, TN 37388
|
1,242 sq. feet
|
1 baths - beds |
show details | |

|
#47
N Jackson St
Normandy, TN 37360
|
1,269 sq. feet
|
1 baths - beds |
show details | |

|
#48
Limbo Dr
Hillsboro, TN 37342
|
1,728 sq. feet
|
2 baths - beds |
show details | |

|
#49
Oakley St
Hillsboro, TN 37342
|
1,200 sq. feet
|
1 baths - beds |
show details | |

|
Check over 1 million property listings on Foreclosure.com!
|
browse all offers | |||


 | Looking for a small safe town in Tennessee to raise our kids (13 replies) |
| Growth numbers for all Mid Tenn places above 2,000 pop (2 replies) |
| Winchester, Decherd, Tullahoma area (5 replies) |
| How's the job market? (14 replies) |
| Tazewell and Tullahoma (9 replies) |
Median year apartment built: 1981
Household type by relationship:
Households: 2,059- Male householders: 293 (73 living alone), Female householders: 520 (141 living alone)
367 spouses (362 opposite-sex spouses), 0 unmarried partners, (0 opposite-sex unmarried partners), 665 children (621 natural, 10 adopted, 33 stepchildren), 41 grandchildren, 17 brothers or sisters, 40 parents, 0 foster children, 24 other relatives, 88 non-relatives
Size of family households: 267 2-persons, 175 3-persons, 121 4-persons, 13 5-persons, 28 7-or-more-persons.
Size of nonfamily households: 218 1-person, 12 2-persons.
218 married couples with children.
296 single-parent households (85 men, 211 women).
98.9% of residents of Estill Springs speak English at home.
0.4% of residents speak other Indo-European language at home (100% speak English very well).
0.3% of residents speak Asian or Pacific Island language at home (100% speak English well).
Foreign born population: 13 (0.6%)
(100.0% of them are naturalized citizens)
| Here: | 6.1 |
| State: | 6.5 |
| Here: | 5.2 |
| State: | 4.4 |
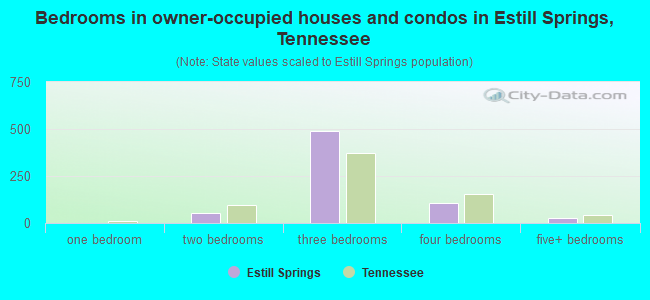
- Bedrooms in owner-occupied houses and condos in Estill Springs, Tennessee
- 0no bedroom
- 01 bedroom
- 522 bedrooms
- 4893 bedrooms
- 1094 bedrooms
- 265+ bedrooms
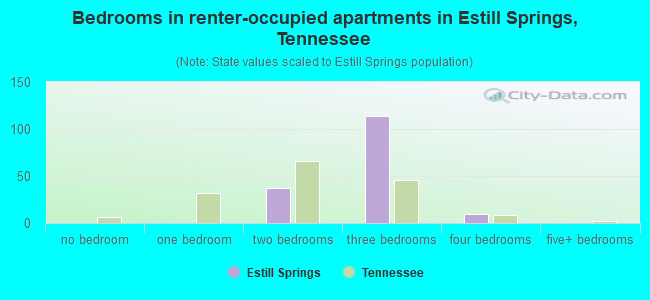
- Bedrooms in renter-occupied apartments in Estill Springs, Tennessee
- 0no bedroom
- 01 bedroom
- 372 bedrooms
- 1143 bedrooms
- 104 bedrooms
- 05+ bedrooms
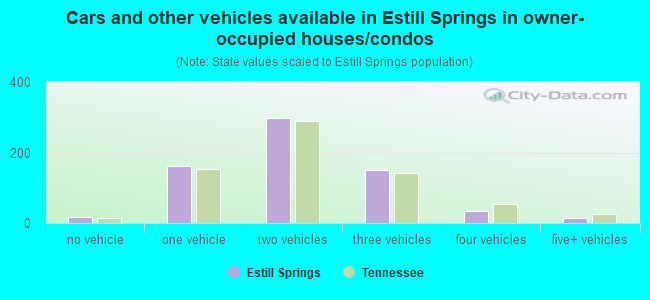
- Cars and other vehicles available in Estill Springs in owner-occupied houses/condos
- 18no vehicle
- 1631 vehicle
- 2992 vehicles
- 1493 vehicles
- 344 vehicles
- 155+ vehicles
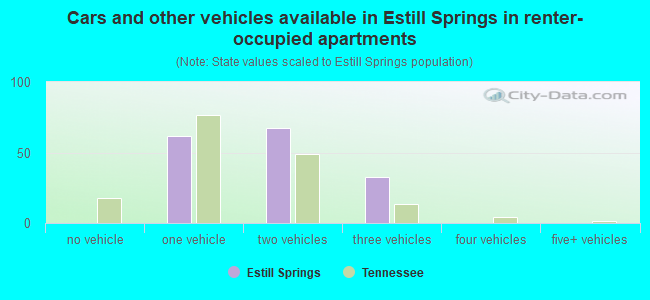
- Cars and other vehicles available in Estill Springs in renter-occupied apartments
- 0no vehicle
- 621 vehicle
- 672 vehicles
- 333 vehicles
- 04 vehicles
- 05+ vehicles
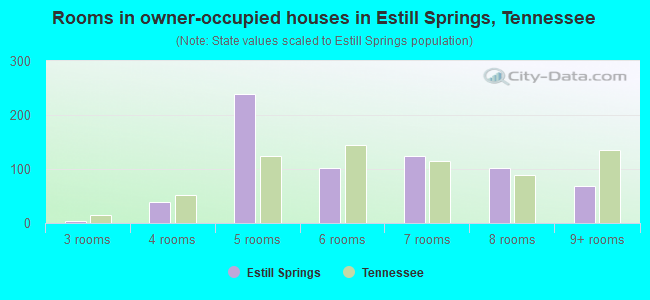
- Rooms in owner-occupied houses in Estill Springs, Tennessee
- 01 room
- 02 rooms
- 43 rooms
- 394 rooms
- 2395 rooms
- 1026 rooms
- 1247 rooms
- 1018 rooms
- 689+ rooms
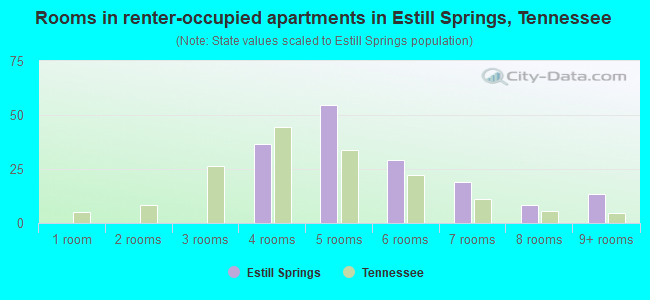
- Rooms in renter-occupied apartments in Estill Springs, Tennessee
- 01 room
- 02 rooms
- 03 rooms
- 374 rooms
- 555 rooms
- 296 rooms
- 197 rooms
- 88 rooms
- 149+ rooms
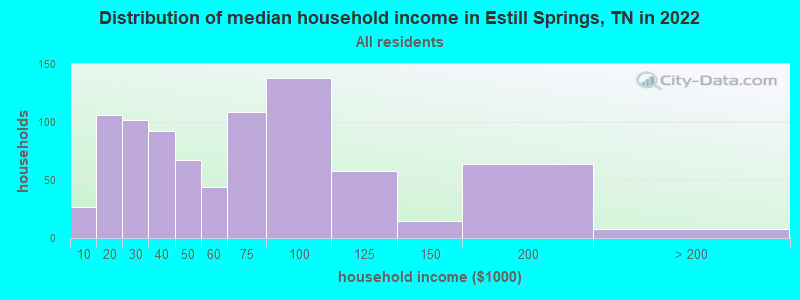
Estill Springs, TN household income distribution

- 27Less than $10,000
- 106$10,000 to $19,999
- 102$20,000 to $29,999
- 92$30,000 to $39,999
- 67$40,000 to $49,999
- 44$50,000 to $59,999
- 109$60,000 to $74,999
- 138$75,000 to $99,999
- 58$100,000 to $124,999
- 15$125,000 to $149,999
- 64$150,000 to $199,999
- 8$200,000 or more
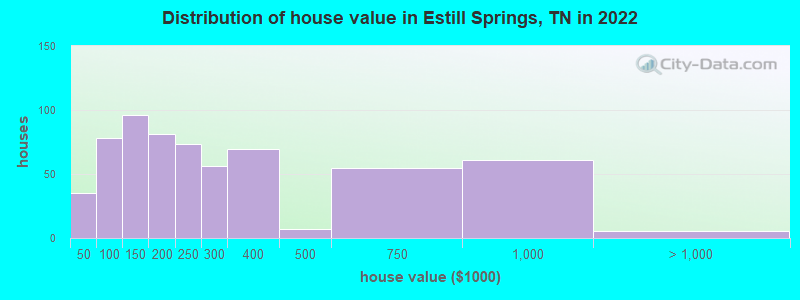
Home value of owner - occupied houses in 2022 in Estill Springs, TN
-
- 5$15,000 to $19,999
- 4$20,000 to $24,999
- 3$25,000 to $29,999
- 14$30,000 to $34,999
- 7$40,000 to $49,999
- 16$60,000 to $69,999
- 4$70,000 to $79,999
- 9$80,000 to $89,999
- 39$90,000 to $99,999
- 50$100,000 to $124,999
- 46$125,000 to $149,999
- 61$150,000 to $174,999
- 19$175,000 to $199,999
- 73$200,000 to $249,999
- 56$250,000 to $299,999
- 69$300,000 to $399,999
- 6$400,000 to $499,999
- 54$500,000 to $749,999
- 61$750,000 to $999,999
- 5$1,000,000 to $1,499,999
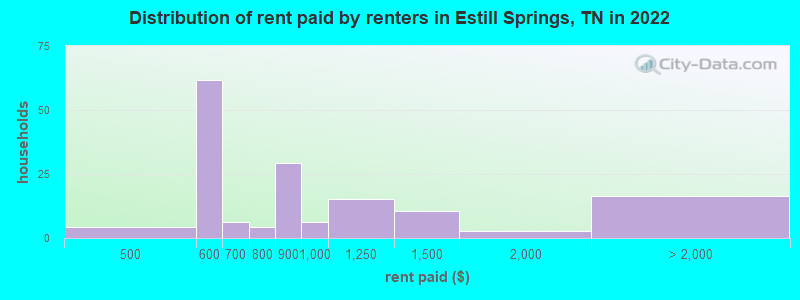
Rent paid by renters in 2022 in Estill Springs, TN
-
- 4$450 to $499
- 51$500 to $549
- 9$550 to $599
- 6$600 to $649
- 4$700 to $749
- 29$800 to $899
- 6$900 to $999
- 15$1,000 to $1,249
- 10$1,250 to $1,499
- 2$1,500 to $1,999
- 16No cash rent
Percentage of workers working in this county: 62.0%
Number of people working at home: 93 (11.3% of all workers)
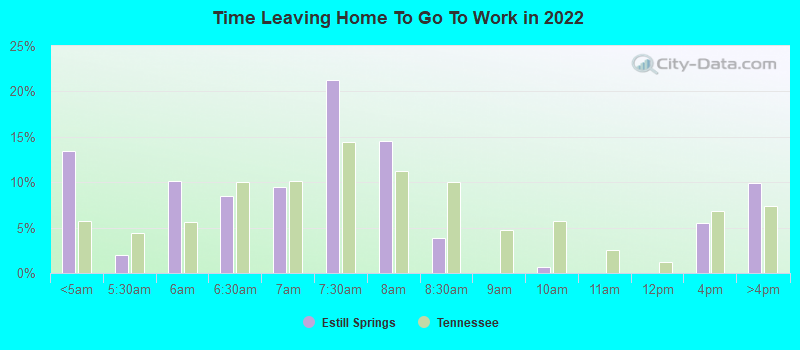
Travel time to work (commute)
- Less than 5 minutes: 5
- 5 to 9 minutes: 0
- 10 to 14 minutes: 50
- 15 to 19 minutes: 257
- 20 to 24 minutes: 193
- 25 to 29 minutes: 41
- 30 to 34 minutes: 116
- 35 to 39 minutes: 0
- 40 to 44 minutes: 0
- 45 to 59 minutes: 27
- 60 to 89 minutes: 13
- 90 or more minutes: 10
Means of transportation to work:
- Drove a car alone: 858 (84.1%)
- Carpooled: 118 (11.6%)
- Bus or trolley bus: 3 (0.3%)
- Walked: 7 (0.7%)
- Other means: 7 (0.7%)
- Worked at home: 27 (2.6%)
- Unemployment by race in 2022
- Unemployment rate for White non-Hispanic residents
- 1.9%Males
- 9.0%Females
- Unemployment rate for two or more race residents
- 50.0%Males
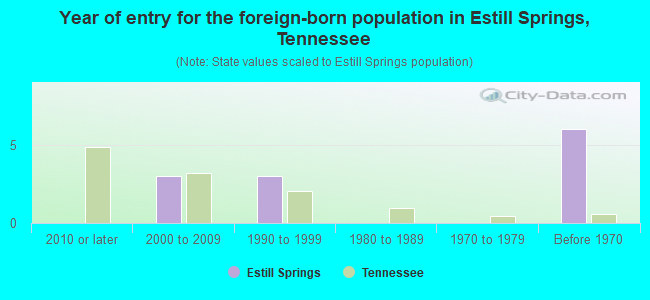
- Year of entry for the foreign-born population in Estill Springs, Tennessee
- 02010 or later
- 32000 to 2009
- 31990 to 1999
- 01980 to 1989
- 01970 to 1979
- 6Before 1970
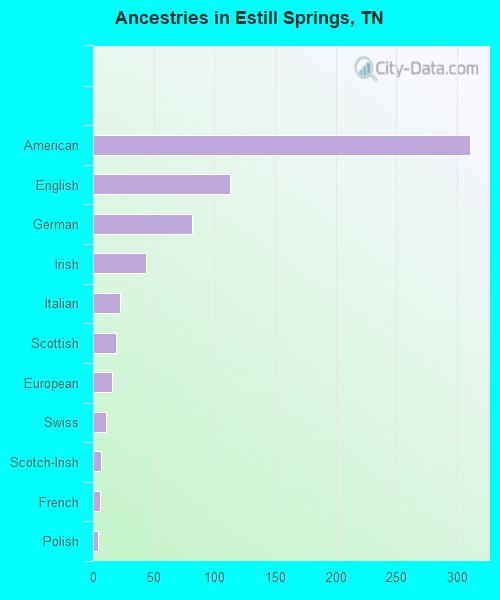
First ancestries reported:
- American: 311 (41.6%)
- English: 113 (15.1%)
- German: 82 (11.0%)
- Irish: 44 (5.9%)
- Italian: 22 (2.9%)
- Scottish: 19 (2.5%)
- European: 16 (2.1%)
- Swiss: 11 (1.5%)
- Scotch-Irish: 7 (0.9%)
- French: 6 (0.8%)
- Polish: 4 (0.5%)
Most common places of birth for foreign-born residents (%):
| Estill Springs: | 53.8% (7) |
| Tennessee: | 2.2% (8,261) |
| Estill Springs: | 23.1% (3) |
| Tennessee: | 2.4% (8,894) |
| Estill Springs: | 7.7% (1) |
| Tennessee: | 0.5% (1,761) |
Place of birth for U.S.-born residents:
- This state: 1,343
- Other state: 685
- Northeast: 58
- Midwest: 231
- South: 356
- West: 32
83.8% of Estill Springs residents lived in the same house 1 years ago.
Out of people who lived in different houses, 38.7% lived in this county.
Out of people who lived in different counties, 88.2% lived in Tennessee.
| Estill Springs: | 83.8% |
| State average: | 87.0% |
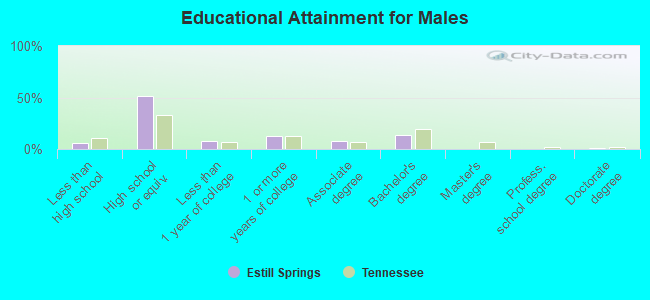
Education attainment for males 25 years and older:
- No schooling: 4
- Nursery to 4th grade: 0
- 5th and 6th grade: 0
- 7th and 8th grade: 11
- 9th grade: 14
- 10th grade: 0
- 11th grade: 9
- 12th grade, no diploma: 0
- High school graduate (or equivalency): 357
- Less than 1 year of college: 53
- Some college more than 1 year, no degree: 90
- Associate degree: 52
- Bachelor's degree: 95
- Master's degree: 3
- Professional school degree: 3
- Doctorate degree: 5
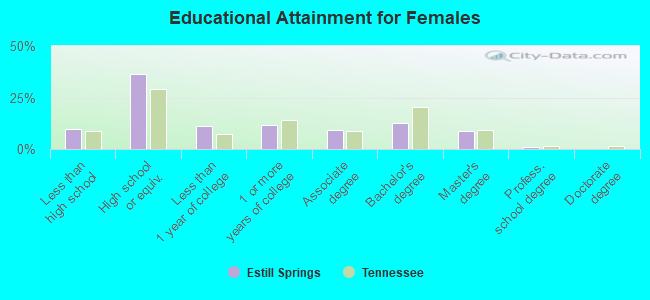
Education attainment for females 25 years and older:
- No schooling: 5
- Nursery to 4th grade: 0
- 5th and 6th grade: 19
- 7th and 8th grade: 20
- 9th grade: 14
- 10th grade: 3
- 11th grade: 10
- 12th grade, no diploma: 0
- High school graduate (or equivalency): 274
- Less than 1 year of college: 84
- Some college more than 1 year, no degree: 86
- Associate degree: 69
- Bachelor's degree: 95
- Master's degree: 65
- Professional school degree: 6
- Doctorate degree: 0
Housing units in structures:
- One, detached: 719
- One, attached: 5
- Two: 19
- 3 or 4: 4
- 5 to 9: 15
- Mobile homes: 129
Median worth of mobile homes: $104,337
Housing units lacking complete kitchen facilities in 2022: 1.5%
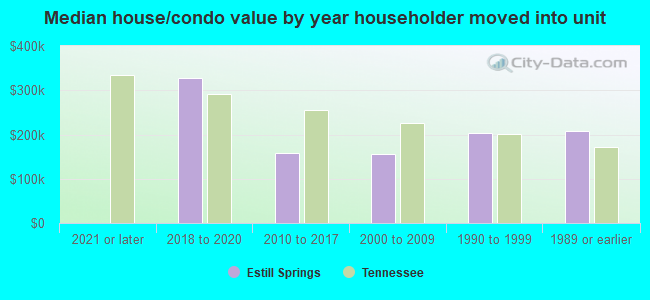
House/condo owner moved in on average 11 years ago
Renter moved in on average 3 years ago
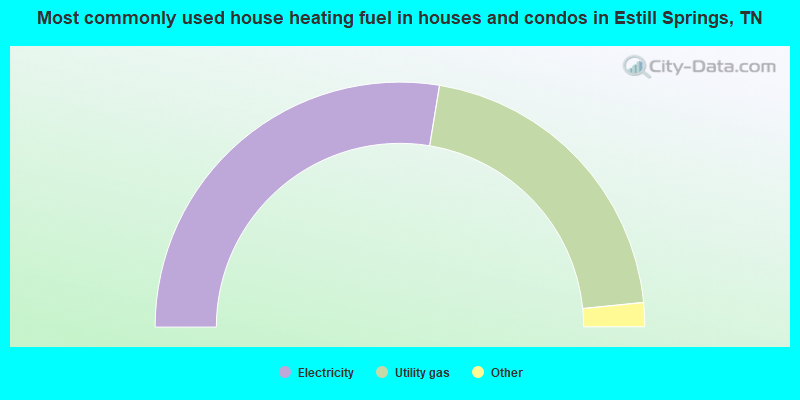
- 55.3%Electricity
- 41.7%Utility gas
- 1.9%Bottled, tank, or LP gas
- 0.6%Wood
- 0.5%Solar energy
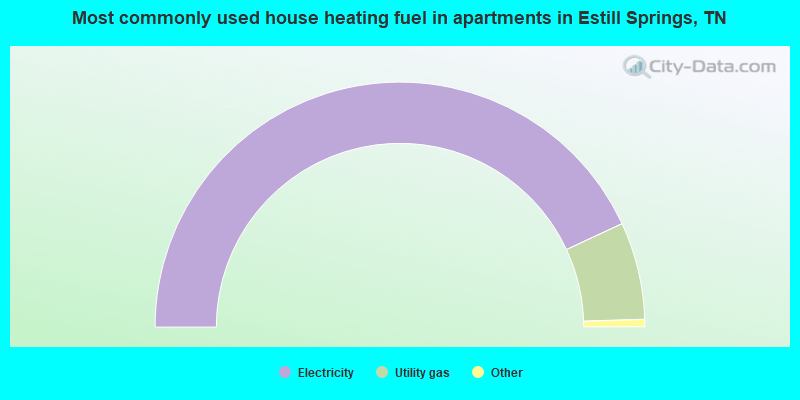
- 87.0%Electricity
- 13.0%Utility gas
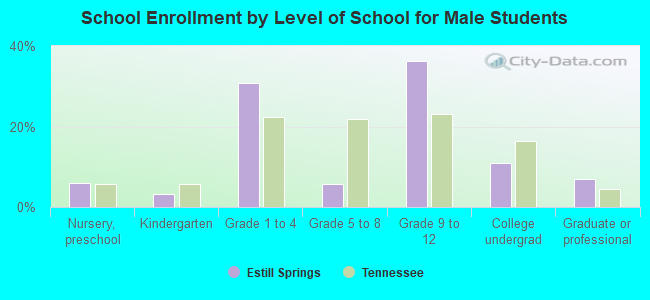
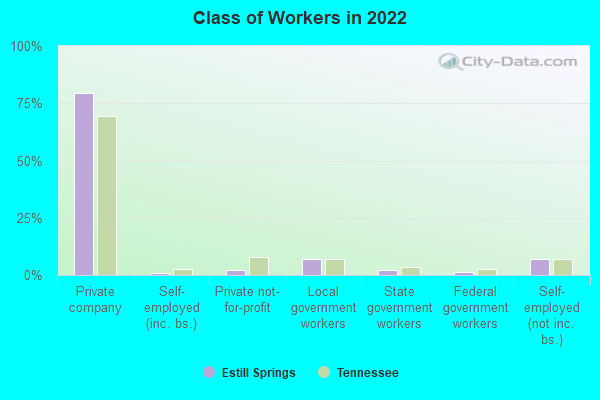
Private vs. public school enrollment:
| Here: | 2.9% |
| Tennessee: | 15.0% |
| Here: | 8.2% |
| Tennessee: | 16.2% |
| Here: | 19.4% |
| Tennessee: | 23.5% |