Fern Park, FL (Florida) Houses and Residents
| Fern Park: | $338,555 |
| Florida: | $354,100 |
Total population: 7,704 (All urban)
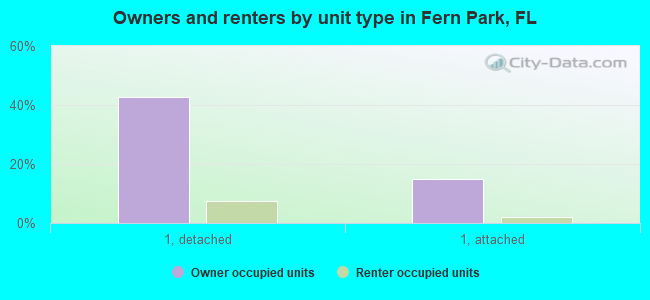
Houses: 3,950 (3,706 occupied: 2,248 owner occupied, 1,486 renter occupied)
| % of renters here: | 40% |
| State: | 33% |
Housing density: 1,926 houses/condos per square mile
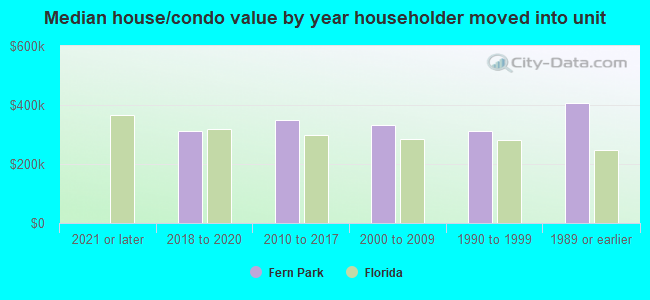
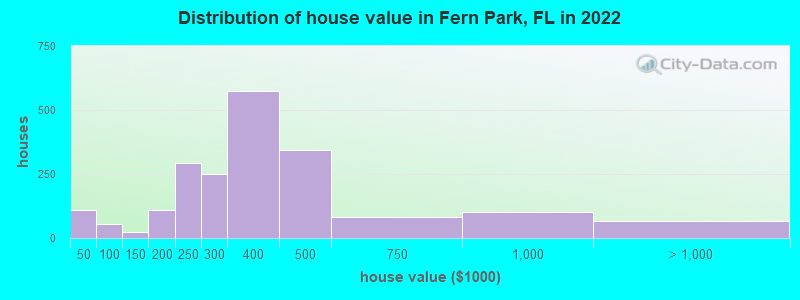
Median price asked for vacant for-sale houses and condos in 2022: $408,230.
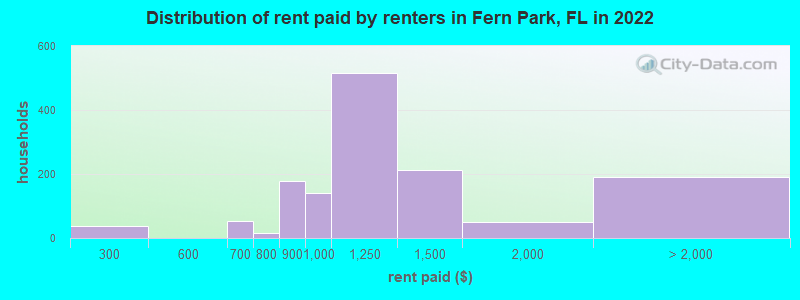
Median contract rent in 2022: $1,154 (lower quartile is $991, upper quartile is $1,310)
Median rent asked for vacant for-rent units in 2022: $1,332
Median gross rent in Fern Park, FL in 2022: $1,344
Housing units in Fern Park with a mortgage: 1,360 (33 second mortgage, 0 home equity loan, 33 both second mortgage and home equity loan)
Houses without a mortgage: 18
Median household income for houses/condos with a mortgage: $99,131
Median household income for apartments without a mortgage: $66,860
Median monthly housing costs: $1,288
Compare current foreclosures near Fern Park, FL:
| Photo | Address | Area | Beds / Baths | Price | Details |
|---|---|---|---|---|---|

|
#1
Ford St
Orlando, FL 32811
|
726 sq. feet
|
1 baths 2 beds |
$245,000
|
show details |

|
#2
Cannon Way
Casselberry, FL 32707
|
1,428 sq. feet
|
1 baths 3 beds |
$340,000
|
show details |

|
#3
Idaho Ave
Orlando, FL 32809
|
1,326 sq. feet
|
2 baths 3 beds |
$279,000
|
show details |

|
#4
Anna Dr
Apopka, FL 32703
|
864 sq. feet
|
1 baths 3 beds |
$146,500
|
show details |

|
#5
Anzle Ave
Winter Park, FL 32789
|
1,808 sq. feet
|
2 baths 3 beds |
$549,900
|
show details |

|
#6
Walnut Crest Run
Sanford, FL 32771
|
2,476 sq. feet
|
3 baths 4 beds |
show details | |

|
#7
Cherry Grove Cir
Orlando, FL 32809
|
1,895 sq. feet
|
2 baths 3 beds |
show details | |

|
#8
Palio Ct
Ocoee, FL 34761
|
3,227 sq. feet
|
3 baths 4 beds |
show details | |

|
#9
Blanton Ct
Orlando, FL 32809
|
1,425 sq. feet
|
2 baths 3 beds |
show details | |

|
#10
Alfred Dr
Orlando, FL 32810
|
1,752 sq. feet
|
2 baths 3 beds |
show details |
| Photo | Address | Area | Beds / Baths | Price | Details |
|---|---|---|---|---|---|

|
#11
Buttercup Ln
Orlando, FL 32825
|
1,220 sq. feet
|
1 baths 3 beds |
show details | |

|
#12
Autumn Chase Cir
Sanford, FL 32773
|
2,465 sq. feet
|
3 baths 4 beds |
show details | |

|
#13
Empire Ave
Orlando, FL 32810
|
1,612 sq. feet
|
1 baths 2 beds |
show details | |

|
#14
W Cottesmore Cir
Longwood, FL 32779
|
1,861 sq. feet
|
2 baths 4 beds |
show details | |

|
#15
Delcrest Dr
Orlando, FL 32817
|
2,053 sq. feet
|
2 baths 3 beds |
show details | |

|
#16
Oyster Bay Cir Apt 100
Altamonte Springs, FL 32701
|
992 sq. feet
|
2 baths 2 beds |
show details | |

|
#17
Golden Rain Tree Blvd
Orlando, FL 32828
|
2,920 sq. feet
|
2 baths 4 beds |
show details | |

|
#18
N Hastings St
Orlando, FL 32808
|
1,220 sq. feet
|
2 baths 3 beds |
show details | |

|
#19
Biscayne Dr
Orlando, FL 32804
|
2,758 sq. feet
|
3 baths 4 beds |
show details | |

|
#20
Shady Willow Dr
Orlando, FL 32808
|
1,460 sq. feet
|
2 baths 3 beds |
show details |
| Photo | Address | Area | Beds / Baths | Price | Details |
|---|---|---|---|---|---|

|
#21
Lyman St
Ocoee, FL 34761
|
1,197 sq. feet
|
1 baths 3 beds |
show details | |

|
#22
Luzon Dr
Orlando, FL 32809
|
1,225 sq. feet
|
2 baths 3 beds |
show details | |

|
#23
Guildhall Cir
Orlando, FL 32828
|
2,634 sq. feet
|
3 baths 4 beds |
show details | |

|
#24
Pineview Way
Apopka, FL 32703
|
1,299 sq. feet
|
2 baths 3 beds |
show details | |

|
#25
Simmons Rd
Orlando, FL 32812
|
3,936 sq. feet
|
3 baths 4 beds |
show details | |

|
#26
Ayden Oak Ln
Ocoee, FL 34761
|
2,706 sq. feet
|
4 baths 4 beds |
show details | |

|
#27
Brisbane Ct
Orlando, FL 32835
|
1,473 sq. feet
|
2 baths 3 beds |
show details | |

|
#28
Hunley Ave
Apopka, FL 32703
|
2,477 sq. feet
|
2 baths 4 beds |
show details | |

|
#29
Nan Dr
Ocoee, FL 34761
|
1,753 sq. feet
|
2 baths 3 beds |
show details | |

|
#30
Foxforrest Cir
Apopka, FL 32712
|
2,648 sq. feet
|
2 baths 3 beds |
show details |
| Photo | Address | Area | Beds / Baths | Price | Details |
|---|---|---|---|---|---|

|
#31
Moonbeam Rd
Apopka, FL 32712
|
1,024 sq. feet
|
2 baths 3 beds |
show details | |

|
#32
Joyce St
Orlando, FL 32839
|
1,176 sq. feet
|
2 baths 3 beds |
show details | |

|
#33
Kantor Blvd
Casselberry, FL 32707
|
1,511 sq. feet
|
2 baths 3 beds |
show details | |

|
#34
Oak Dr
Longwood, FL 32779
|
1,922 sq. feet
|
2 baths 3 beds |
show details | |

|
#35
S Palmetto Ave
Sanford, FL 32773
|
1,412 sq. feet
|
1 baths 3 beds |
show details | |

|
#36
N Hart Blvd
Orlando, FL 32835
|
1,296 sq. feet
|
2 baths 3 beds |
show details | |

|
#37
Dianjo Dr
Orlando, FL 32810
|
1,539 sq. feet
|
2 baths 4 beds |
show details | |

|
#38
Russober Ct
Orlando, FL 32826
|
1,688 sq. feet
|
2 baths 3 beds |
show details | |

|
#39
Kintla Rd
Apopka, FL 32712
|
2,599 sq. feet
|
2 baths 3 beds |
show details | |

|
#40
Forest St
Orlando, FL 32806
|
1,971 sq. feet
|
2 baths 3 beds |
show details |
| Photo | Address | Area | Beds / Baths | Price | Details |
|---|---|---|---|---|---|

|
#41
Bahia Ave
Orlando, FL 32807
|
1,877 sq. feet
|
1 baths 3 beds |
show details | |

|
#42
Aguila Pl
Orlando, FL 32826
|
1,958 sq. feet
|
2 baths 4 beds |
show details | |

|
#43
Roger Babson Rd
Orlando, FL 32808
|
1,501 sq. feet
|
1 baths 3 beds |
show details | |

|
#44
Lost Grove Cir
Winter Garden, FL 34787
|
2,880 sq. feet
|
2 baths 4 beds |
show details | |

|
#45
Majestic Oak Dr
Apopka, FL 32712
|
3,066 sq. feet
|
4 baths 4 beds |
show details | |

|
#46
Blue Jacket Ln
Orlando, FL 32825
|
1,714 sq. feet
|
2 baths 3 beds |
show details | |

|
#47
Carriage Hill Dr
Casselberry, FL 32707
|
2,200 sq. feet
|
2 baths 4 beds |
show details | |

|
#48
Tabatha Dr
Osteen, FL 32764
|
1,920 sq. feet
|
2 baths 2 beds |
show details | |

|
#49
Hardman Dr
Orlando, FL 32806
|
3,590 sq. feet
|
2 baths 3 beds |
show details | |

|
Check over 1 million property listings on Foreclosure.com!
|
browse all offers | |||


 | Home Rentals North Orlando area (11 replies) |
| Mid-Century Modern homes (2 replies) |
| Is Florida becoming unaffordable for the working class (208 replies) |
| Some Orlando Institutions Long gone (438 replies) |
| $150,000 Home in Central, FL? (25 replies) |
| Safe areas: Winter Park, Maitland, Oviedo? (20 replies) |

Median year apartment built: 1974
Household type by relationship:
Households: 8,336- Male householders: 2,153 (701 living alone), Female householders: 1,519 (546 living alone)
1,435 spouses (1,435 opposite-sex spouses), 391 unmarried partners, (386 opposite-sex unmarried partners), 1,953 children (1,627 natural, 88 adopted, 237 stepchildren), 163 grandchildren, 69 brothers or sisters, 78 parents, 0 foster children, 157 other relatives, 241 non-relatives
- In group quarters: 173
Size of family households: 1,093 2-persons, 497 3-persons, 420 4-persons, 84 5-persons, 9 6-persons, 64 7-or-more-persons.
Size of nonfamily households: 1,232 1-person, 229 2-persons, 8 3-persons, 40 5-persons.
721 married couples with children.
581 single-parent households (416 men, 165 women).
73.4% of residents of Fern Park speak English at home.
15.8% of residents speak Spanish at home (59% speak English very well, 16% speak English well, 17% speak English not well, 8% don't speak English at all).
4.6% of residents speak other Indo-European language at home (68% speak English very well, 27% speak English well, 5% don't speak English at all).
4.3% of residents speak Asian or Pacific Island language at home (43% speak English very well, 44% speak English well, 12% speak English not well).
1.3% of residents speak other language at home (100% speak English very well).
Foreign born population: 1,310 (15.7%)
(75.3% of them are naturalized citizens)
| Here: | 6.8 |
| State: | 5.9 |
| Here: | 3.5 |
| State: | 4.2 |
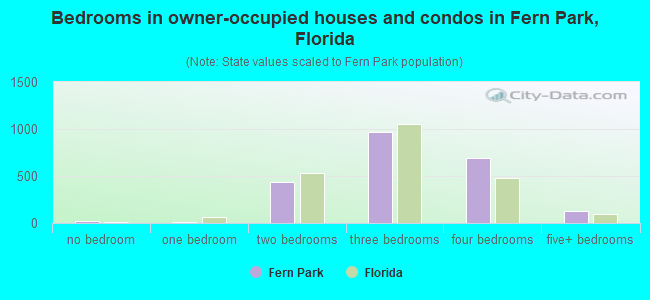
- Bedrooms in owner-occupied houses and condos in Fern Park, Florida
- 20no bedroom
- 91 bedroom
- 4362 bedrooms
- 9663 bedrooms
- 6954 bedrooms
- 1235+ bedrooms
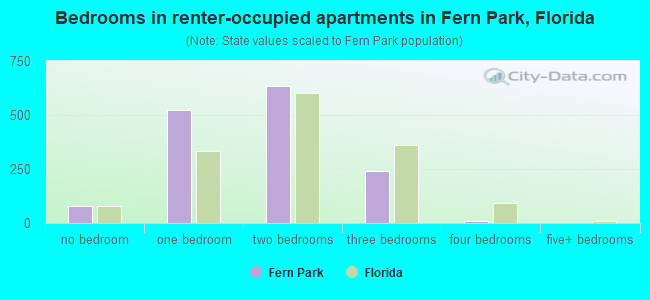
- Bedrooms in renter-occupied apartments in Fern Park, Florida
- 77no bedroom
- 5251 bedroom
- 6362 bedrooms
- 2413 bedrooms
- 74 bedrooms
- 05+ bedrooms
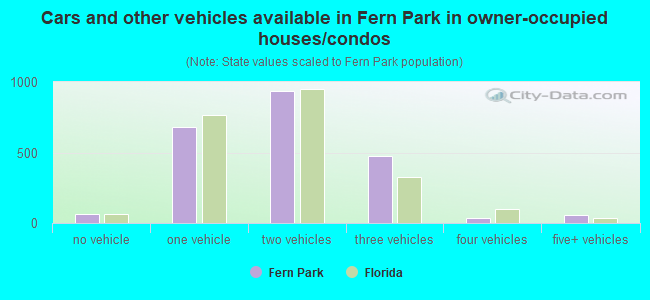
- Cars and other vehicles available in Fern Park in owner-occupied houses/condos
- 66no vehicle
- 6831 vehicle
- 9392 vehicles
- 4723 vehicles
- 334 vehicles
- 565+ vehicles
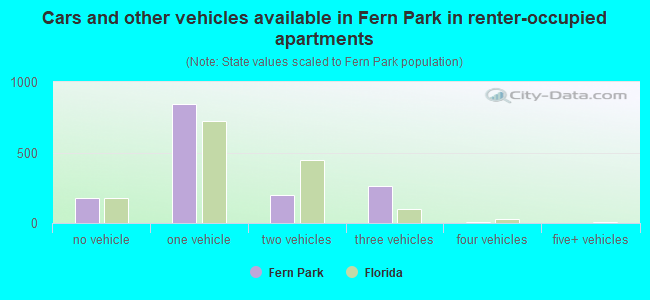
- Cars and other vehicles available in Fern Park in renter-occupied apartments
- 177no vehicle
- 8441 vehicle
- 1972 vehicles
- 2613 vehicles
- 74 vehicles
- 05+ vehicles
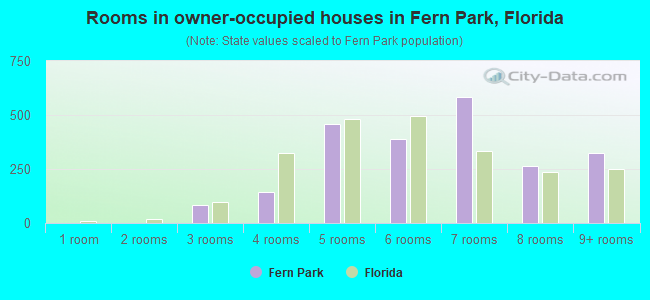
- Rooms in owner-occupied houses in Fern Park, Florida
- 01 room
- 02 rooms
- 833 rooms
- 1454 rooms
- 4595 rooms
- 3906 rooms
- 5827 rooms
- 2648 rooms
- 3259+ rooms
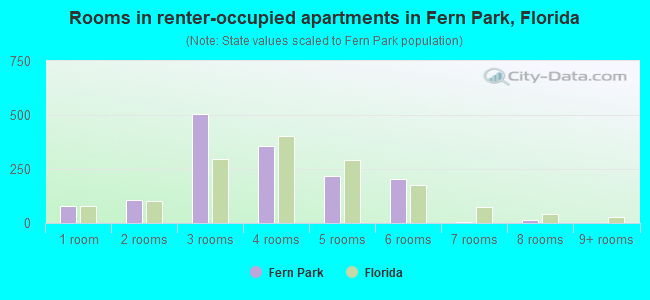
- Rooms in renter-occupied apartments in Fern Park, Florida
- 771 room
- 1082 rooms
- 5033 rooms
- 3554 rooms
- 2185 rooms
- 2036 rooms
- 57 rooms
- 158 rooms
- 09+ rooms
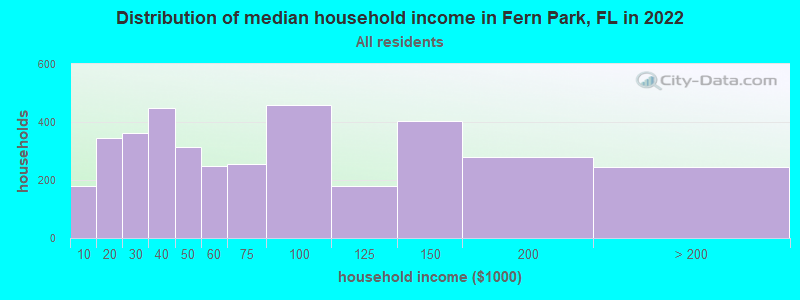
Fern Park, FL household income distribution

- 179Less than $10,000
- 345$10,000 to $19,999
- 362$20,000 to $29,999
- 449$30,000 to $39,999
- 314$40,000 to $49,999
- 247$50,000 to $59,999
- 255$60,000 to $74,999
- 459$75,000 to $99,999
- 179$100,000 to $124,999
- 404$125,000 to $149,999
- 280$150,000 to $199,999
- 245$200,000 or more
Home value of owner - occupied houses in 2022 in Fern Park, FL
-
- 68Less than $10,000
- 8$10,000 to $14,999
- 7$20,000 to $24,999
- 23$40,000 to $49,999
- 12$60,000 to $69,999
- 16$90,000 to $99,999
- 11$100,000 to $124,999
- 13$125,000 to $149,999
- 64$150,000 to $174,999
- 46$175,000 to $199,999
- 291$200,000 to $249,999
- 249$250,000 to $299,999
- 576$300,000 to $399,999
- 342$400,000 to $499,999
- 82$500,000 to $749,999
- 101$750,000 to $999,999
- 66$1,000,000 to $1,499,999
Rent paid by renters in 2022 in Fern Park, FL
-
- 38$200 to $249
- 52$600 to $649
- 15$700 to $749
- 178$800 to $899
- 141$900 to $999
- 515$1,000 to $1,249
- 213$1,250 to $1,499
- 51$1,500 to $1,999
- 42$2,000 to $2,499
- 148No cash rent
Percentage of workers working in this county: 55.8%
Number of people working at home: 564 (12.4% of all workers)
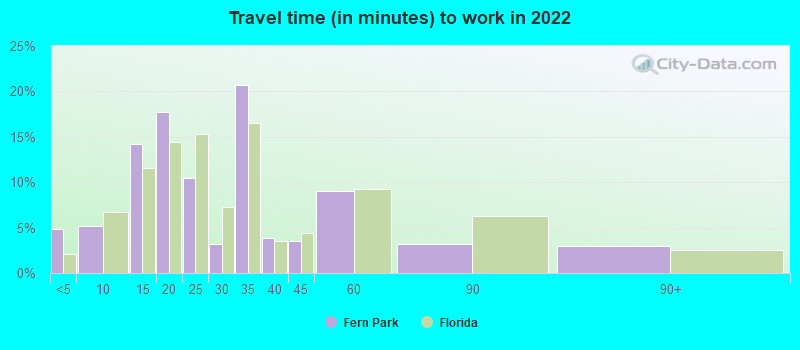
Travel time to work (commute)
- Less than 5 minutes: 134
- 5 to 9 minutes: 96
- 10 to 14 minutes: 322
- 15 to 19 minutes: 888
- 20 to 24 minutes: 792
- 25 to 29 minutes: 342
- 30 to 34 minutes: 698
- 35 to 39 minutes: 151
- 40 to 44 minutes: 157
- 45 to 59 minutes: 95
- 60 to 89 minutes: 72
- 90 or more minutes: 75
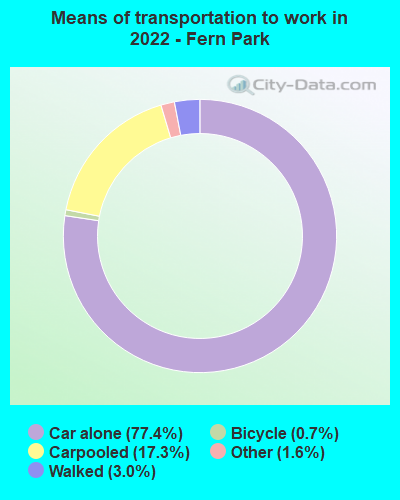
Means of transportation to work:
- Drove a car alone: 1,877 (60.4%)
- Carpooled: 531 (17.1%)
- Taxi: 45 (1.4%)
- Bicycle: 15 (0.5%)
- Walked: 68 (2.2%)
- Worked at home: 564 (18.1%)
- Unemployment by race in 2022
- Unemployment rate for White non-Hispanic residents
- 1.6%Males
- 0.7%Females
- Unemployment rate for Black residents
- 7.6%Males
- Unemployment rate for other race residents
- 19.1%Males
- 2.8%Females
- Unemployment rate for two or more race residents
- 18.7%Females
- Unemployment rate for Hispanic or Latino residents
- 7.5%Males
- 3.8%Females
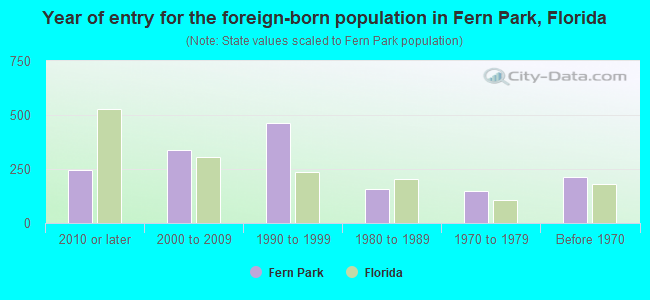
- Year of entry for the foreign-born population in Fern Park, Florida
- 2442010 or later
- 3372000 to 2009
- 4641990 to 1999
- 1571980 to 1989
- 1471970 to 1979
- 213Before 1970
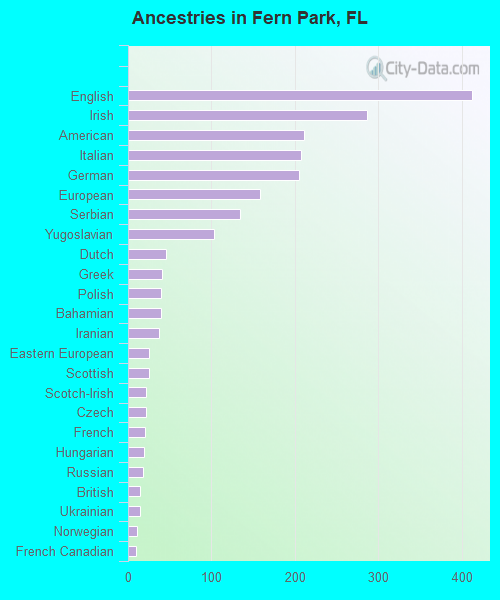
First ancestries reported:
- English: 412 (10.3%)
- Irish: 287 (7.2%)
- American: 211 (5.3%)
- Italian: 207 (5.2%)
- German: 205 (5.1%)
- European: 158 (4.0%)
- Serbian: 134 (3.4%)
- Yugoslavian: 103 (2.6%)
- Dutch: 46 (1.2%)
- Greek: 41 (1.0%)
- Polish: 40 (1.0%)
- Bahamian: 40 (1.0%)
- Iranian: 37 (0.9%)
- Eastern European: 25 (0.6%)
- Scottish: 25 (0.6%)
- Scotch-Irish: 22 (0.6%)
- Czech: 21 (0.5%)
- French: 20 (0.5%)
- Hungarian: 19 (0.5%)
- Russian: 18 (0.5%)
- British: 14 (0.4%)
- Ukrainian: 14 (0.4%)
- Norwegian: 11 (0.3%)
- French Canadian: 9 (0.2%)
Most common places of birth for foreign-born residents (%):
| Fern Park: | 15.8% (200) |
| Florida: | 1.8% (84,403) |
| Fern Park: | 15.3% (194) |
| Florida: | 0.2% (8,695) |
| Fern Park: | 9.0% (114) |
| Florida: | 22.0% (1,006,576) |
| Fern Park: | 7.1% (90) |
| Florida: | 1.3% (60,604) |
| Fern Park: | 6.8% (86) |
| Florida: | 0.3% (14,809) |
| Fern Park: | 6.6% (83) |
| Florida: | 3.0% (137,727) |
| Fern Park: | 5.1% (65) |
| Florida: | 5.7% (262,042) |
| Fern Park: | 3.2% (40) |
| Florida: | 0.2% (8,980) |
| Fern Park: | 2.9% (37) |
| Florida: | 0.2% (11,000) |
| Fern Park: | 2.6% (33) |
| Florida: | 2.4% (109,132) |
| Fern Park: | 2.4% (30) |
| Florida: | 2.1% (96,693) |
| Fern Park: | 2.2% (28) |
| Florida: | 6.5% (298,669) |
| Fern Park: | 2.1% (27) |
| Florida: | 0.7% (34,227) |
| Fern Park: | 2.1% (27) |
| Florida: | 1.2% (56,071) |
| Fern Park: | 1.8% (23) |
| Florida: | 0.3% (14,943) |
| Fern Park: | 1.8% (23) |
| Florida: | 0.2% (9,164) |
Place of birth for U.S.-born residents:
- This state: 3,136
- Other state: 3,480
- Northeast: 1,504
- Midwest: 906
- South: 896
- West: 111
90.1% of Fern Park residents lived in the same house 1 years ago.
Out of people who lived in different houses, 34.8% lived in this county.
Out of people who lived in different counties, 42.1% lived in Florida.
| Fern Park: | 90.1% |
| State average: | 86.3% |
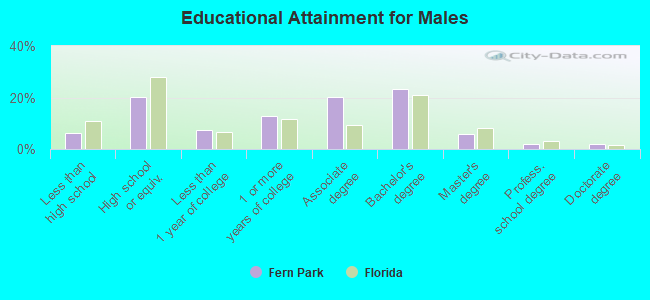
Education attainment for males 25 years and older:
- No schooling: 99
- Nursery to 4th grade: 0
- 5th and 6th grade: 0
- 7th and 8th grade: 5
- 9th grade: 0
- 10th grade: 3
- 11th grade: 7
- 12th grade, no diploma: 113
- High school graduate (or equivalency): 724
- Less than 1 year of college: 268
- Some college more than 1 year, no degree: 452
- Associate degree: 720
- Bachelor's degree: 829
- Master's degree: 208
- Professional school degree: 66
- Doctorate degree: 66
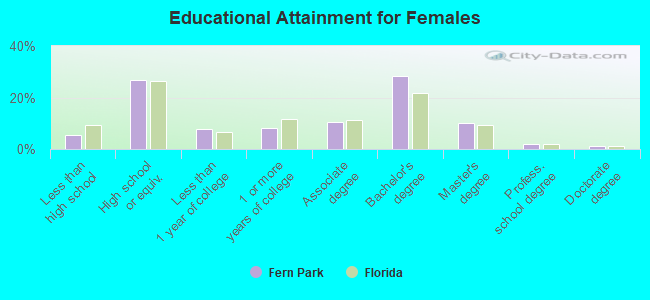
Education attainment for females 25 years and older:
- No schooling: 71
- Nursery to 4th grade: 0
- 5th and 6th grade: 0
- 7th and 8th grade: 0
- 9th grade: 14
- 10th grade: 8
- 11th grade: 1
- 12th grade, no diploma: 76
- High school graduate (or equivalency): 806
- Less than 1 year of college: 230
- Some college more than 1 year, no degree: 242
- Associate degree: 320
- Bachelor's degree: 857
- Master's degree: 302
- Professional school degree: 54
- Doctorate degree: 36


Housing units in structures:
- One, detached: 1,996
- One, attached: 673
- Two: 26
- 3 or 4: 311
- 5 to 9: 527
- 10 to 19: 167
- 20 to 49: 68
- 50 or more: 139
- Mobile homes: 38
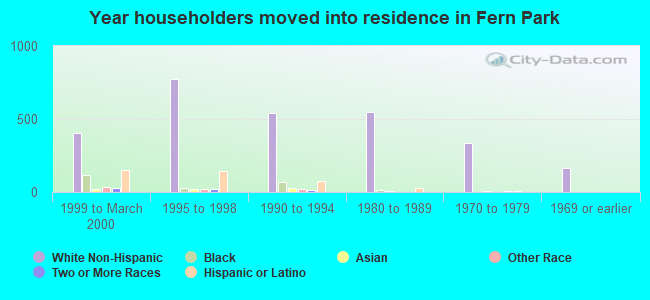
House/condo owner moved in on average 10 years ago
Renter moved in on average 4 years ago
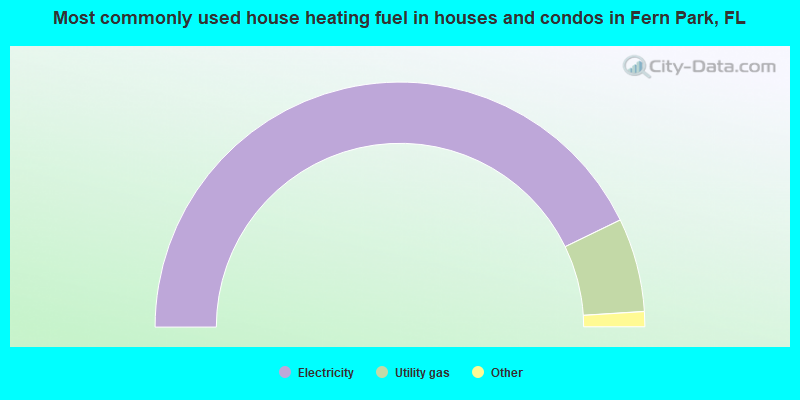
- 85.7%Electricity
- 12.4%Utility gas
- 0.8%No fuel used
- 0.7%Other fuel
- 0.4%Wood
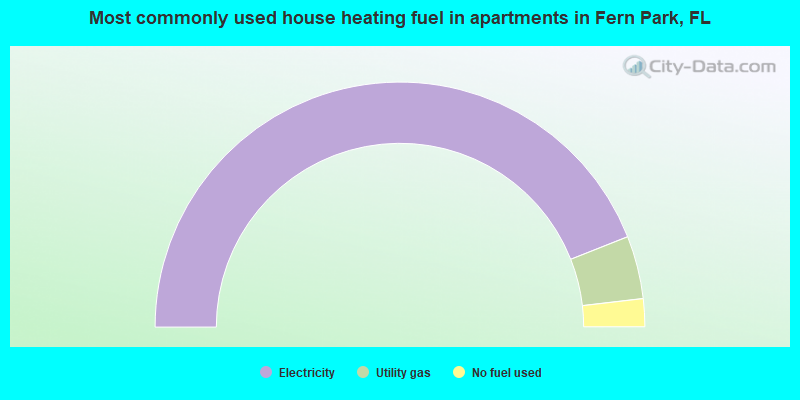
- 88.0%Electricity
- 8.3%Utility gas
- 3.7%No fuel used
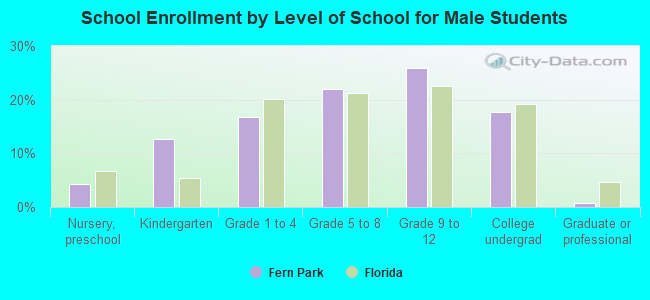
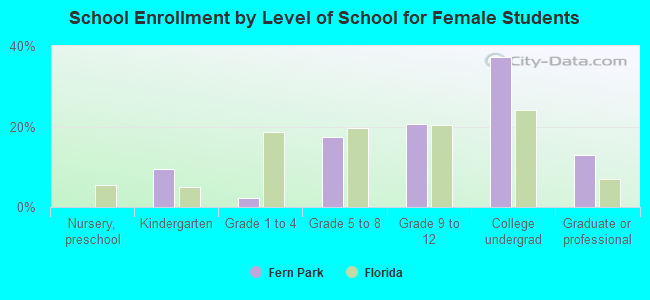
Private vs. public school enrollment:
| Here: | 28.4% |
| Florida: | 15.8% |
| Here: | 4.3% |
| Florida: | 12.9% |
| Here: | 14.4% |
| Florida: | 23.6% |