Fork, SC (South Carolina) Houses and Residents
| Fork: | $249,809 |
| South Carolina: | $254,600 |
Total population: 4,325 (Urban population: 0, Rural population: 3,993 (166 farm, 3,827 nonfarm))
Houses: 2,705 (1,680 occupied: 1,446 owner occupied, 234 renter occupied)
| % of renters here: | 14% |
| State: | 28% |
Housing density: 75 houses/condos per square mile
Median price asked for vacant for-sale houses and condos in 2022 in this county: $272,098.
Median contract rent in 2022: $700 (lower quartile is $496, upper quartile is $930)
Median rent asked for vacant for-rent units in 2022: $586
Median gross rent in Fork, SC in 2022: $937
Housing units in Fork with a mortgage: 473 (26 second mortgage, 54 home equity loan, 0 both second mortgage and home equity loan)
Houses without a mortgage: 272
Compare current foreclosures near Fork, SC:
| Photo | Address | Area | Beds / Baths | Price | Details |
|---|---|---|---|---|---|

|
#1
Kirk Dr
Seneca, SC 29678
|
1,256 sq. feet
|
1 baths 3 beds |
$184,300
|
show details |

|
#2
N Prince St
Anderson, SC 29624
|
- sq. feet
|
2 baths 2 beds |
$59,900
|
show details |

|
#3
Harris Bridge Rd
Anderson, SC 29621
|
2,618 sq. feet
|
3 baths 3 beds |
show details | |

|
#4
David St
Hartwell, GA 30643
|
- sq. feet
|
1 baths 3 beds |
show details | |

|
#5
Leftwich Ln
Anderson, SC 29621
|
1,527 sq. feet
|
2 baths 3 beds |
show details | |

|
#6
Georgia Dr
Hartwell, GA 30643
|
1,144 sq. feet
|
1 baths 3 beds |
show details | |

|
#7
Tefel West Dr
Hartwell, GA 30643
|
1,976 sq. feet
|
2 baths 4 beds |
show details | |

|
#8
Liberty Hill Rd
Hartwell, GA 30643
|
1,836 sq. feet
|
2 baths 3 beds |
show details | |

|
#9
Traditions Blvd
Anderson, SC 29625
|
- sq. feet
|
- baths 4 beds |
show details | |

|
#10
Sanders Rd
Central, SC 29630
|
1,025 sq. feet
|
1 baths 3 beds |
show details |
| Photo | Address | Area | Beds / Baths | Price | Details |
|---|---|---|---|---|---|

|
#11
Fabrica St
Clemson, SC 29631
|
1,123 sq. feet
|
1 baths 3 beds |
show details | |

|
#12
Baileys Garage Rd
Bowersville, GA 30516
|
1,321 sq. feet
|
2 baths 3 beds |
show details | |

|
#13
Faye Kight Cir
Hartwell, GA 30643
|
1,277 sq. feet
|
2 baths 3 beds |
show details | |

|
#14
Gordon St
Hartwell, GA 30643
|
1,148 sq. feet
|
1 baths 2 beds |
show details | |

|
#15
Atlanta Ave
Hartwell, GA 30643
|
1,248 sq. feet
|
2 baths 3 beds |
show details | |

|
#16
Felton St
Lavonia, GA 30553
|
1,121 sq. feet
|
1 baths 2 beds |
show details | |

|
#17
Rhodella Park St
Hartwell, GA 30643
|
1,514 sq. feet
|
2 baths 3 beds |
show details | |

|
#18
New Prospect Rd
Hartwell, GA 30643
|
2,010 sq. feet
|
2 baths 3 beds |
show details | |

|
#19
Sylvester Dr
Hartwell, GA 30643
|
1,152 sq. feet
|
2 baths 3 beds |
show details | |

|
#20
Bluebird Ln
Lavonia, GA 30553
|
2,076 sq. feet
|
1 baths 5 beds |
show details |
| Photo | Address | Area | Beds / Baths | Price | Details |
|---|---|---|---|---|---|

|
#21
Murray Ave
Hartwell, GA 30643
|
1,488 sq. feet
|
1 baths 2 beds |
show details | |

|
#22
Oak Crest Dr
Hartwell, GA 30643
|
1,569 sq. feet
|
2 baths 3 beds |
show details | |

|
#23
Springdale Dr
Hartwell, GA 30643
|
1,150 sq. feet
|
1 baths 3 beds |
show details | |

|
#24
Pleasant Hill Cir
Martin, GA 30557
|
2,261 sq. feet
|
1 baths - beds |
show details | |

|
#25
Nelle Dr
Hartwell, GA 30643
|
1,864 sq. feet
|
2 baths - beds |
show details | |

|
#26
Berry Ln
Anderson, SC 29624
|
- sq. feet
|
- baths - beds |
show details | |

|
#27
Sardis Church Rd
Hartwell, GA 30643
|
- sq. feet
|
- baths - beds |
show details | |

|
#28
Maida Watkins Rd
Westminster, SC 29693
|
- sq. feet
|
- baths - beds |
show details | |

|
#29
Uly White Rd
Hartwell, GA 30643
|
- sq. feet
|
- baths - beds |
show details | |

|
#30
Sardis Church Rd
Hartwell, GA 30643
|
- sq. feet
|
- baths - beds |
show details |
| Photo | Address | Area | Beds / Baths | Price | Details |
|---|---|---|---|---|---|

|
#31
N Holcomb Dr
Martin, GA 30557
|
- sq. feet
|
- baths - beds |
show details | |

|
#32
S Main St
Anderson, SC 29624
|
- sq. feet
|
- baths - beds |
show details | |

|
#33
Teasley Ln
Lavonia, GA 30553
|
- sq. feet
|
- baths - beds |
show details | |

|
#34
Sumter Ln, Apt O Pmb 2
Central, SC 29630
|
- sq. feet
|
- baths - beds |
show details | |

|
#35
Poole St Apt 104
Lavonia, GA 30553
|
- sq. feet
|
- baths - beds |
show details | |

|
#36
E Benson St Apt 71
Anderson, SC 29624
|
- sq. feet
|
- baths - beds |
show details | |

|
#37
Grand Summit Dr
Seneca, SC 29672
|
- sq. feet
|
- baths - beds |
show details | |

|
#38
Shelby Ln
Townville, SC 29689
|
- sq. feet
|
- baths - beds |
show details | |

|
#39
Wesleyan St
Lavonia, GA 30553
|
- sq. feet
|
- baths - beds |
show details | |

|
#40
Bowen Dr
Canon, GA 30520
|
- sq. feet
|
- baths - beds |
show details |
| Photo | Address | Area | Beds / Baths | Price | Details |
|---|---|---|---|---|---|

|
#41
Eighteen Mile Rd
Central, SC 29630
|
- sq. feet
|
- baths - beds |
show details | |

|
#42
Pleasant Hill Rd
Martin, GA 30557
|
- sq. feet
|
- baths - beds |
show details | |

|
#43
Samuel Camp Rd
Anderson, SC 29624
|
- sq. feet
|
- baths - beds |
show details | |

|
#44
Earle Rd
Central, SC 29630
|
- sq. feet
|
- baths - beds |
show details | |

|
#45
Maw Bridge Rd
Central, SC 29630
|
- sq. feet
|
- baths - beds |
show details | |

|
#46
Bruce Rd
Martin, GA 30557
|
- sq. feet
|
- baths - beds |
show details | |

|
#47
Jersey Rd
Hartwell, GA 30643
|
- sq. feet
|
- baths - beds |
show details | |

|
#48
Caudell Dr
Lavonia, GA 30553
|
- sq. feet
|
- baths - beds |
show details | |

|
#49
Phillip Lear Rd
Westminster, SC 29693
|
- sq. feet
|
- baths - beds |
show details | |

|
Check over 1 million property listings on Foreclosure.com!
|
browse all offers | |||

Household type by relationship:
Households: 184,362- In family households: 158,545 (35,075 male householders, 16,847 female householders)
37,725 spouses, 53,108 children (48,665 natural, 1,359 adopted, 3,084 stepchildren), 5,481 grandchildren, 1,620 brothers or sisters, 1,577 parents, foster children, 2,210 other relatives, 3,937 non-relatives
- In nonfamily households: 25,817 (10,006 male householders (8,208 living alone)), 11,901 female householders (10,518 living alone)), 3,910 nonrelatives
- In group quarters: 2,764 (1,617 institutionalized population)
25,827 married couples with children.
10,161 single-parent households (2,300 men, 7,861 women).
96.0% of residents of Fork speak English at home.
2.3% of residents speak Spanish at home (27% speak English very well, 31% speak English well, 42% speak English not well).
1.7% of residents speak other Indo-European language at home (100% speak English very well).
Foreign born population: 297 (5.9%)
(94.9% of them are naturalized citizens)
| Here: | 6.4 |
| State: | 6.4 |
| Here: | 4.3 |
| State: | 4.5 |
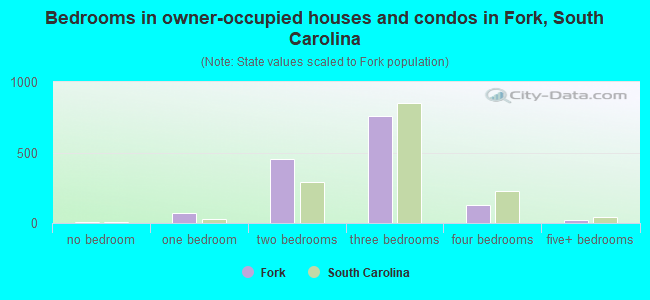
- Bedrooms in owner-occupied houses and condos in Fork, South Carolina
- 8no bedroom
- 711 bedroom
- 4572 bedrooms
- 7583 bedrooms
- 1304 bedrooms
- 225+ bedrooms
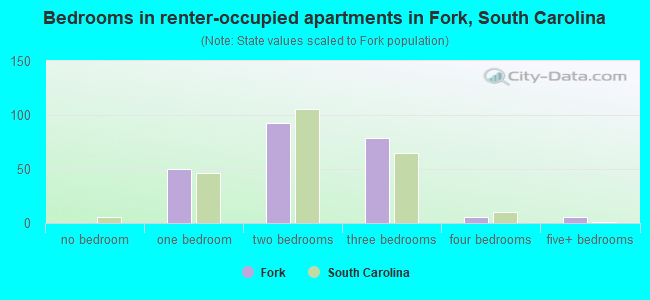
- Bedrooms in renter-occupied apartments in Fork, South Carolina
- 0no bedroom
- 501 bedroom
- 932 bedrooms
- 793 bedrooms
- 64 bedrooms
- 65+ bedrooms
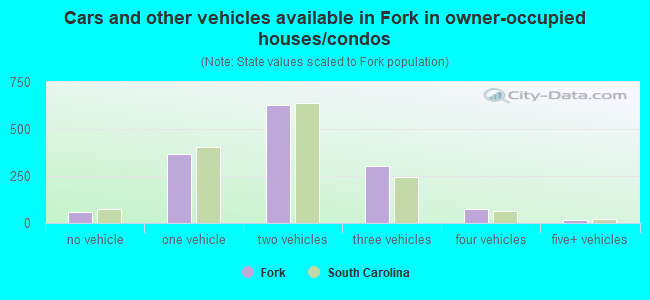
- Cars and other vehicles available in Fork in owner-occupied houses/condos
- 60no vehicle
- 3661 vehicle
- 6272 vehicles
- 3043 vehicles
- 734 vehicles
- 165+ vehicles
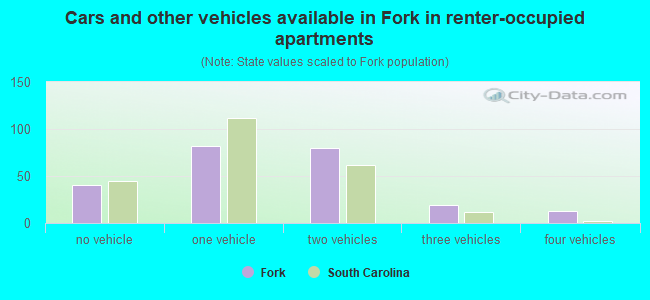
- Cars and other vehicles available in Fork in renter-occupied apartments
- 40no vehicle
- 821 vehicle
- 802 vehicles
- 193 vehicles
- 134 vehicles
- 05+ vehicles
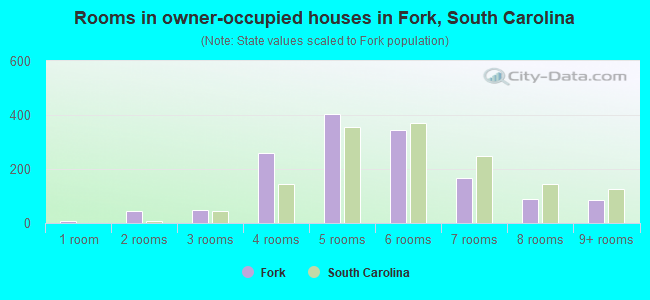
- Rooms in owner-occupied houses in Fork, South Carolina
- 81 room
- 432 rooms
- 473 rooms
- 2604 rooms
- 4045 rooms
- 3436 rooms
- 1667 rooms
- 898 rooms
- 869+ rooms
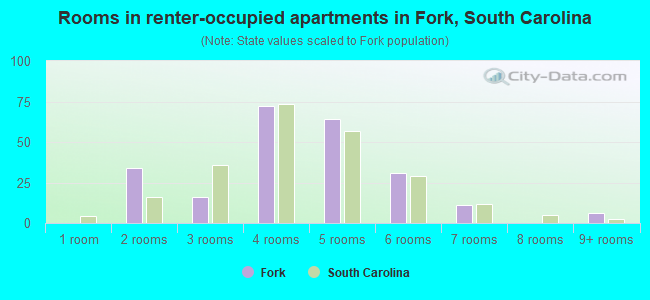
- Rooms in renter-occupied apartments in Fork, South Carolina
- 01 room
- 342 rooms
- 163 rooms
- 724 rooms
- 645 rooms
- 316 rooms
- 117 rooms
- 08 rooms
- 69+ rooms
Fork, SC household income distribution

- 7,350Less than $10,000
- 8,058$10,000 to $19,999
- 8,214$20,000 to $29,999
- 6,659$30,000 to $39,999
- 8,398$40,000 to $49,999
- 4,545$50,000 to $59,999
- 10,011$60,000 to $74,999
- 12,776$75,000 to $99,999
- 8,815$100,000 to $124,999
- 4,701$125,000 to $149,999
- 4,777$150,000 to $199,999
- 5,843$200,000 or more
Percentage of workers working in this county: 54.9%
Number of people working at home: 166 (7.1% of all workers)
Travel time to work (commute)
- Less than 5 minutes: 27
- 5 to 9 minutes: 38
- 10 to 14 minutes: 41
- 15 to 19 minutes: 195
- 20 to 24 minutes: 399
- 25 to 29 minutes: 185
- 30 to 34 minutes: 409
- 35 to 39 minutes: 42
- 40 to 44 minutes: 85
- 45 to 59 minutes: 291
- 60 to 89 minutes: 73
- 90 or more minutes: 48
Means of transportation to work:
- Drove a car alone: 1,511 (80.5%)
- Carpooled: 288 (15.3%)
- Motorcycle: 5 (0.3%)
- Walked: 29 (1.5%)
- Worked at home: 45 (2.4%)
- Year of entry for the foreign-born population in Fork, South Carolina
- 221995 to March 2000
- 01990 to 1994
- 81985 to 1989
- 01980 to 1984
- 01975 to 1979
- 171970 to 1974
- 141965 to 1969
- 38Before 1965
Most common places of birth for foreign-born residents (%):
| Fork: | 35.4% (35) |
| South Carolina: | 6.8% (7,873) |
| Fork: | 21.2% (21) |
| South Carolina: | 1.4% (1,599) |
| Fork: | 20.2% (20) |
| South Carolina: | 5.9% (6,890) |
| Fork: | 16.2% (16) |
| South Carolina: | 4.8% (5,512) |
| Fork: | 7.1% (7) |
| South Carolina: | 0.7% (770) |
Place of birth for U.S.-born residents:
- This state: 2,595
- Other state: 1,288
- Northeast: 216
- Midwest: 364
- South: 660
- West: 48
59% of Fork residents lived in the same house 5 years ago.
Out of people who lived in different houses, 47% lived in this county.
Out of people who lived in different counties, 40% lived in South Carolina.
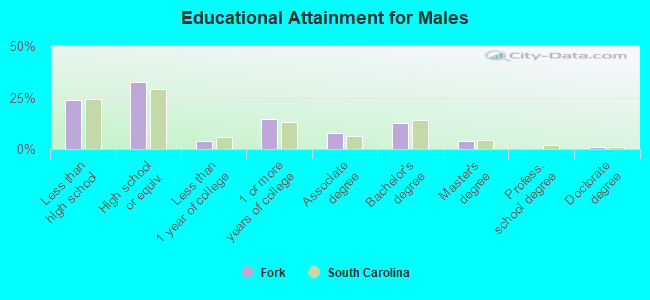
Education attainment for males 25 years and older:
- No schooling: 6
- Nursery to 4th grade: 15
- 5th and 6th grade: 31
- 7th and 8th grade: 27
- 9th grade: 66
- 10th grade: 76
- 11th grade: 75
- 12th grade, no diploma: 49
- High school graduate (or equivalency): 467
- Less than 1 year of college: 58
- Some college more than 1 year, no degree: 212
- Associate degree: 111
- Bachelor's degree: 181
- Master's degree: 58
- Professional school degree: 0
- Doctorate degree: 11
Education attainment for females 25 years and older:
- No schooling: 0
- Nursery to 4th grade: 4
- 5th and 6th grade: 17
- 7th and 8th grade: 60
- 9th grade: 71
- 10th grade: 88
- 11th grade: 76
- 12th grade, no diploma: 69
- High school graduate (or equivalency): 523
- Less than 1 year of college: 78
- Some college more than 1 year, no degree: 109
- Associate degree: 73
- Bachelor's degree: 142
- Master's degree: 78
- Professional school degree: 0
- Doctorate degree: 0

Housing units in structures:
- One, detached: 1,628
- One, attached: 8
- 3 or 4: 6
- Mobile homes: 1,009
- Boats, RVs, vans, etc.: 54
Median worth of mobile homes: $55,431
Housing units lacking complete kitchen facilities: 0.7%
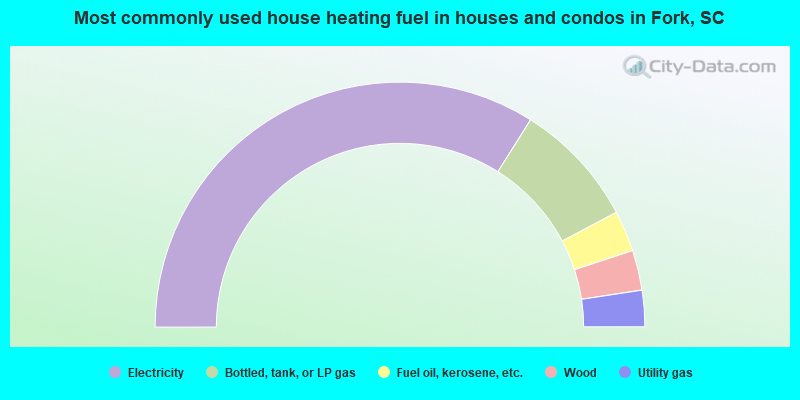
- 67.9%Electricity
- 16.6%Bottled, tank, or LP gas
- 5.4%Fuel oil, kerosene, etc.
- 5.3%Wood
- 4.8%Utility gas
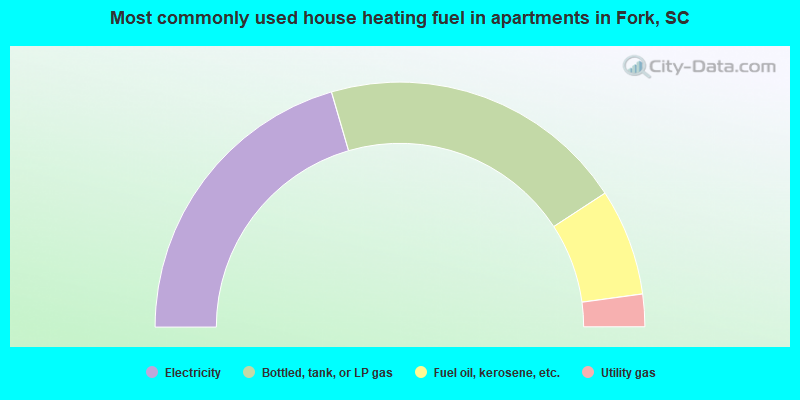
- 41.0%Electricity
- 40.6%Bottled, tank, or LP gas
- 14.1%Fuel oil, kerosene, etc.
- 4.3%Utility gas
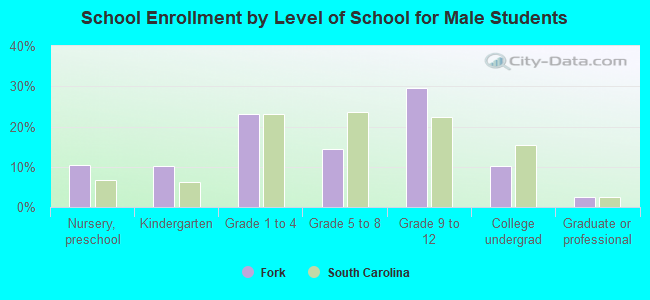
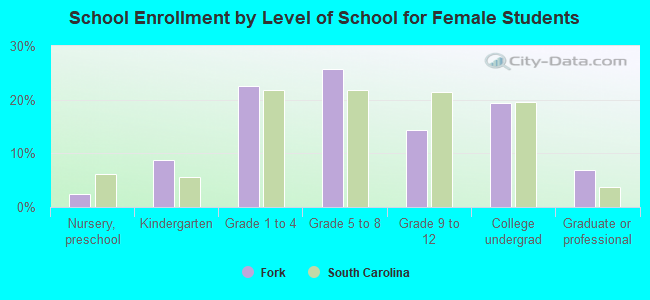
Private vs. public school enrollment:
| Here: | 6.1% |
| South Carolina: | 9.2% |
| Here: | 14.6% |
| South Carolina: | 8.1% |
| Here: | 9.6% |
| South Carolina: | 20.3% |