Georgetown, CA (California) Houses and Residents
| Georgetown: | $385,002 |
| California: | $715,900 |
Mean price in 2022:
Detached houses: $509,956
Here: $509,956 State: $988,808 Mobile homes: $178,751
Here: $178,751 State: $184,506
Total population: 2,367 (Urban population: 0, Rural population: 1,080 (17 farm, 1,063 nonfarm))
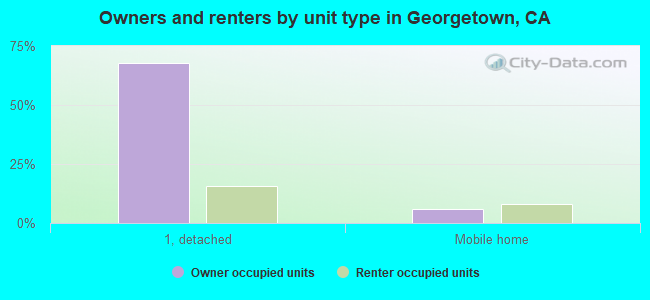
Houses: 1,304 (1,183 occupied: 1,012 owner occupied, 143 renter occupied)
| % of renters here: | 12% |
| State: | 44% |
Housing density: 316 houses/condos per square mile
Median price asked for vacant for-sale houses and condos in 2022 in this county: $493,466.
Median contract rent in 2022: $1,529
Median rent asked for vacant for-rent units in 2022: $1,847
Median gross rent in Georgetown, CA in 2022: $1,823
Housing units in Georgetown with a mortgage: 600 (23 second mortgage, 0 home equity loan, 25 both second mortgage and home equity loan)
Houses without a mortgage: 0
Median household income for houses/condos with a mortgage: $96,102
Median monthly housing costs: $1,683
Compare current foreclosures near Georgetown, CA:
| Photo | Address | Area | Beds / Baths | Price | Details |
|---|---|---|---|---|---|

|
#1
Hanson Hollow Rd
Georgetown, CA 95634
|
1,200 sq. feet
|
2 baths 2 beds |
show details | |

|
#2
Wentworth Springs Rd
Georgetown, CA 95634
|
2,192 sq. feet
|
3 baths 2 beds |
show details | |

|
#3
Pony Express Trl
Camino, CA 95709
|
1,320 sq. feet
|
1 baths 3 beds |
show details | |

|
#4
Fort Jim Rd
Placerville, CA 95667
|
2,300 sq. feet
|
2 baths 3 beds |
show details | |

|
#5
Dusty Ln
Placerville, CA 95667
|
2,357 sq. feet
|
3 baths 3 beds |
show details | |

|
#6
Pollock Ave
Pollock Pines, CA 95726
|
1,331 sq. feet
|
2 baths 3 beds |
show details | |

|
#7
Stellar Ln
Pollock Pines, CA 95726
|
- sq. feet
|
1 baths 2 beds |
show details | |

|
#8
Westley Rd
Placerville, CA 95667
|
1,540 sq. feet
|
2 baths 3 beds |
show details | |

|
#9
Marjorie Way
Pollock Pines, CA 95726
|
1,826 sq. feet
|
2 baths 3 beds |
show details | |

|
#10
Kingswood Ct
Grass Valley, CA 95949
|
4,534 sq. feet
|
4 baths 4 beds |
show details |
| Photo | Address | Area | Beds / Baths | Price | Details |
|---|---|---|---|---|---|

|
#11
Dublin Rd
El Dorado, CA 95623
|
1,266 sq. feet
|
2 baths 2 beds |
show details | |

|
#12
Tree Farm Rd
Colfax, CA 95713
|
1,512 sq. feet
|
2 baths 3 beds |
show details | |

|
#13
Mcavoy Ct
Auburn, CA 95603
|
1,931 sq. feet
|
2 baths 3 beds |
show details | |

|
#14
Mikkelsen Dr
Auburn, CA 95603
|
1,123 sq. feet
|
1 baths 3 beds |
show details | |

|
#15
Spanish Ravine Rd
Placerville, CA 95667
|
918 sq. feet
|
1 baths 3 beds |
show details | |

|
#16
Greenstone Rd
Placerville, CA 95667
|
3,800 sq. feet
|
4 baths 4 beds |
show details | |

|
#17
Tennis Way
Auburn, CA 95603
|
780 sq. feet
|
1 baths 2 beds |
show details | |

|
#18
Red Dog Dr
Camino, CA 95709
|
1,804 sq. feet
|
2 baths 3 beds |
show details | |

|
#19
Racetrack St
Auburn, CA 95603
|
1,850 sq. feet
|
1 baths 3 beds |
show details | |

|
#20
Shanley Rd
Auburn, CA 95603
|
2,842 sq. feet
|
4 baths 3 beds |
show details |
| Photo | Address | Area | Beds / Baths | Price | Details |
|---|---|---|---|---|---|

|
#21
Lincoln Way Apt 118
Auburn, CA 95603
|
1,156 sq. feet
|
1 baths 2 beds |
show details | |

|
#22
Terry Ln
Auburn, CA 95603
|
1,548 sq. feet
|
1 baths 3 beds |
show details | |

|
#23
Clay St
Placerville, CA 95667
|
1,433 sq. feet
|
2 baths 3 beds |
show details | |

|
#24
Springvale Rd
Placerville, CA 95667
|
1,565 sq. feet
|
1 baths 2 beds |
show details | |

|
#25
Woodsman Loop
Placerville, CA 95667
|
3,188 sq. feet
|
2 baths 2 beds |
show details | |

|
#26
Meadow View Ln
Auburn, CA 95602
|
1,484 sq. feet
|
2 baths 3 beds |
show details | |

|
#27
Valley View Dr
Auburn, CA 95603
|
1,413 sq. feet
|
2 baths 3 beds |
show details | |

|
#28
Nelson Rd
Camino, CA 95709
|
3,290 sq. feet
|
3 baths 3 beds |
show details | |

|
#29
Chana Dr
Auburn, CA 95603
|
2,514 sq. feet
|
2 baths 2 beds |
show details | |

|
#30
Sara Ln
Placerville, CA 95667
|
3,653 sq. feet
|
3 baths 4 beds |
show details |
| Photo | Address | Area | Beds / Baths | Price | Details |
|---|---|---|---|---|---|

|
#31
Odd Fellows
Diamond Springs, CA 95619
|
1,304 sq. feet
|
1 baths 2 beds |
show details | |

|
#32
Chestnut Ln
Placerville, CA 95667
|
1,272 sq. feet
|
2 baths 3 beds |
show details | |

|
#33
Grand View Ave
Colfax, CA 95713
|
1,100 sq. feet
|
2 baths 3 beds |
show details | |

|
#34
Sawka Dr
Auburn, CA 95603
|
4,208 sq. feet
|
3 baths 5 beds |
show details | |

|
#35
Panorama Dr
Placerville, CA 95667
|
1,300 sq. feet
|
1 baths 2 beds |
show details | |

|
#36
State Highway 49
Placerville, CA 95667
|
1,728 sq. feet
|
2 baths 4 beds |
show details | |

|
#37
Crooked Ln
Newcastle, CA 95658
|
1,898 sq. feet
|
2 baths 5 beds |
show details | |

|
#38
Nugget Ln
Placerville, CA 95667
|
1,584 sq. feet
|
2 baths 3 beds |
show details | |

|
#39
Carson Rd
Camino, CA 95709
|
2,628 sq. feet
|
2 baths 5 beds |
show details | |

|
#40
Sara Ln
Placerville, CA 95667
|
3,653 sq. feet
|
3 baths 4 beds |
show details |
| Photo | Address | Area | Beds / Baths | Price | Details |
|---|---|---|---|---|---|

|
#41
Chamberlain Ave
Auburn, CA 95603
|
720 sq. feet
|
1 baths 2 beds |
show details | |

|
#42
Indian Creek Rd
Placerville, CA 95667
|
1,736 sq. feet
|
2 baths 4 beds |
show details | |

|
#43
Campbell Dr
Auburn, CA 95602
|
3,458 sq. feet
|
3 baths 5 beds |
show details | |

|
#44
Campbell Dr
Auburn, CA 95602
|
1,914 sq. feet
|
2 baths 2 beds |
show details | |

|
#45
Norman Ln
Auburn, CA 95603
|
2,092 sq. feet
|
2 baths 3 beds |
show details | |

|
#46
Hannah Ln
Colfax, CA 95713
|
1,340 sq. feet
|
2 baths 3 beds |
show details | |

|
#47
Calloway Cir
Auburn, CA 95603
|
1,533 sq. feet
|
2 baths 3 beds |
show details | |

|
#48
Crooked Ln
Newcastle, CA 95658
|
1,898 sq. feet
|
2 baths 5 beds |
show details | |

|
#49
Caldwell Dr
Camino, CA 95709
|
713 sq. feet
|
1 baths 1 beds |
show details | |

|
Check over 1 million property listings on Foreclosure.com!
|
browse all offers | |||

Latest news about housing in Georgetown, CA collected exclusively by city-data.com from local newspapers, TV, and radio stations

 | The Great California Exodus Accelerates (1871 replies) |
| Summer Trip 2024-And Questions (20 replies) |
| Why do people still want to live in California? (1139 replies) |
| Is the SF Bay Area overrated? (811 replies) |
| Middle class pays higher tax in Texas than California (179 replies) |
| 2020 Census: Native Hawaiian and Pacific Islanders by Statistical Area (1 reply) |

Median year apartment built: 1974
Household type by relationship:
Households: 2,558- Male householders: 669 (233 living alone), Female householders: 505 (289 living alone)
543 spouses (543 opposite-sex spouses), 0 unmarried partners, (0 opposite-sex unmarried partners), 594 children (459 natural, 90 adopted, 45 stepchildren), 0 grandchildren, 16 brothers or sisters, 0 parents, 0 foster children, 7 other relatives, 93 non-relatives
- In group quarters: 128
Size of family households: 429 2-persons, 94 3-persons, 15 4-persons, 38 5-persons, 34 6-persons, 17 7-or-more-persons.
Size of nonfamily households: 482 1-person, 18 2-persons.
197 married couples with children.
83 single-parent households (0 men, 83 women).
97.9% of residents of Georgetown speak English at home.
1.2% of residents speak Spanish at home (76% speak English very well, 24% speak English well).
1.0% of residents speak other Indo-European language at home (100% speak English very well).
0.5% of residents speak Asian or Pacific Island language at home (45% speak English very well, 55% speak English well).
Foreign born population: 130 (5.1%)
(59.2% of them are naturalized citizens)
| Here: | 5.7 |
| State: | 6.0 |
| Here: | 5.2 |
| State: | 3.9 |
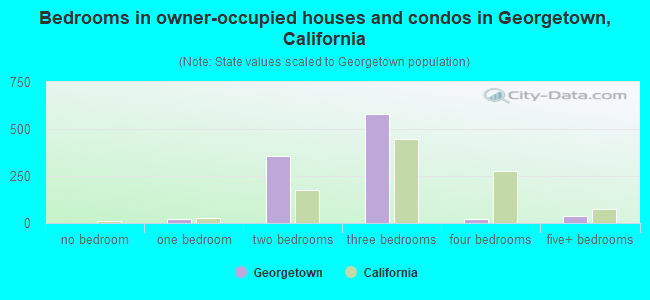
- Bedrooms in owner-occupied houses and condos in Georgetown, California
- 0no bedroom
- 211 bedroom
- 3542 bedrooms
- 5813 bedrooms
- 224 bedrooms
- 365+ bedrooms
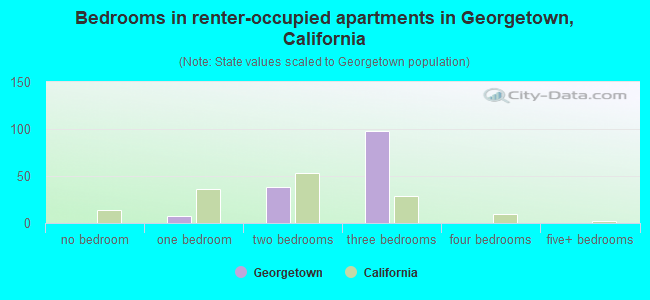
- Bedrooms in renter-occupied apartments in Georgetown, California
- 0no bedroom
- 71 bedroom
- 392 bedrooms
- 983 bedrooms
- 04 bedrooms
- 05+ bedrooms
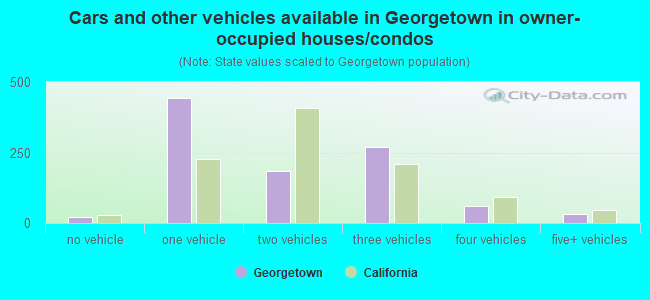
- Cars and other vehicles available in Georgetown in owner-occupied houses/condos
- 21no vehicle
- 4431 vehicle
- 1862 vehicles
- 2703 vehicles
- 614 vehicles
- 325+ vehicles
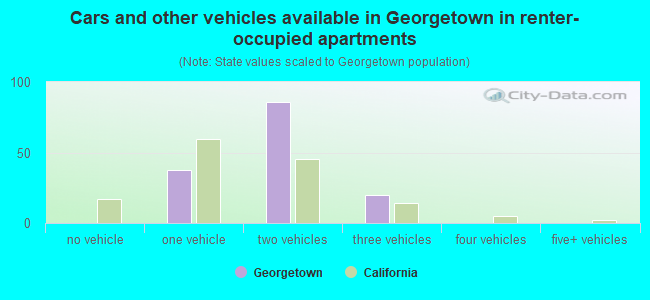
- Cars and other vehicles available in Georgetown in renter-occupied apartments
- 0no vehicle
- 381 vehicle
- 862 vehicles
- 203 vehicles
- 04 vehicles
- 05+ vehicles
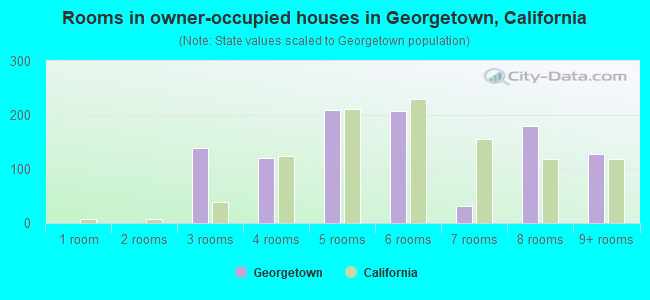
- Rooms in owner-occupied houses in Georgetown, California
- 01 room
- 02 rooms
- 1393 rooms
- 1214 rooms
- 2095 rooms
- 2076 rooms
- 317 rooms
- 1798 rooms
- 1289+ rooms
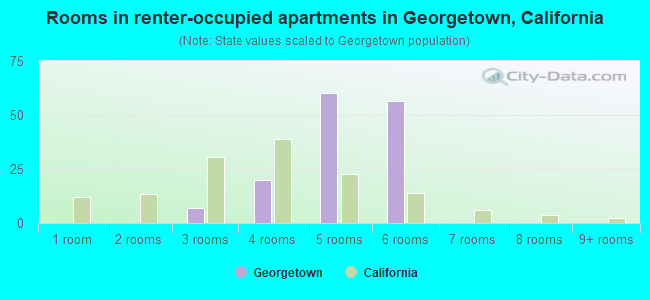
- Rooms in renter-occupied apartments in Georgetown, California
- 01 room
- 02 rooms
- 73 rooms
- 204 rooms
- 605 rooms
- 566 rooms
- 07 rooms
- 08 rooms
- 09+ rooms
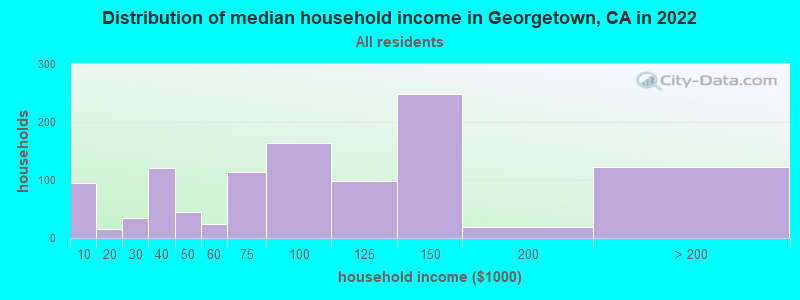
Georgetown, CA household income distribution

- 94Less than $10,000
- 15$10,000 to $19,999
- 34$20,000 to $29,999
- 120$30,000 to $39,999
- 45$40,000 to $49,999
- 24$50,000 to $59,999
- 113$60,000 to $74,999
- 164$75,000 to $99,999
- 99$100,000 to $124,999
- 249$125,000 to $149,999
- 19$150,000 to $199,999
- 122$200,000 or more
Home value of owner - occupied houses in 2022 in Georgetown, CA
-
- 37Less than $10,000
- 115$50,000 to $59,999
- 16$70,000 to $79,999
- 54$100,000 to $124,999
- 18$125,000 to $149,999
- 51$250,000 to $299,999
- 293$300,000 to $399,999
- 85$400,000 to $499,999
- 208$500,000 to $749,999
- 22$750,000 to $999,999
- 16$1,000,000 to $1,499,999
- 11$2,000,000 or more
Rent paid by renters in 2022 in Georgetown, CA
-
- 61$400 to $449
- 10$550 to $599
- 32$1,250 to $1,499
- 43$1,500 to $1,999
- 22No cash rent
Percentage of workers working in this county: 55.9%
Number of people working at home: 19 (2.7% of all workers)
Travel time to work (commute)
- Less than 5 minutes: 21
- 5 to 9 minutes: 79
- 10 to 14 minutes: 36
- 15 to 19 minutes: 53
- 20 to 24 minutes: 11
- 25 to 29 minutes: 0
- 30 to 34 minutes: 134
- 35 to 39 minutes: 10
- 40 to 44 minutes: 23
- 45 to 59 minutes: 102
- 60 to 89 minutes: 30
- 90 or more minutes: 189
Means of transportation to work:
- Drove a car alone: 326 (80.1%)
- Carpooled: 60 (14.7%)
- Walked: 8 (2.0%)
- Worked at home: 13 (3.2%)
- Unemployment by race in 2022
- Unemployment rate for White non-Hispanic residents
- 18.3%Males
- 8.5%Females
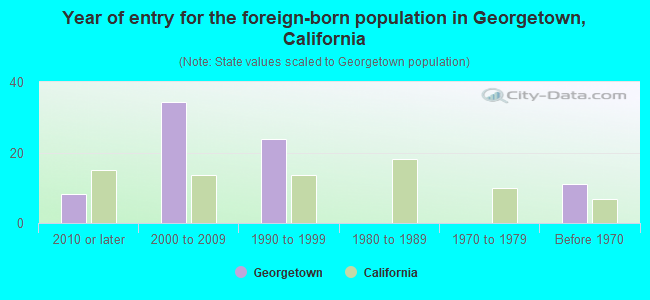
- Year of entry for the foreign-born population in Georgetown, California
- 82010 or later
- 342000 to 2009
- 241990 to 1999
- 01980 to 1989
- 01970 to 1979
- 11Before 1970
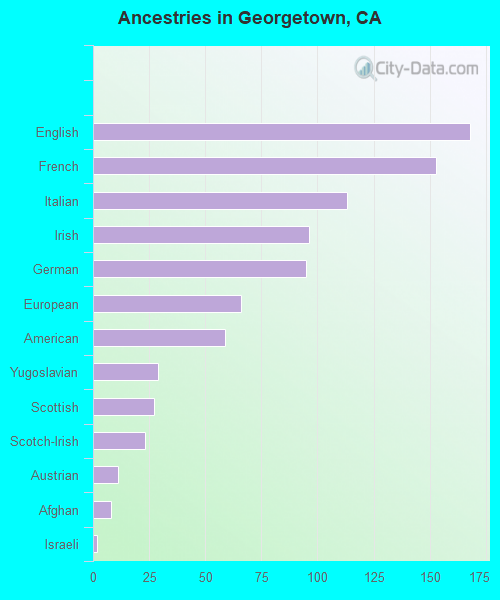
First ancestries reported:
- English: 168 (12.9%)
- French: 153 (11.8%)
- Italian: 113 (8.7%)
- Irish: 96 (7.4%)
- German: 95 (7.3%)
- European: 66 (5.1%)
- American: 59 (4.5%)
- Yugoslavian: 29 (2.2%)
- Scottish: 27 (2.1%)
- Scotch-Irish: 23 (1.8%)
- Austrian: 11 (0.8%)
- Afghan: 8 (0.6%)
- Israeli: 2 (0.2%)
Most common places of birth for foreign-born residents (%):
| Georgetown: | 28.4% (31) |
| California: | 6.6% (684,672) |
| Georgetown: | 14.7% (16) |
| California: | 0.2% (17,937) |
| Georgetown: | 12.8% (14) |
| California: | 1.2% (127,477) |
| Georgetown: | 9.2% (10) |
| California: | 0.5% (53,260) |
| Georgetown: | 7.3% (8) |
| California: | 0.1% (6,773) |
| Georgetown: | 6.4% (7) |
| California: | 37.2% (3,881,193) |
| Georgetown: | 5.5% (6) |
| California: | 7.8% (818,297) |
| Georgetown: | 4.6% (5) |
| California: | 0.4% (39,097) |
| Georgetown: | 3.7% (4) |
| California: | 0.2% (16,042) |
Place of birth for U.S.-born residents:
- This state: 1,754
- Other state: 635
- Northeast: 171
- Midwest: 258
- South: 139
- West: 68
95.9% of Georgetown residents lived in the same house 1 years ago.
Out of people who lived in different houses, 12.4% lived in this county.
Out of people who lived in different counties, 80.2% lived in California.
| Georgetown: | 95.9% |
| State average: | 88.9% |
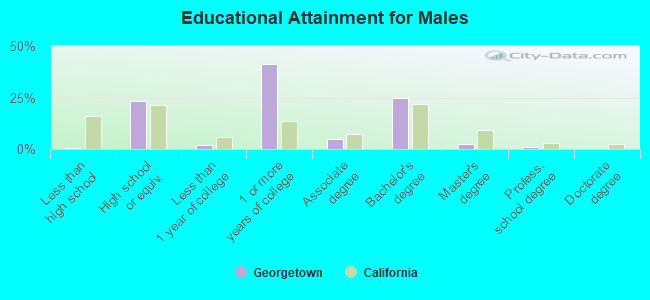
Education attainment for males 25 years and older:
- No schooling: 0
- Nursery to 4th grade: 0
- 5th and 6th grade: 6
- 7th and 8th grade: 0
- 9th grade: 0
- 10th grade: 0
- 11th grade: 0
- 12th grade, no diploma: 0
- High school graduate (or equivalency): 231
- Less than 1 year of college: 21
- Some college more than 1 year, no degree: 412
- Associate degree: 46
- Bachelor's degree: 244
- Master's degree: 24
- Professional school degree: 11
- Doctorate degree: 0
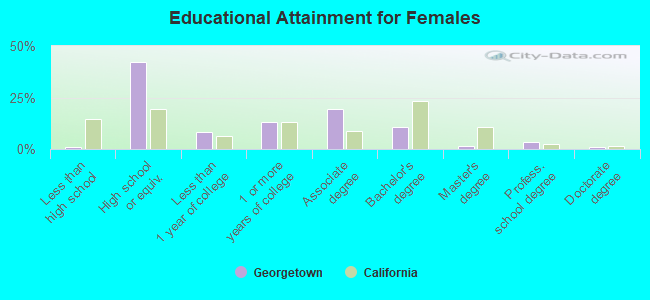
Education attainment for females 25 years and older:
- No schooling: 0
- Nursery to 4th grade: 0
- 5th and 6th grade: 7
- 7th and 8th grade: 0
- 9th grade: 0
- 10th grade: 4
- 11th grade: 0
- 12th grade, no diploma: 0
- High school graduate (or equivalency): 414
- Less than 1 year of college: 79
- Some college more than 1 year, no degree: 128
- Associate degree: 189
- Bachelor's degree: 107
- Master's degree: 16
- Professional school degree: 32
- Doctorate degree: 9


Housing units in structures:
- One, detached: 1,084
- One, attached: 8
- 20 to 49: 6
- Mobile homes: 206
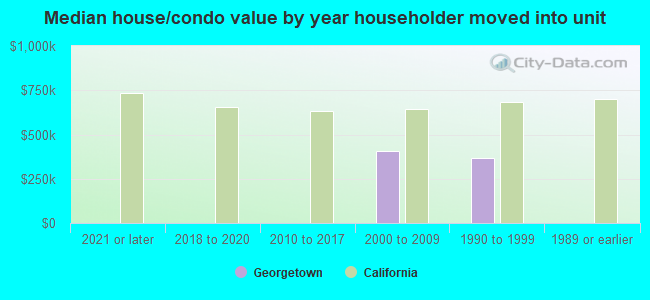
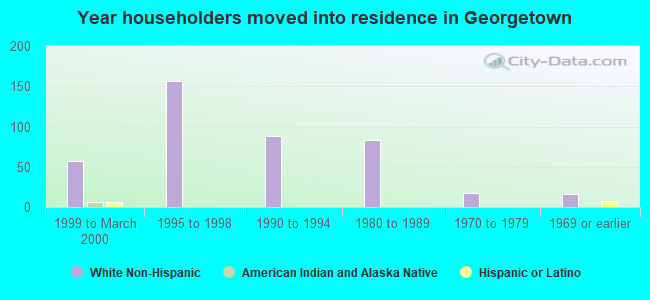
House/condo owner moved in on average 20 years ago
Renter moved in on average 5 years ago
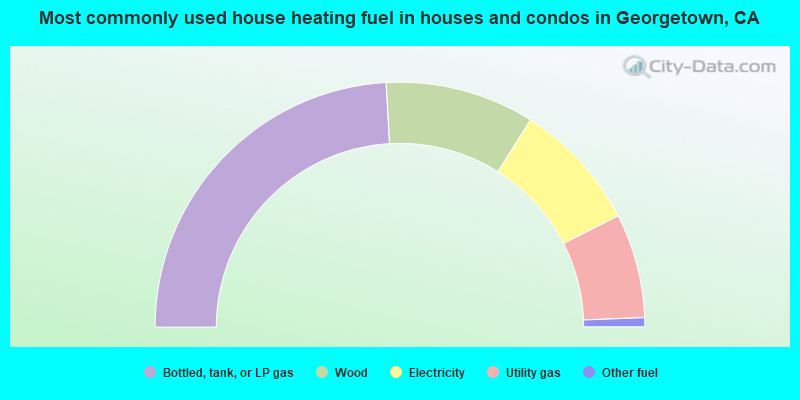
- 48.2%Bottled, tank, or LP gas
- 19.7%Wood
- 17.1%Electricity
- 13.8%Utility gas
- 1.2%Other fuel
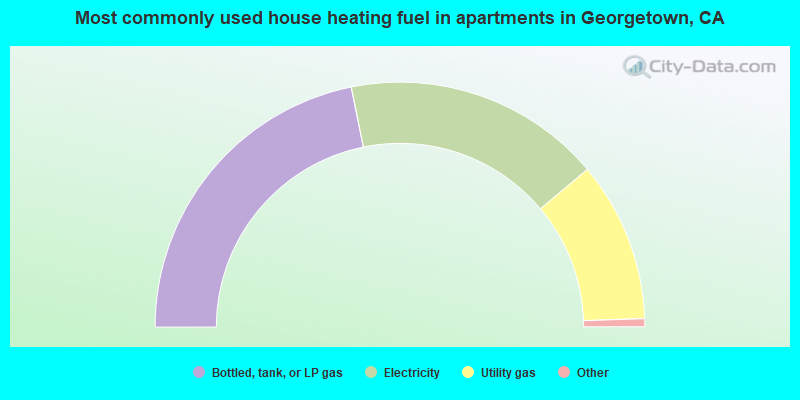
- 44.1%Bottled, tank, or LP gas
- 34.5%Electricity
- 21.4%Utility gas
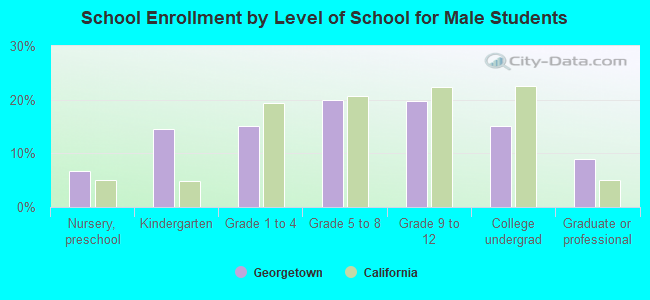
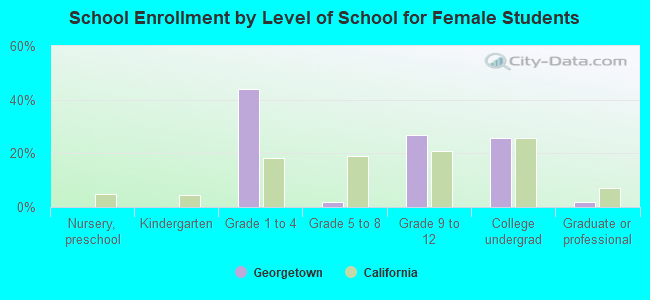
Private vs. public school enrollment:
| Here: | 45.3% |
| California: | 10.5% |
| Here: | 45.7% |
| California: | 8.5% |
| Here: | 0.0% |
| California: | 15.9% |