Jump to a detailed profile or search site with Google Custom Search

Glocester, RI (Rhode Island) Houses and Residents

Estimated median house or condo value in 2022: $438,568 (it was $148,500 in 2000)
Glocester:

$438,568
Rhode Island:

$383,900
Lower value quartile - upper value quartile: $336,486 - $522,226

Total population: 9,746 (Urban population: 1,608, Rural population: 8,340 (139 farm, 8,201 nonfarm))

Houses: 3,786 (3,559 occupied: 3,077 owner occupied, 482 renter occupied)

% of renters here:

14%
State:

37%

Housing density: 69 houses/condos per square mile

Median price asked for vacant for-sale houses and condos in 2022 in this county: $275,451.

Median contract rent in 2022: $1,185 (lower quartile is $701, upper quartile is $1,542)


Median rent asked for vacant for-rent units in 2022: $695


Median gross rent in Glocester, RI in 2022: $1,321

Housing units in Glocester with a mortgage: 2,080 (267 second mortgage, 360 home equity loan, 19 both second mortgage and home equity loan)
Houses without a mortgage: 481

Compare current foreclosures near Glocester, RI:

Check out more offers near Glocester, RI.
Powered by Foreclosure.com


Glocester, Rhode Island Age and Sex of Residents

Household type by relationship:

Households: 598,882
  • In family households: 482,061 (90,167 male householders, 59,524 female householders)
    98,652 spouses, 176,915 children (166,353 natural, 3,940 adopted, 6,622 stepchildren), 11,252 grandchildren, 7,716 brothers or sisters, 7,800 parents, foster children, 8,986 other relatives, 16,700 non-relatives
  • In nonfamily households: 116,821 (42,422 male householders (31,930 living alone)), 49,604 female householders (41,173 living alone)), 24,795 nonrelatives
  • In group quarters: 27,785 (9,688 institutionalized population)

87,776 married couples with children.
48,327 single-parent households (7,463 men, 40,864 women).

96.0% of residents of Glocester speak English at home.
0.9% of residents speak Spanish at home (75% speak English very well, 16% speak English well, 9% speak English not well).
3.1% of residents speak other Indo-European language at home (83% speak English very well, 15% speak English well, 2% speak English not well).

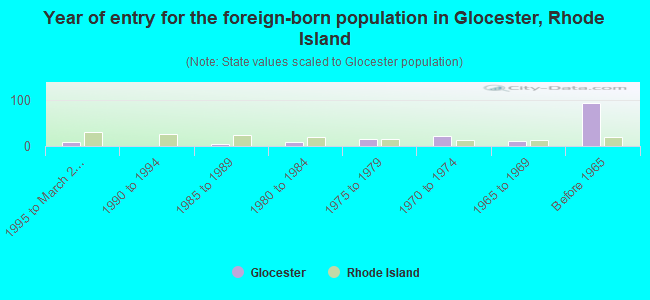
Foreign born population: 220 (2.1%)
(75.9% of them are naturalized citizens)

Median number of rooms in houses and condos:
Here:

6.1
State:

6.2

Median number of rooms in apartments
Here:

4.1
State:

4.1

Owner-occupied Renter-occupied
Bedrooms in owner-occupied houses and condos in Glocester, Rhode Island
  • Bedrooms in owner-occupied houses and condos in Glocester, Rhode Island
  • 8no bedroom
  • 1191 bedroom
  • 6182 bedrooms
  • 1,6813 bedrooms
  • 5054 bedrooms
  • 1465+ bedrooms
Bedrooms in renter-occupied apartments in Glocester, Rhode Island
  • Bedrooms in renter-occupied apartments in Glocester, Rhode Island
  • 0no bedroom
  • 1661 bedroom
  • 1502 bedrooms
  • 1103 bedrooms
  • 504 bedrooms
  • 65+ bedrooms
Owner-occupied Renter-occupied
Cars and other vehicles available in Glocester in owner-occupied houses/condos
  • Cars and other vehicles available in Glocester in owner-occupied houses/condos
  • 65no vehicle
  • 5481 vehicle
  • 1,4602 vehicles
  • 7723 vehicles
  • 1684 vehicles
  • 645+ vehicles
Cars and other vehicles available in Glocester in renter-occupied apartments
  • Cars and other vehicles available in Glocester in renter-occupied apartments
  • 27no vehicle
  • 2491 vehicle
  • 1752 vehicles
  • 233 vehicles
  • 84 vehicles
  • 05+ vehicles
Owner-occupied Renter-occupied
Rooms in owner-occupied houses in Glocester, Rhode Island
  • Rooms in owner-occupied houses in Glocester, Rhode Island
  • 81 room
  • 202 rooms
  • 573 rooms
  • 2914 rooms
  • 6635 rooms
  • 7786 rooms
  • 6007 rooms
  • 3658 rooms
  • 2959+ rooms
Rooms in renter-occupied apartments in Glocester, Rhode Island
  • Rooms in renter-occupied apartments in Glocester, Rhode Island
  • 01 room
  • 282 rooms
  • 1023 rooms
  • 1034 rooms
  • 1155 rooms
  • 756 rooms
  • 387 rooms
  • 118 rooms
  • 109+ rooms
Year house built
Breakdown of mean house values by ages of householders
Owners and renters by unit type in Glocester, RI
  • Glocester, RI household income distribution

  • Distribution of median household income in Glocester, RI in 2022
  • 26,937Less than $10,000
  • 35,666$10,000 to $19,999
  • 25,545$20,000 to $29,999
  • 28,465$30,000 to $39,999
  • 23,324$40,000 to $49,999
  • 26,808$50,000 to $59,999
  • 37,454$60,000 to $74,999
  • 52,107$75,000 to $99,999
  • 43,426$100,000 to $124,999
  • 33,032$125,000 to $149,999
  • 39,117$150,000 to $199,999
  • 38,429$200,000 or more

Percentage of workers working in this county: 75.9%
Number of people working at home: 831 (12.9% of all workers)

Travel time to work (commute)

  • Less than 5 minutes: 112
  • 5 to 9 minutes: 266
  • 10 to 14 minutes: 455
  • 15 to 19 minutes: 434
  • 20 to 24 minutes: 730
  • 25 to 29 minutes: 517
  • 30 to 34 minutes: 1,030
  • 35 to 39 minutes: 363
  • 40 to 44 minutes: 317
  • 45 to 59 minutes: 674
  • 60 to 89 minutes: 310
  • 90 or more minutes: 113

Means of transportation to work:

  • Drove a car alone: 4,629 (84.9%)
  • Carpooled: 582 (10.7%)
  • Bus or trolley bus: 19 (0.3%)
  • Motorcycle: 7 (0.1%)
  • Walked: 38 (0.7%)
  • Other means: 46 (0.8%)
  • Worked at home: 133 (2.4%)
Class of Workers in 2000
Year of entry for the foreign-born population in Glocester, Rhode Island
  • Year of entry for the foreign-born population in Glocester, Rhode Island
  • 81995 to March 2000
  • 01990 to 1994
  • 51985 to 1989
  • 81980 to 1984
  • 151975 to 1979
  • 221970 to 1974
  • 111965 to 1969
  • 93Before 1965
Ancestries in Glocester, RI

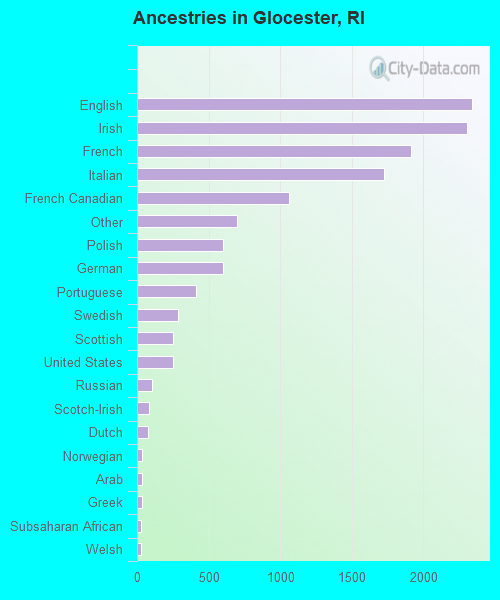
First ancestries reported:

  • English: 2,342 (18.1%)
  • Irish: 2,308 (17.8%)
  • French: 1,912 (14.8%)
  • Italian: 1,725 (13.3%)
  • French Canadian: 1,065 (8.2%)
  • Other: 702 (5.4%)
  • Polish: 603 (4.7%)
  • German: 600 (4.6%)
  • Portuguese: 412 (3.2%)
  • Swedish: 284 (2.2%)
  • Scottish: 254 (2.0%)
  • United States: 253 (2.0%)
  • Russian: 104 (0.8%)
  • Scotch-Irish: 86 (0.7%)
  • Dutch: 76 (0.6%)
  • Norwegian: 37 (0.3%)
  • Arab: 35 (0.3%)
  • Greek: 35 (0.3%)
  • Subsaharan African: 31 (0.2%)
  • Welsh: 26 (0.2%)
  • Czech: 21 (0.2%)
  • Ukrainian: 18 (0.1%)
  • Danish: 14 (0.1%)
  • Hungarian: 9 (0.07%)
  • Lithuanian: 9 (0.07%)

Most common places of birth for foreign-born residents (%):

Canada
Glocester:

21.0% (34)
Rhode Island:

3.4% (4,015)

United Kingdom
Glocester:

19.8% (32)
Rhode Island:

2.6% (3,120)

Germany
Glocester:

13.6% (22)
Rhode Island:

1.7% (1,982)

Portugal
Glocester:

10.5% (17)
Rhode Island:

17.6% (21,016)

France
Glocester:

8.0% (13)
Rhode Island:

0.6% (730)

Poland
Glocester:

4.9% (8)
Rhode Island:

1.2% (1,473)

Russia
Glocester:

4.9% (8)
Rhode Island:

0.8% (900)

El Salvador
Glocester:

4.9% (8)
Rhode Island:

1.0% (1,194)

Italy
Glocester:

4.3% (7)
Rhode Island:

3.8% (4,502)

Korea
Glocester:

4.3% (7)
Rhode Island:

1.2% (1,404)

Other Australian and New Zealand Subregion
Glocester:

3.7% (6)
Rhode Island:

0.0% (59)

Place of birth for U.S.-born residents:

  • This state: 7,927
  • Other state: 1,807
  • Northeast: 1,295
  • Midwest: 135
  • South: 228
  • West: 149

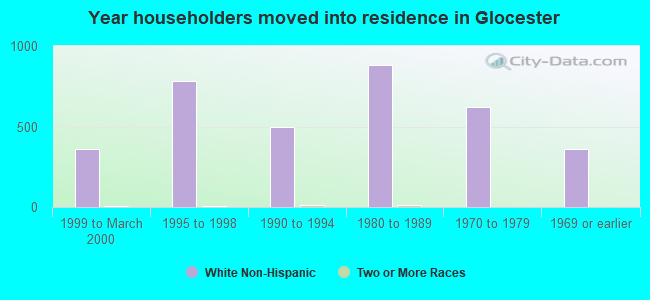
71% of Glocester residents lived in the same house 5 years ago.
   Out of people who lived in different houses, 76% lived in this county.
   Out of people who lived in different counties, 45% lived in Rhode Island.

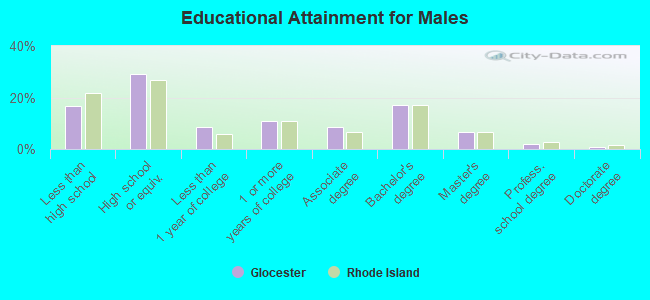
Education attainment for males 25 years and older:

  • No schooling: 13
  • Nursery to 4th grade: 0
  • 5th and 6th grade: 26
  • 7th and 8th grade: 104
  • 9th grade: 117
  • 10th grade: 87
  • 11th grade: 129
  • 12th grade, no diploma: 64
  • High school graduate (or equivalency): 939
  • Less than 1 year of college: 279
  • Some college more than 1 year, no degree: 345
  • Associate degree: 281
  • Bachelor's degree: 547
  • Master's degree: 211
  • Professional school degree: 59
  • Doctorate degree: 24
Educational Attainment for Males

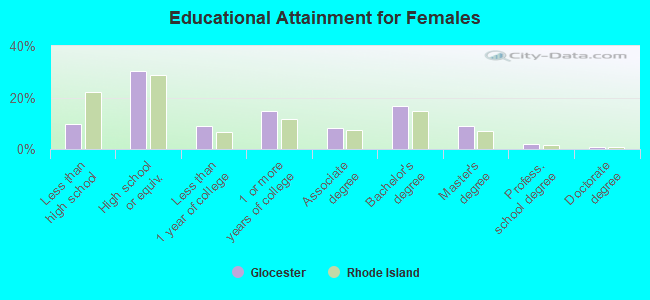
Education attainment for females 25 years and older:

  • No schooling: 15
  • Nursery to 4th grade: 0
  • 5th and 6th grade: 18
  • 7th and 8th grade: 62
  • 9th grade: 55
  • 10th grade: 80
  • 11th grade: 22
  • 12th grade, no diploma: 74
  • High school graduate (or equivalency): 1,024
  • Less than 1 year of college: 306
  • Some college more than 1 year, no degree: 496
  • Associate degree: 275
  • Bachelor's degree: 565
  • Master's degree: 305
  • Professional school degree: 63
  • Doctorate degree: 22
Educational Attainment for Females
Glocester marital status for males
Glocester marital status for females

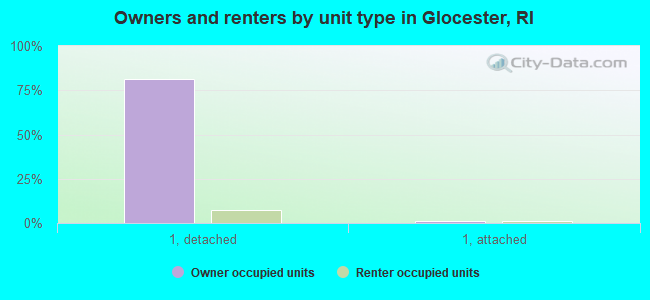
Housing units in structures:

  • One, detached: 3,372
  • One, attached: 84
  • Two: 75
  • 3 or 4: 21
  • 5 to 9: 66
  • 10 to 19: 20
  • 20 to 49: 6
  • Mobile homes: 142

Median worth of mobile homes: $84,172

Housing units lacking complete plumbing facilities: 0.8%

Housing units lacking complete kitchen facilities: 0.4%
Year householders moved into residence in Glocester
Houses and condos Apartments
Most commonly used house heating fuel in houses and condos in Glocester, RI
  • 83.2%Fuel oil, kerosene, etc.
  • 6.1%Bottled, tank, or LP gas
  • 5.7%Wood
  • 2.9%Electricity
  • 1.2%Utility gas
  • 0.6%Other fuel
  • 0.2%Solar energy
Most commonly used house heating fuel in apartments in Glocester, RI
  • 73.2%Fuel oil, kerosene, etc.
  • 12.4%Bottled, tank, or LP gas
  • 9.3%Electricity
  • 3.5%Wood
  • 1.5%Utility gas

Private vs. public school enrollment:

Students in private schools in grades 1 to 8 (elementary and middle school): 76
Here:

5.6%
Rhode Island:

12.6%

Students in private schools in grades 9 to 12 (high school): 30
Here:

4.2%
Rhode Island:

12.7%

Students in private undergraduate colleges: 67
Here:

18.9%
Rhode Island:

43.8%
School Enrollment by Level of School for Male Students
School Enrollment by Level of School for Female Students
Age and Sex of Sensory-Disabled Noninstitutionalized Residents
Age and Sex of Physically-Disabled Noninstitutionalized Residents
Age and Sex of Mentally-Disabled Noninstitutionalized Residents
Age and Sex of Self-Care Disabled Noninstitutionalized Residents
Age and Sex of Go-Outside-Home Disabled Noninstitutionalized Residents
Age and Sex of Noninstitutionalized Residents with Employment Disability