Green Bay, WI (Wisconsin) Houses and Residents
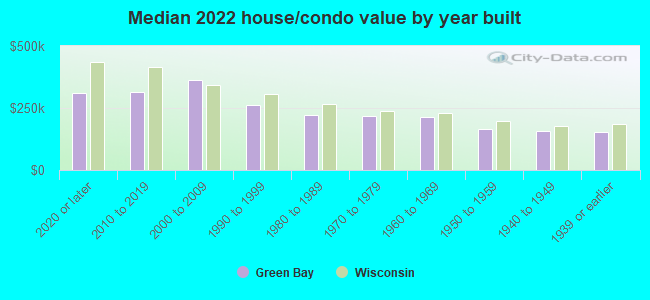
| Green Bay: | $192,900 |
| Wisconsin: | $252,800 |
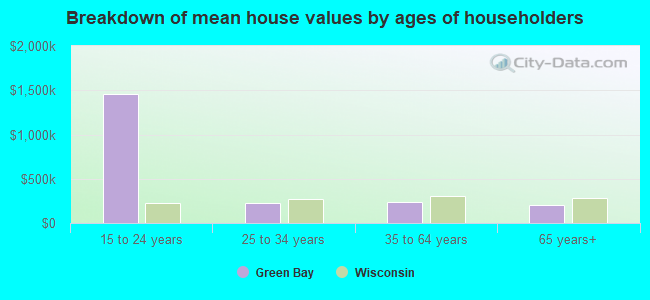
Mean price in 2022:
Detached houses: $214,730
Here: $214,730 State: $308,468 Townhouses or other attached units: $182,606
Here: $182,606 State: $265,873 In 2-unit structures: $184,387
Here: $184,387 State: $203,667 In 5-or-more-unit structures: $154,654
Here: $154,654 State: $280,537 Mobile homes: $75,061
Here: $75,061 State: $79,042
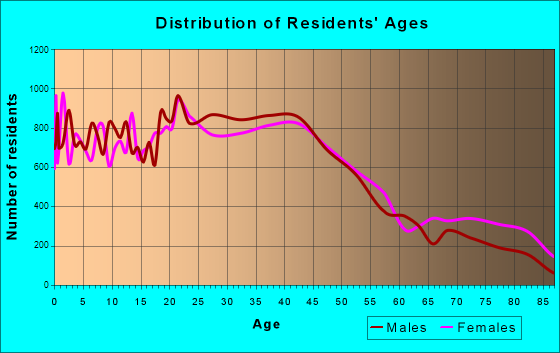
Total population: 104,891 (Urban population: 101,776, Rural population: 592 (all nonfarm))
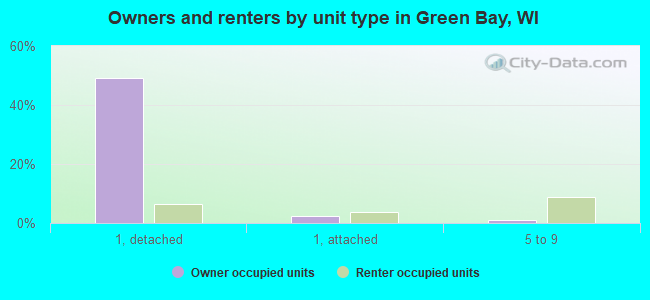
Houses: 46,881 (45,689 occupied: 24,710 owner occupied, 20,979 renter occupied)
| % of renters here: | 46% |
| State: | 32% |
Housing density: 1,069 houses/condos per square mile
Median price asked for vacant for-sale houses and condos in 2022: $206,941.
Median contract rent in 2022: $709 (lower quartile is $590, upper quartile is $838)
Median rent asked for vacant for-rent units in 2022: $767
Median gross rent in Green Bay, WI in 2022: $798
Housing units in Green Bay with a mortgage: 15,886 (2,191 second mortgage, 0 home equity loan, 1,355 both second mortgage and home equity loan)
Houses without a mortgage: 917
Median household income for houses/condos with a mortgage: $78,659
Median household income for apartments without a mortgage: $55,536
Median monthly housing costs: $898
Compare current foreclosures in Green Bay, WI:
| Photo | Address | Area | Beds / Baths | Price | Details |
|---|---|---|---|---|---|

|
#1
Ontario Rd
Green Bay, WI 54311
|
1,786 sq. feet
|
3 baths 3 beds |
show details | |

|
#2
S Norwood Ave
Green Bay, WI 54304
|
- sq. feet
|
- baths - beds |
$36,900
|
show details |

|
#3
Sumac Pl
Green Bay, WI 54313
|
4,704 sq. feet
|
5 baths 5 beds |
show details | |

|
#4
University Ave
Green Bay, WI 54302
|
1,718 sq. feet
|
2 baths 4 beds |
show details | |

|
#5
3rd St
Green Bay, WI 54304
|
- sq. feet
|
- baths - beds |
$60,000
|
show details |

|
#6
Wirtz Ave
Green Bay, WI 54304
|
- sq. feet
|
- baths - beds |
$15,000
|
show details |

|
#7
S Jackson St
Green Bay, WI 54301
|
- sq. feet
|
- baths - beds |
show details | |

|
#8
W Point Rd
Green Bay, WI 54313
|
- sq. feet
|
- baths - beds |
show details | |

|
#9
Salisbury St, Apt 5
Green Bay, WI 54302
|
- sq. feet
|
- baths - beds |
show details | |

|
#10
Peters St
Green Bay, WI 54302
|
- sq. feet
|
- baths - beds |
show details |
| Photo | Address | Area | Beds / Baths | Price | Details |
|---|---|---|---|---|---|

|
#11
Rachel Dr
Green Bay, WI 54311
|
- sq. feet
|
- baths - beds |
show details | |

|
#12
Anchor Dr
Green Bay, WI 54313
|
- sq. feet
|
- baths - beds |
show details | |

|
#13
Overlook Ct
Green Bay, WI 54313
|
- sq. feet
|
- baths - beds |
show details | |

|
#14
Fellows Dr
Green Bay, WI 54303
|
- sq. feet
|
- baths - beds |
show details | |

|
#15
Sherry Ln
Green Bay, WI 54302
|
- sq. feet
|
- baths - beds |
show details | |

|
#16
Roland Ln Apt 15
Green Bay, WI 54303
|
- sq. feet
|
- baths - beds |
show details | |

|
#17
Cedar Rdg
Green Bay, WI 54313
|
- sq. feet
|
- baths - beds |
show details | |

|
#18
Laurel Ln
Green Bay, WI 54311
|
- sq. feet
|
- baths - beds |
show details | |

|
#19
Appian Way
Green Bay, WI 54302
|
- sq. feet
|
- baths - beds |
show details | |

|
#20
Kenhill Dr
Green Bay, WI 54313
|
- sq. feet
|
- baths - beds |
show details |
| Photo | Address | Area | Beds / Baths | Price | Details |
|---|---|---|---|---|---|

|
#21
12th Ave
Green Bay, WI 54303
|
- sq. feet
|
- baths - beds |
show details | |

|
#22
E Walnut St, Apt 310
Green Bay, WI 54301
|
- sq. feet
|
- baths - beds |
show details | |

|
#23
Division St
Green Bay, WI 54303
|
- sq. feet
|
- baths - beds |
show details | |

|
#24
Shawano Ave Apt 5
Green Bay, WI 54303
|
- sq. feet
|
- baths - beds |
show details | |

|
#25
Clement St # 8
Green Bay, WI 54302
|
- sq. feet
|
- baths - beds |
show details | |

|
#26
N Broadway
Green Bay, WI 54303
|
- sq. feet
|
- baths - beds |
show details | |

|
#27
Rockwell Rd
Green Bay, WI 54313
|
- sq. feet
|
- baths - beds |
show details | |

|
#28
August St
Green Bay, WI 54302
|
- sq. feet
|
- baths - beds |
show details | |

|
#29
N Platten St
Green Bay, WI 54303
|
- sq. feet
|
- baths - beds |
show details | |

|
#30
Crooks St
Green Bay, WI 54301
|
- sq. feet
|
- baths - beds |
show details |
| Photo | Address | Area | Beds / Baths | Price | Details |
|---|---|---|---|---|---|

|
#31
S Huron Rd # 12
Green Bay, WI 54311
|
- sq. feet
|
- baths - beds |
show details | |

|
#32
Eastman Ave Apt 1
Green Bay, WI 54302
|
- sq. feet
|
- baths - beds |
show details | |

|
#33
Redstone Trl Apt 6
Green Bay, WI 54313
|
- sq. feet
|
- baths - beds |
show details | |

|
#34
Manitowoc Rd Apt 202
Green Bay, WI 54302
|
- sq. feet
|
- baths - beds |
show details | |

|
#35
Schoen St # C
Green Bay, WI 54302
|
- sq. feet
|
- baths - beds |
show details | |

|
#36
Bellevue St Lot 394
Green Bay, WI 54302
|
- sq. feet
|
- baths - beds |
show details | |

|
#37
Beech Tree Dr
Green Bay, WI 54304
|
- sq. feet
|
- baths - beds |
show details | |

|
#38
S Military Ave # 131
Green Bay, WI 54303
|
- sq. feet
|
- baths - beds |
show details | |

|
#39
E Shore Dr
Green Bay, WI 54302
|
- sq. feet
|
- baths - beds |
show details | |

|
#40
Moraine Way Apt 44
Green Bay, WI 54303
|
- sq. feet
|
- baths - beds |
show details |
| Photo | Address | Area | Beds / Baths | Price | Details |
|---|---|---|---|---|---|

|
#41
Alice Dr Apt F
Green Bay, WI 54304
|
- sq. feet
|
- baths - beds |
show details | |

|
#42
Edison St Apt 4
Green Bay, WI 54302
|
- sq. feet
|
- baths - beds |
show details | |

|
#43
Laverne Dr
Green Bay, WI 54311
|
- sq. feet
|
- baths - beds |
show details | |

|
#44
Maple Hills Dr
Green Bay, WI 54313
|
- sq. feet
|
- baths - beds |
show details | |

|
#45
Memorial Dr Apt 212
Green Bay, WI 54303
|
- sq. feet
|
- baths - beds |
show details | |

|
#46
Mccormick St
Green Bay, WI 54301
|
- sq. feet
|
- baths - beds |
show details | |

|
#47
E River Dr
Green Bay, WI 54301
|
- sq. feet
|
- baths - beds |
show details | |

|
#48
Shawano Ave Apt 2
Green Bay, WI 54303
|
- sq. feet
|
- baths - beds |
show details | |

|
#49
Bufflehead Ln
Green Bay, WI 54311
|
- sq. feet
|
- baths - beds |
show details | |

|
Check over 1 million property listings on Foreclosure.com!
|
browse all offers | |||


 | Condos, townhomes in Kenosha (10 replies) |
| Green Bay is #1 place to live (15 replies) |
| Looking for a home to rent in De Pere, Appleton, or Green Bay (3 replies) |
| Green Bay or Janesville (53 replies) |
| Best apartments in Green Bay area (2 replies) |
| Green Bay Apartments? (4 replies) |
Median year apartment built: 1978
Household type by relationship:
Households: 106,096- Male householders: 23,025 (9,564 living alone), Female householders: 22,664 (7,765 living alone)
17,436 spouses (17,334 opposite-sex spouses), 4,090 unmarried partners, (3,648 opposite-sex unmarried partners), 29,441 children (27,322 natural, 1,176 adopted, 943 stepchildren), 1,462 grandchildren, 399 brothers or sisters, 1,394 parents, 58 foster children, 746 other relatives, 2,886 non-relatives
- In group quarters: 2,495
Size of family households: 11,392 2-persons, 4,484 3-persons, 5,349 4-persons, 2,014 5-persons, 707 6-persons, 679 7-or-more-persons.
Size of nonfamily households: 17,329 1-person, 3,344 2-persons, 317 3-persons, 74 7-or-more-persons.
13,977 married couples with children.
8,208 single-parent households (1,596 men, 6,612 women).
83.4% of residents of Green Bay speak English at home.
11.8% of residents speak Spanish at home (41% speak English very well, 23% speak English well, 27% speak English not well, 10% don't speak English at all).
1.0% of residents speak other Indo-European language at home (83% speak English very well, 5% speak English well, 10% speak English not well, 1% don't speak English at all).
2.8% of residents speak Asian or Pacific Island language at home (43% speak English very well, 29% speak English well, 26% speak English not well, 3% don't speak English at all).
1.1% of residents speak other language at home (64% speak English very well, 16% speak English well, 12% speak English not well, 8% don't speak English at all).
Foreign born population: 8,165 (7.7%)
(24.7% of them are naturalized citizens)
| Here: | 6.2 |
| State: | 6.5 |
| Here: | 4.1 |
| State: | 4.1 |
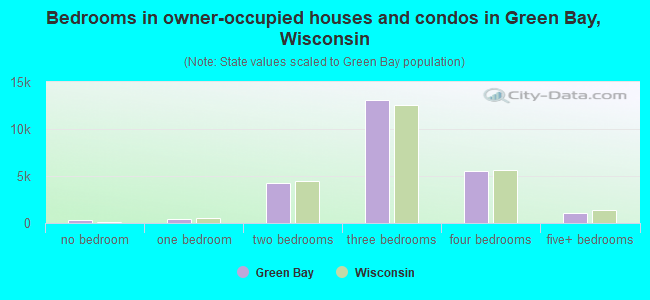
- Bedrooms in owner-occupied houses and condos in Green Bay, Wisconsin
- 352no bedroom
- 4071 bedroom
- 4,2262 bedrooms
- 13,0723 bedrooms
- 5,5614 bedrooms
- 1,0925+ bedrooms
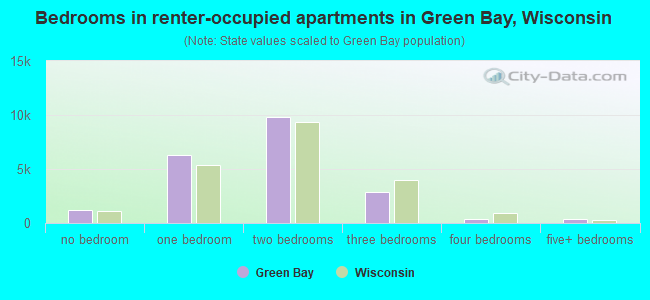
- Bedrooms in renter-occupied apartments in Green Bay, Wisconsin
- 1,250no bedroom
- 6,2911 bedroom
- 9,8032 bedrooms
- 2,8773 bedrooms
- 3424 bedrooms
- 4165+ bedrooms
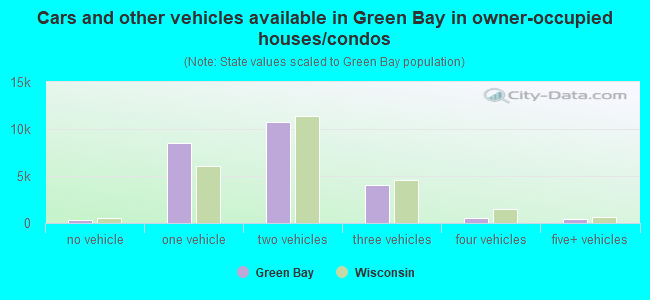
- Cars and other vehicles available in Green Bay in owner-occupied houses/condos
- 319no vehicle
- 8,5471 vehicle
- 10,7382 vehicles
- 4,0873 vehicles
- 5594 vehicles
- 4605+ vehicles
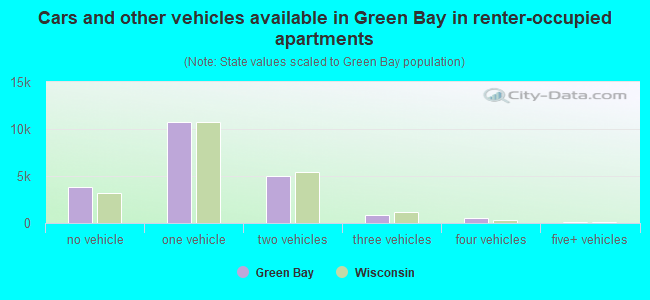
- Cars and other vehicles available in Green Bay in renter-occupied apartments
- 3,844no vehicle
- 10,7571 vehicle
- 4,9842 vehicles
- 8283 vehicles
- 4854 vehicles
- 815+ vehicles
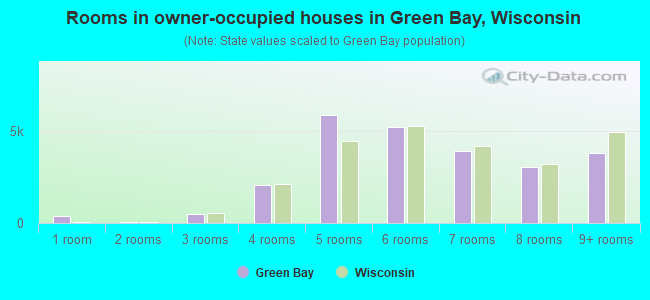
- Rooms in owner-occupied houses in Green Bay, Wisconsin
- 3521 room
- 342 rooms
- 4783 rooms
- 2,0314 rooms
- 5,8475 rooms
- 5,2226 rooms
- 3,8917 rooms
- 3,0398 rooms
- 3,8169+ rooms
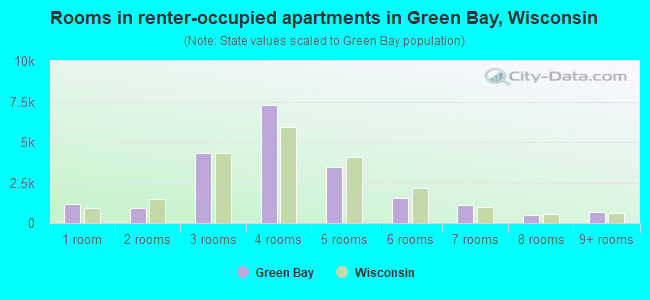
- Rooms in renter-occupied apartments in Green Bay, Wisconsin
- 1,2021 room
- 9012 rooms
- 4,3113 rooms
- 7,3014 rooms
- 3,4535 rooms
- 1,5326 rooms
- 1,0957 rooms
- 5028 rooms
- 6829+ rooms
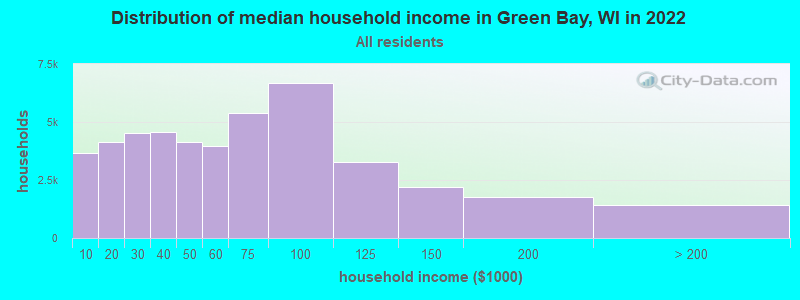
Green Bay, WI household income distribution

- 3,643Less than $10,000
- 4,136$10,000 to $19,999
- 4,529$20,000 to $29,999
- 4,570$30,000 to $39,999
- 4,139$40,000 to $49,999
- 3,946$50,000 to $59,999
- 5,397$60,000 to $74,999
- 6,672$75,000 to $99,999
- 3,267$100,000 to $124,999
- 2,192$125,000 to $149,999
- 1,771$150,000 to $199,999
- 1,427$200,000 or more
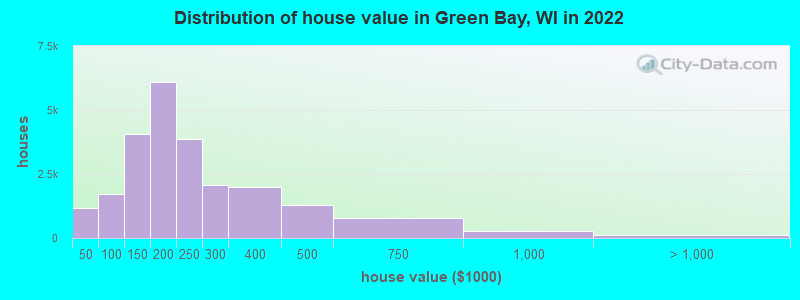
Home value of owner - occupied houses in 2022 in Green Bay, WI
-
- 155Less than $10,000
- 280$10,000 to $14,999
- 393$15,000 to $19,999
- 145$20,000 to $24,999
- 35$25,000 to $29,999
- 4$30,000 to $34,999
- 8$35,000 to $39,999
- 130$40,000 to $49,999
- 157$50,000 to $59,999
- 81$60,000 to $69,999
- 271$70,000 to $79,999
- 381$80,000 to $89,999
- 705$90,000 to $99,999
- 1,948$100,000 to $124,999
- 2,107$125,000 to $149,999
- 3,975$150,000 to $174,999
- 2,131$175,000 to $199,999
- 3,848$200,000 to $249,999
- 2,064$250,000 to $299,999
- 2,001$300,000 to $399,999
- 1,302$400,000 to $499,999
- 793$500,000 to $749,999
- 255$750,000 to $999,999
- 22$1,000,000 to $1,499,999
- 1$1,500,000 to $1,999,999
- 98$2,000,000 or more
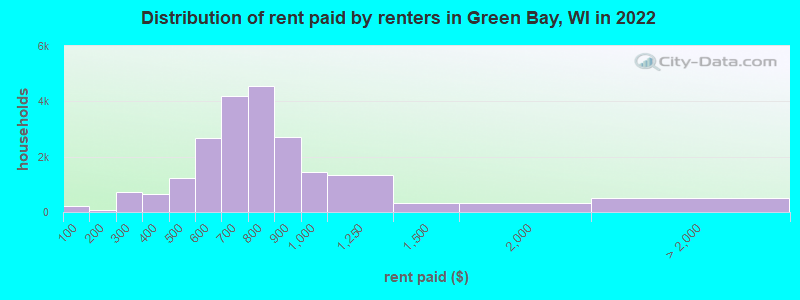
Rent paid by renters in 2022 in Green Bay, WI
-
- 204Less than $100
- 54$100 to $149
- 29$150 to $199
- 732$250 to $299
- 332$300 to $349
- 316$350 to $399
- 589$400 to $449
- 630$450 to $499
- 500$500 to $549
- 2,179$550 to $599
- 1,378$600 to $649
- 2,831$650 to $699
- 2,550$700 to $749
- 1,995$750 to $799
- 2,704$800 to $899
- 1,435$900 to $999
- 1,354$1,000 to $1,249
- 336$1,250 to $1,499
- 313$1,500 to $1,999
- 518No cash rent
Percentage of workers working in this county: 92.3%
Number of people working at home: 4,355 (8.6% of all workers)
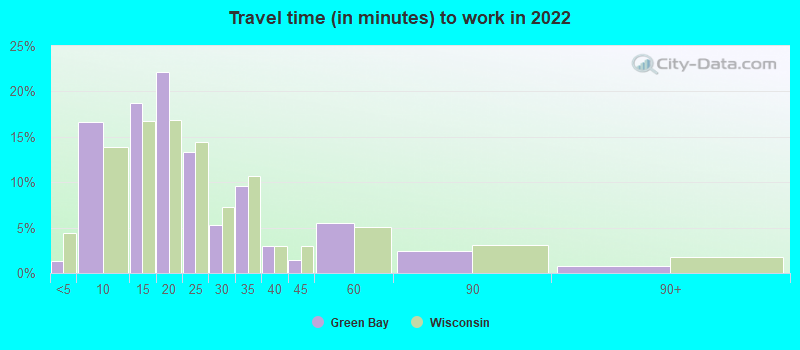
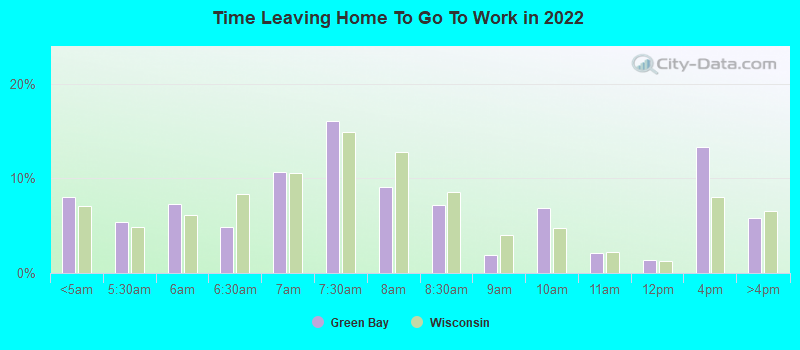
Travel time to work (commute)
- Less than 5 minutes: 725
- 5 to 9 minutes: 9,270
- 10 to 14 minutes: 10,865
- 15 to 19 minutes: 12,581
- 20 to 24 minutes: 4,451
- 25 to 29 minutes: 1,141
- 30 to 34 minutes: 2,630
- 35 to 39 minutes: 550
- 40 to 44 minutes: 202
- 45 to 59 minutes: 2,598
- 60 to 89 minutes: 641
- 90 or more minutes: 459
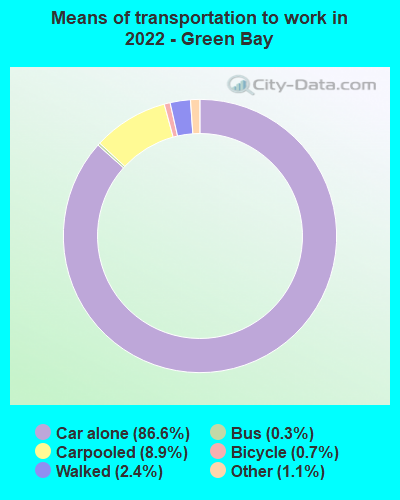
Means of transportation to work:
- Drove a car alone: 50,968 (80.6%)
- Carpooled: 5,237 (8.3%)
- Bus: 169 (0.3%)
- Taxi: 661 (1.0%)
- Bicycle: 400 (0.6%)
- Walked: 1,416 (2.2%)
- Worked at home: 4,355 (6.9%)
- Unemployment by race in 2022
- Unemployment rate for White non-Hispanic residents
- 2.8%Males
- 6.7%Females
- Unemployment rate for Black residents
- 20.6%Males
- 8.5%Females
- Unemployment rate for American Indian and Alaska Native residents
- 6.4%Males
- 7.7%Females
- Unemployment rate for Asian residents
- 3.0%Males
- 4.4%Females
- Unemployment rate for other race residents
- 4.0%Males
- 4.7%Females
- Unemployment rate for two or more race residents
- 2.5%Males
- 1.7%Females
- Unemployment rate for Hispanic or Latino residents
- 2.8%Males
- 2.6%Females
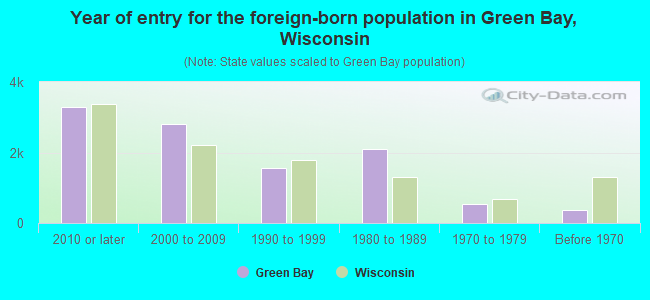
- Year of entry for the foreign-born population in Green Bay, Wisconsin
- 3,2992010 or later
- 2,8032000 to 2009
- 1,5471990 to 1999
- 2,0951980 to 1989
- 5341970 to 1979
- 374Before 1970
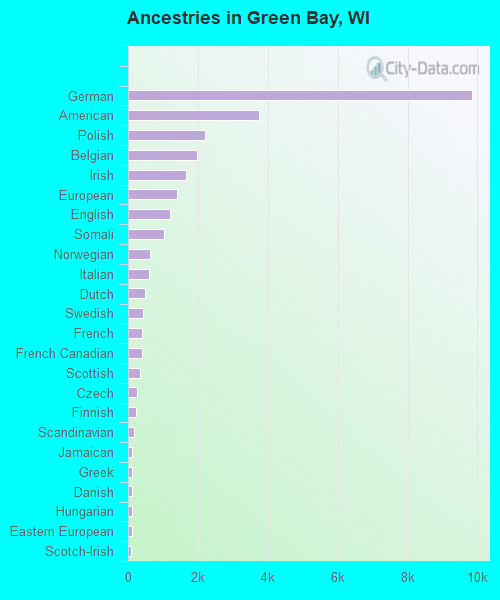
First ancestries reported:
- German: 9,840 (19.4%)
- American: 3,753 (7.4%)
- Polish: 2,195 (4.3%)
- Belgian: 1,981 (3.9%)
- Irish: 1,662 (3.3%)
- European: 1,413 (2.8%)
- English: 1,201 (2.4%)
- Somali: 1,039 (2.1%)
- Norwegian: 625 (1.2%)
- Italian: 613 (1.2%)
- Dutch: 482 (1.0%)
- Swedish: 437 (0.9%)
- French: 410 (0.8%)
- French Canadian: 392 (0.8%)
- Scottish: 341 (0.7%)
- Czech: 266 (0.5%)
- Finnish: 216 (0.4%)
- Scandinavian: 162 (0.3%)
- Jamaican: 120 (0.2%)
- Greek: 111 (0.2%)
- Danish: 111 (0.2%)
- Hungarian: 104 (0.2%)
- Eastern European: 102 (0.2%)
- Scotch-Irish: 96 (0.2%)
- Ukrainian: 71 (0.1%)
- African: 70 (0.1%)
- Swiss: 67 (0.1%)
- Canadian: 66 (0.1%)
- Afghan: 65 (0.1%)
- Austrian: 62 (0.1%)
- Czechoslovakian: 44 (0.09%)
- Croatian: 43 (0.08%)
- Kenyan: 43 (0.08%)
- Welsh: 26 (0.05%)
- Lithuanian: 25 (0.05%)
- Luxembourger: 24 (0.05%)
- Slavic: 24 (0.05%)
- Northern European: 20 (0.04%)
- Ethiopian: 19 (0.04%)
- British: 17 (0.03%)
- Syrian: 16 (0.03%)
- Bulgarian: 13 (0.03%)
- Lebanese: 11 (0.02%)
- Slovak: 11 (0.02%)
- Egyptian: 8 (0.02%)
- Latvian: 8 (0.02%)
- Russian: 5 (0.01%)
- Armenian: 4 (0.01%)
- Portuguese: 4 (0.01%)
Most common places of birth for foreign-born residents (%):
| Green Bay: | 51.7% (4,912) |
| Wisconsin: | 29.5% (87,182) |
| Green Bay: | 8.1% (766) |
| Wisconsin: | 0.5% (1,537) |
| Green Bay: | 6.0% (573) |
| Wisconsin: | 4.3% (12,681) |
| Green Bay: | 2.8% (263) |
| Wisconsin: | 8.0% (23,594) |
| Green Bay: | 2.5% (235) |
| Wisconsin: | 0.7% (2,133) |
| Green Bay: | 2.3% (215) |
| Wisconsin: | 3.3% (9,655) |
| Green Bay: | 2.2% (210) |
| Wisconsin: | 1.1% (3,231) |
| Green Bay: | 2.2% (208) |
| Wisconsin: | 1.5% (4,400) |
| Green Bay: | 2.1% (196) |
| Wisconsin: | 1.8% (5,320) |
| Green Bay: | 2.0% (186) |
| Wisconsin: | 3.1% (9,280) |
| Green Bay: | 1.8% (169) |
| Wisconsin: | 0.5% (1,621) |
| Green Bay: | 1.6% (155) |
| Wisconsin: | 2.3% (6,747) |
| Green Bay: | 1.6% (152) |
| Wisconsin: | 0.1% (357) |
| Green Bay: | 1.5% (146) |
| Wisconsin: | 1.0% (2,903) |
| Green Bay: | 1.5% (146) |
| Wisconsin: | 0.7% (1,960) |
Place of birth for U.S.-born residents:
- This state: 73,387
- Other state: 22,089
- Northeast: 1,458
- Midwest: 11,505
- South: 4,251
- West: 4,875
85.2% of Green Bay residents lived in the same house 1 years ago.
Out of people who lived in different houses, 40.4% lived in this county.
Out of people who lived in different counties, 66.7% lived in Wisconsin.
| Green Bay: | 85.2% |
| State average: | 87.7% |
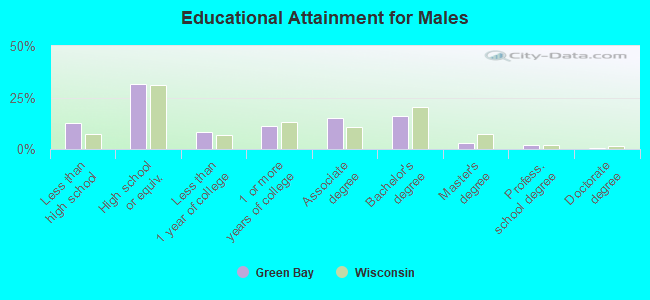
Education attainment for males 25 years and older:
- No schooling: 1,067
- Nursery to 4th grade: 99
- 5th and 6th grade: 21
- 7th and 8th grade: 453
- 9th grade: 416
- 10th grade: 207
- 11th grade: 395
- 12th grade, no diploma: 1,730
- High school graduate (or equivalency): 11,022
- Less than 1 year of college: 2,826
- Some college more than 1 year, no degree: 3,938
- Associate degree: 5,346
- Bachelor's degree: 5,591
- Master's degree: 1,096
- Professional school degree: 695
- Doctorate degree: 93
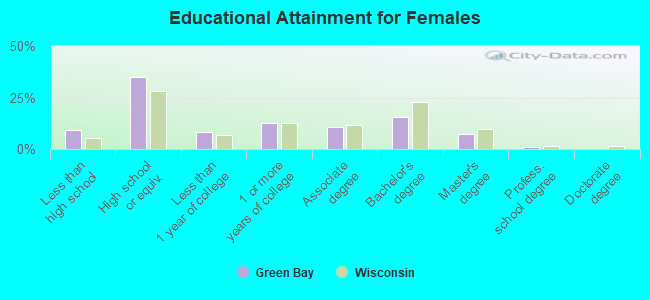
Education attainment for females 25 years and older:
- No schooling: 753
- Nursery to 4th grade: 491
- 5th and 6th grade: 372
- 7th and 8th grade: 6
- 9th grade: 316
- 10th grade: 274
- 11th grade: 413
- 12th grade, no diploma: 663
- High school graduate (or equivalency): 12,700
- Less than 1 year of college: 3,029
- Some college more than 1 year, no degree: 4,685
- Associate degree: 3,876
- Bachelor's degree: 5,722
- Master's degree: 2,621
- Professional school degree: 436
- Doctorate degree: 72
Housing units in structures:
- One, detached: 25,931
- One, attached: 2,838
- Two: 3,831
- 3 or 4: 3,089
- 5 to 9: 4,483
- 10 to 19: 2,070
- 20 to 49: 1,888
- 50 or more: 2,505
- Mobile homes: 246
Median worth of mobile homes: $19,163
Housing units lacking complete kitchen facilities in 2022: 1.0%
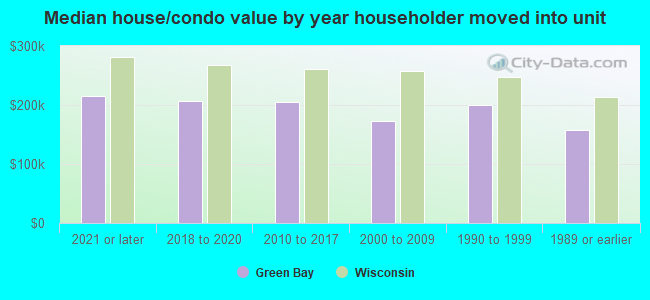
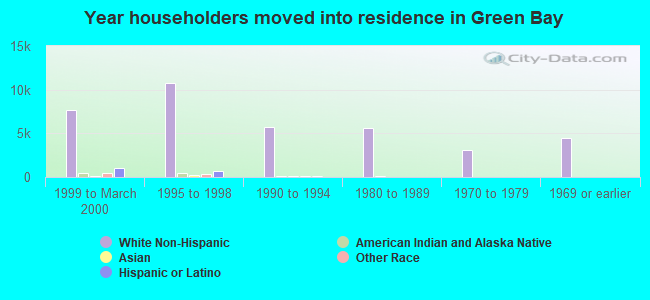
House/condo owner moved in on average 13 years ago
Renter moved in on average 3 years ago
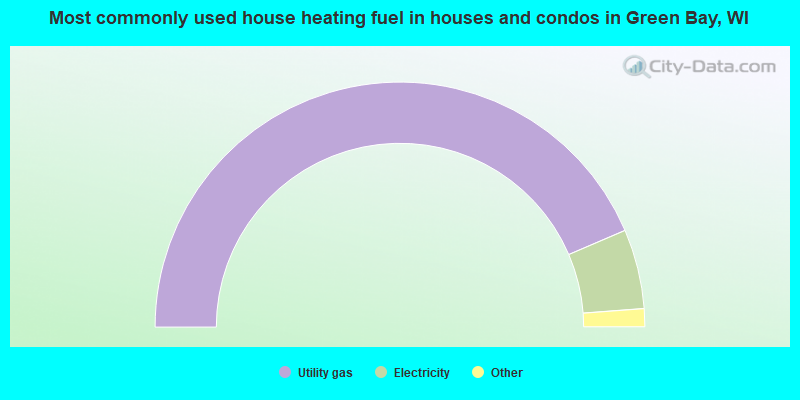
- 87.1%Utility gas
- 10.5%Electricity
- 1.5%Bottled, tank, or LP gas
- 0.4%Fuel oil, kerosene, etc.
- 0.3%Wood
- 0.2%No fuel used
- 0.1%Other fuel
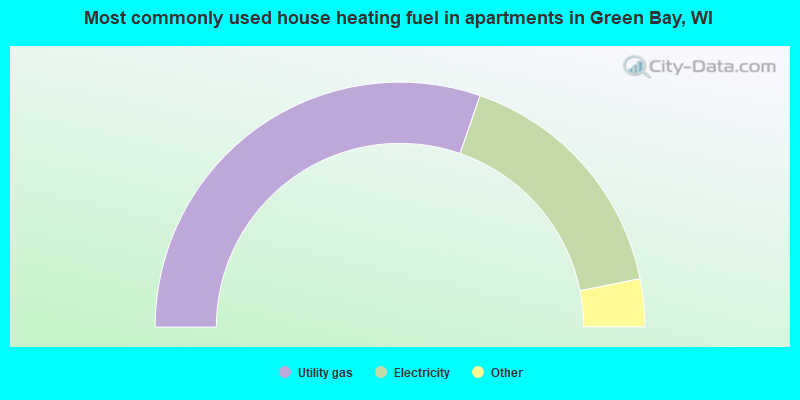
- 60.7%Utility gas
- 33.1%Electricity
- 2.6%No fuel used
- 2.1%Other fuel
- 1.1%Bottled, tank, or LP gas
- 0.3%Fuel oil, kerosene, etc.
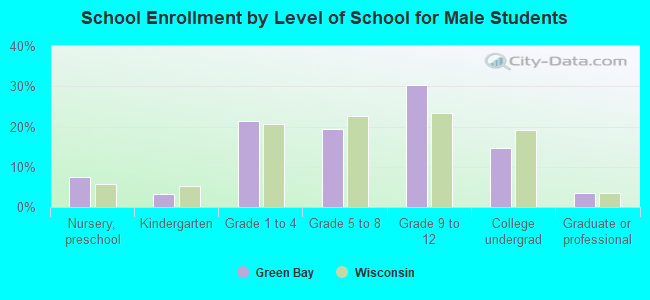
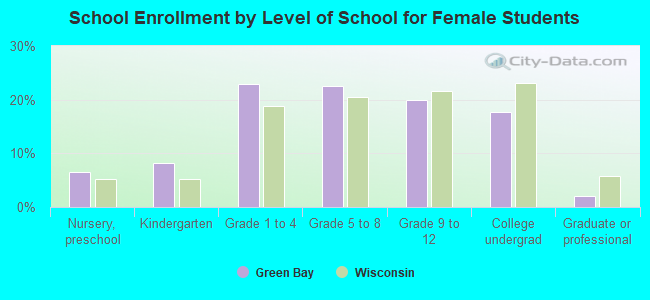
Private vs. public school enrollment:
| Here: | 5.8% |
| Wisconsin: | 16.7% |
| Here: | 16.4% |
| Wisconsin: | 12.5% |
| Here: | 27.9% |
| Wisconsin: | 17.5% |