Gretna, LA (Louisiana) Houses and Residents
Estimated median house or condo value in 2022: $258,213 (it was $74,500 in 2000 )
Gretna:
$258,213Louisiana:
$209,200
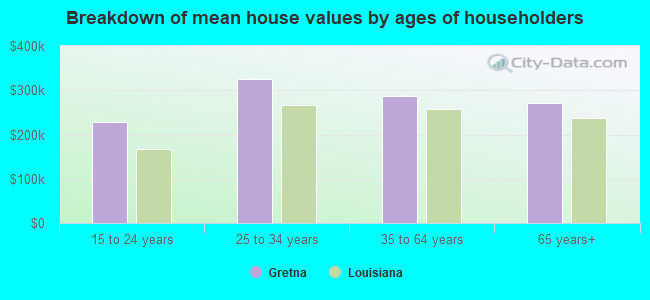
Lower value quartile - upper value quartile: $154,601 - $358,921Mean price in 2022: Detached houses: $288,865 Here:
$288,865State:
$273,555
Townhouses or other attached units: $252,003 Here:
$252,003State:
$297,713
In 2-unit structures: $235,139 Here:
$235,139State:
$325,117
In 5-or-more-unit structures: $283,701 Here:
$283,701State:
$257,054
Mobile homes: $32,296 Here:
$32,296State:
$89,857
Total population: 17,845 (Urban population: 17,338, Rural population: 0)
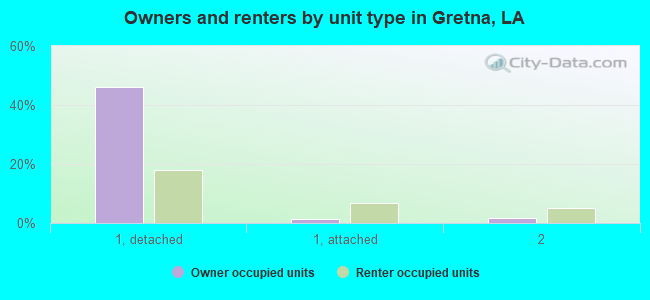
Houses: 8,565 (7,717 occupied: 3,825 owner occupied, 3,885 renter occupied )
% of renters here:
50%State:
32%
Housing density: 2,450 houses/condos per square mile
Median price asked for vacant for-sale houses and condos in 2022: $664,174.
Median contract rent in 2022: $831 (lower quartile is $658, upper quartile is $992)
Median rent asked for vacant for-rent units in 2022: $735
Median gross rent in Gretna, LA in 2022: $991
Housing units in Gretna with a mortgage: 1,887 (89 second mortgage, 0 home equity loan, 45 both second mortgage and home equity loan )Houses without a mortgage: 8
Median household income for houses/condos with a mortgage: $97,009
Median household income for apartments without a mortgage: $55,998
Median monthly housing costs: $987
Data:
Median house or condo value ($)
Median house or condo value ($ change since 2000)
Median house or condo value ($) - White
Median house or condo value ($) - Black or African American
Median house or condo value ($) - Asian
Median house or condo value ($) - Hispanic or Latino
Median house or condo value ($) - American Indian and Alaska Native
Median house or condo value ($) - Multirace
Median house or condo value ($) - Other Race
Median price asked for mobile homes ($)
Household density (households per square mile)
Mean house or condo value by units in structure - 1, detached ($)
Mean house or condo value by units in structure - 1, attached ($)
Mean house or condo value by units in structure - 2 ($)
Mean house or condo value by units in structure by units in structure - 3 or 4 ($)
Mean house or condo value by units in structure - 5 or more ($)
Mean house or condo value by units in structure - Boat, RV, van, etc. ($)
Mean house or condo value by units in structure - Mobile home ($)
Median contract rent ($)
Median contract rent - Lower quartile ($)
Median contract rent - Upper quartile ($)
Median gross rent ($)
Urban houses (%)
Rural houses (%)
Houses occupied (%)
Houses occupied (% change since 2000)
Houses owner occupied (%)
Houses owner occupied (% change since 2000)
Houses renter occupied (%)
Houses renter occupied (% change since 2000)
Vacant housing units - For rent (%)
Vacant housing units - For rent (% change since 2000)
Vacant housing units - For sale only (%)
Vacant housing units - For sale only (% change since 2000)
Vacant housing units - Rented or sold, not occupied (%)
Vacant housing units - Rented or sold, not occupied (% change since 2000)
Vacant housing units - For seasonal, recreational, or occasional use (%)
Vacant housing units - For seasonal, recreational, or occasional use (% change since 2000)
Vacant housing units - For migrant workers (%)
Vacant housing units - For migrant workers (% change since 2000)
Vacant housing units - Other vacant (%)
Vacant housing units - Other vacant (% change since 2000)
Median monthly housing costs ($)
Median household income for houses/condos with a mortgage ($)
Median household income for houses/condos without a mortgage ($)
Median household income ($)
Median household income ($) - White
Median household income ($) - Black or African American
Median household income ($) - Asian
Median household income ($) - Hispanic or Latino
Median household income ($) - American Indian and Alaska Native
Median household income ($) - Multirace
Median household income ($) - Other Race
Mortgage status - with mortgage (%)
Mortgage status - with second mortgage (%)
Mortgage status - with home equity loan (%)
Mortgage status - with both second mortgage and home equity loan (%)
Mortgage status - without a mortgage (%)
Median year house/condo built
Median year apartment built
Household type by relationship - Male householder living alone (%)
Household type by relationship - Male householder not living alone (%)
Household type by relationship - Female householder living alone (%)
Household type by relationship - Female householder not living alone (%)
Household type by relationship - Opposite-Sex spouse (%)
Household type by relationship - Same-Sex spouse (%)
Household type by relationship - Opposite-Sex unmarried partner (%)
Household type by relationship - Same-Sex unmarried partner (%)
Household type by relationship - In group quarters (%)
Size of family households - 2-person household (%)
Size of family households - 3-person household (%)
Size of family households - 4-person household (%)
Size of family households - 5-person household (%)
Size of family households - 6-person household (%)
Size of family households - 7-or-more-person household (%)
Size of nonfamily households - 1-person household (%)
Size of nonfamily households - 2-person household (%)
Size of nonfamily households - 3-person household (%)
Size of nonfamily households - 4-person household (%)
Size of nonfamily households - 5-person household (%)
Size of nonfamily households - 6-person household (%)
Size of nonfamily households - 7-or-moreperson household (%)
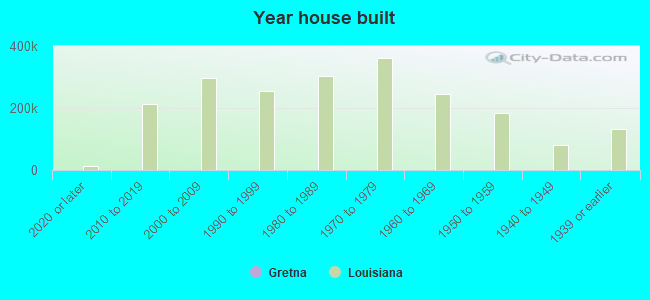
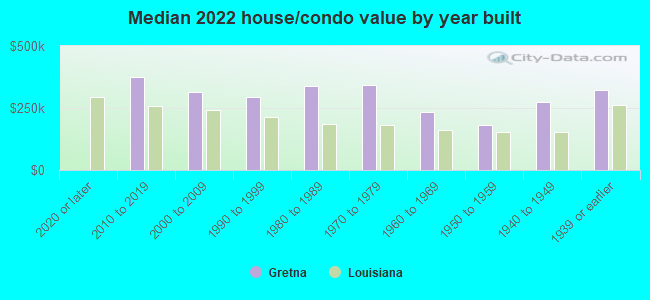
Year house built - Built 2010 or later (%)
Year house built - Built 2000 to 2009 (%)
Year house built - Built 1990 to 1999 (%)
Year house built - Built 1980 to 1989 (%)
Year house built - Built 1970 to 1979 (%)
Year house built - Built 1960 to 1969 (%)
Year house built - Built 1950 to 1959 (%)
Year house built - Built 1940 to 1949 (%)
Year house built - Built 1939 or earlier (%)
Median number of rooms in houses and condos
Median number of rooms in apartments
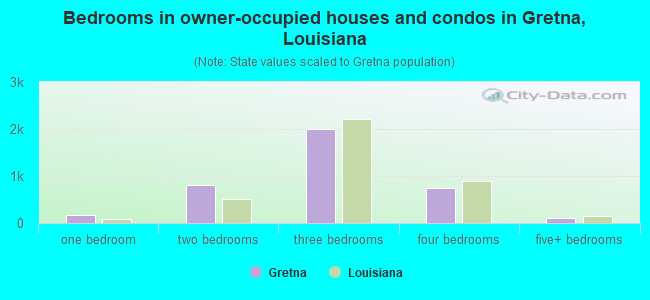
Median number of bedrooms in owner occupied houses
Mean number of bedrooms in owner occupied houses
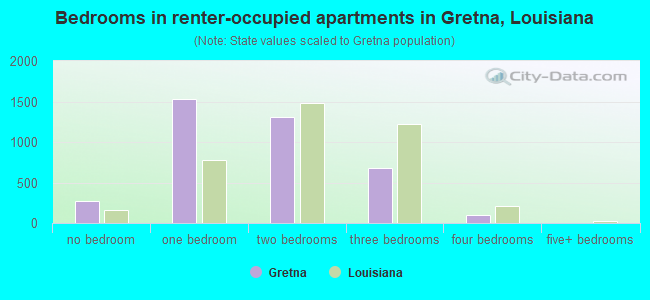
Median number of bedrooms in renter occupied houses
Mean number of bedrooms in renter occupied houses
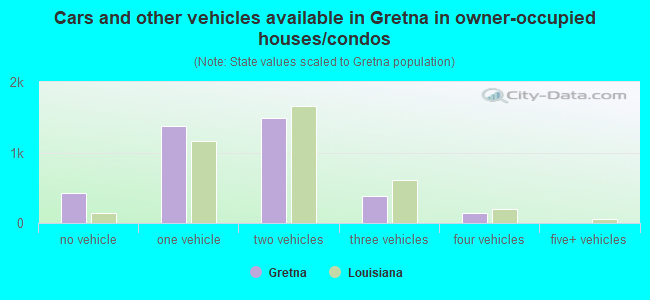
Median number of vehichles in owner occupied houses
Mean number of vehichles in owner occupied houses
Median number of vehichles in renter occupied houses
Mean number of vehichles in renter occupied houses
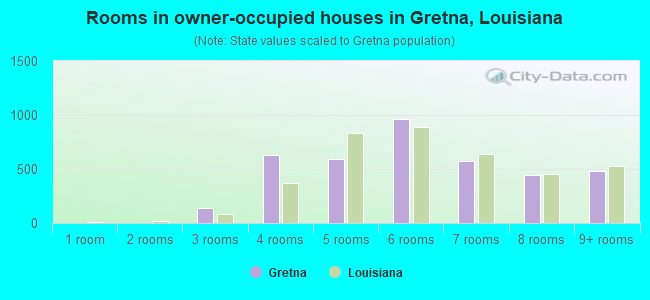
Rooms in owner-occupied houses - 1 room (%)
Rooms in owner-occupied houses - 2 rooms (%)
Rooms in owner-occupied houses - 3 rooms (%)
Rooms in owner-occupied houses - 4 rooms (%)
Rooms in owner-occupied houses - 5 rooms (%)
Rooms in owner-occupied houses - 6 rooms (%)
Rooms in owner-occupied houses - 7 rooms (%)
Rooms in owner-occupied houses - 8 rooms (%)
Rooms in owner-occupied houses - 9+ rooms (%)
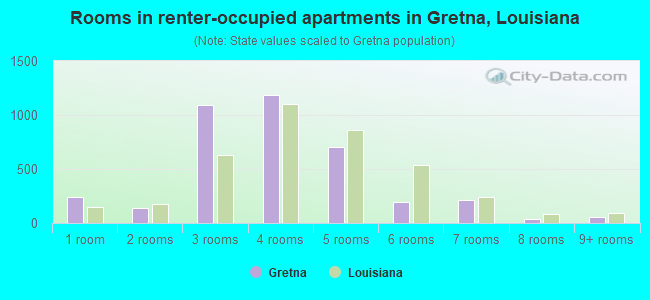
Rooms in renter-occupied houses - 1 room (%)
Rooms in renter-occupied houses - 2 rooms (%)
Rooms in renter-occupied houses - 3 rooms (%)
Rooms in renter-occupied houses - 4 rooms (%)
Rooms in renter-occupied houses - 5 rooms (%)
Rooms in renter-occupied houses - 6 rooms (%)
Rooms in renter-occupied houses - 7 rooms (%)
Rooms in renter-occupied houses - 8 rooms (%)
Rooms in renter-occupied houses - 9+ rooms (%)
Bedrooms in owner-occupied houses - no bedrooms (%)
Bedrooms in owner-occupied houses - 1 bedroom (%)
Bedrooms in owner-occupied houses - 2 bedrooms (%)
Bedrooms in owner-occupied houses - 3 bedrooms (%)
Bedrooms in owner-occupied houses - 4 bedrooms (%)
Bedrooms in owner-occupied houses - 5+ bedrooms (%)
Bedrooms in renter-occupied houses - no bedrooms (%)
Bedrooms in renter-occupied houses - 1 bedroom (%)
Bedrooms in renter-occupied houses - 2 bedrooms (%)
Bedrooms in renter-occupied houses - 3 bedrooms (%)
Bedrooms in renter-occupied houses - 4 bedrooms (%)
Bedrooms in renter-occupied houses - 5+ bedrooms (%)
Vehicles available in owner-occupied houses - no vehicle available (%)
Vehicles available in owner-occupied houses - 1 vehicle available(%)
Vehicles available in owner-occupied houses - 2 Vehicles available (%)
Vehicles available in owner-occupied houses - 3 Vehicles available (%)
Vehicles available in owner-occupied houses - 4 Vehicles available (%)
Vehicles available in owner-occupied houses - 5+ Vehicles available (%)
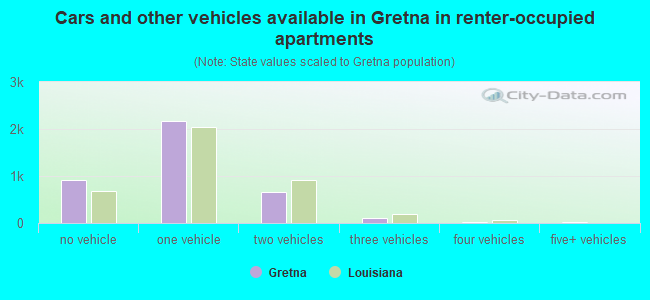
Vehicles available in renter-occupied houses - no vehicle available (%)
Vehicles available in renter-occupied houses - 1 vehicle available (%)
Vehicles available in renter-occupied houses - 2 Vehicles available (%)
Vehicles available in renter-occupied houses - 3 Vehicles available (%)
Vehicles available in renter-occupied houses - 4 Vehicles available (%)
Vehicles available in renter-occupied houses - 5+ Vehicles available (%)
Housing units in structures - 1, detached (%)
Housing units in structures - 1, attached (%)
Housing units in structures - 2 (%)
Housing units in structures - 3 or 4 (%)
Housing units in structures - 5 to 9 (%)
Housing units in structures - 10 to 19 (%)
Housing units in structures - 20 to 49 (%)
Housing units in structures - 50 or more (%)
Housing units in structures - Mobile home (%)
Housing units in structures - Boat, RV, van, etc. (%)
Housing units in structures - Owners - 1, detached (%)
Housing units in structures - Owners - 1, attached (%)
Housing units in structures - Owners - 2 (%)
Housing units in structures - Owners - 3 or 4 (%)
Housing units in structures - Owners - 5 to 9 (%)
Housing units in structures - Owners - 10 to 19 (%)
Housing units in structures - Owners - 20 to 49 (%)
Housing units in structures - Owners - 50 or more (%)
Housing units in structures - Owners - Mobile home (%)
Housing units in structures - Owners - Boat, RV, van, etc. (%)
Housing units in structures - Renters - 1, detached (%)
Housing units in structures - Renters - 1, attached (%)
Housing units in structures - Renters - 2 (%)
Housing units in structures - Renters - 3 or 4 (%)
Housing units in structures - Renters - 5 to 9 (%)
Housing units in structures - Renters - 10 to 19 (%)
Housing units in structures - Renters - 20 to 49 (%)
Housing units in structures - Renters - 50 or more (%)
Housing units in structures - Renters - Mobile home (%)
Housing units in structures - Renters - Boat, RV, van, etc. (%)
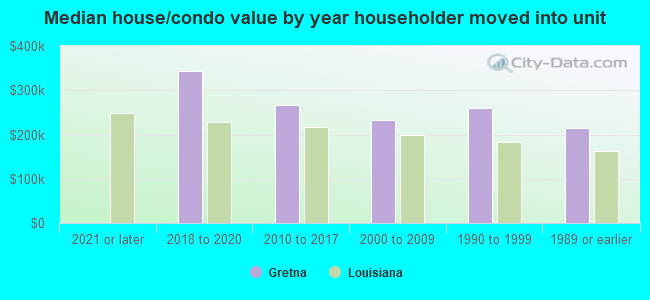
House/condo owner moved in on average (years ago)
Renter moved in on average (years ago)
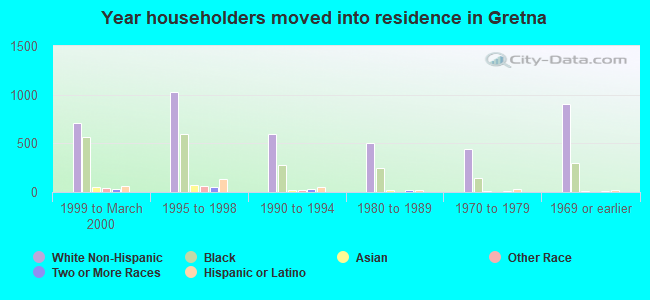
Year householder moved into unit - Moved in 1999 to March 2000 (%)
Year householder moved into unit - Moved in 1999 to March 2000 (%) - White
Year householder moved into unit - Moved in 1999 to March 2000 (%) - Black or African American
Year householder moved into unit - Moved in 1999 to March 2000 (%) - Asian
Year householder moved into unit - Moved in 1999 to March 2000 (%) - Hispanic or Latino
Year householder moved into unit - Moved in 1999 to March 2000 (%) - American Indian and Alaska Native
Year householder moved into unit - Moved in 1999 to March 2000 (%) - Multirace
Year householder moved into unit - Moved in 1999 to March 2000 (%) - Other Race
Year householder moved into unit - Moved in 1995 to 1998 (%)
Year householder moved into unit - Moved in 1995 to 1998 (%) - White
Year householder moved into unit - Moved in 1995 to 1998 (%) - Black or African American
Year householder moved into unit - Moved in 1995 to 1998 (%) - Asian
Year householder moved into unit - Moved in 1995 to 1998 (%) - Hispanic or Latino
Year householder moved into unit - Moved in 1995 to 1998 (%) - American Indian and Alaska Native
Year householder moved into unit - Moved in 1995 to 1998 (%) - Multirace
Year householder moved into unit - Moved in 1995 to 1998 (%) - Other Race
Year householder moved into unit - Moved in 1990 to 1994 (%)
Year householder moved into unit - Moved in 1990 to 1994 (%) - White
Year householder moved into unit - Moved in 1990 to 1994 (%) - Black or African American
Year householder moved into unit - Moved in 1990 to 1994 (%) - Asian
Year householder moved into unit - Moved in 1990 to 1994 (%) - Hispanic or Latino
Year householder moved into unit - Moved in 1990 to 1994 (%) - American Indian and Alaska Native
Year householder moved into unit - Moved in 1990 to 1994 (%) - Multirace
Year householder moved into unit - Moved in 1990 to 1994 (%) - Other Race
Year householder moved into unit - Moved in 1980 to 1989 (%)
Year householder moved into unit - Moved in 1980 to 1989 (%) - White
Year householder moved into unit - Moved in 1980 to 1989 (%) - Black or African American
Year householder moved into unit - Moved in 1980 to 1989 (%) - Asian
Year householder moved into unit - Moved in 1980 to 1989 (%) - Hispanic or Latino
Year householder moved into unit - Moved in 1980 to 1989 (%) - American Indian and Alaska Native
Year householder moved into unit - Moved in 1980 to 1989 (%) - Multirace
Year householder moved into unit - Moved in 1980 to 1989 (%) - Other Race
Year householder moved into unit - Moved in 1970 to 1979 (%)
Year householder moved into unit - Moved in 1970 to 1979 (%) - White
Year householder moved into unit - Moved in 1970 to 1979 (%) - Black or African American
Year householder moved into unit - Moved in 1970 to 1979 (%) - Asian
Year householder moved into unit - Moved in 1970 to 1979 (%) - Hispanic or Latino
Year householder moved into unit - Moved in 1970 to 1979 (%) - American Indian and Alaska Native
Year householder moved into unit - Moved in 1970 to 1979 (%) - Multirace
Year householder moved into unit - Moved in 1970 to 1979 (%) - Other Race
Year householder moved into unit - Moved in 1969 or earlier (%)
Year householder moved into unit - Moved in 1969 or earlier (%) - White
Year householder moved into unit - Moved in 1969 or earlier (%) - Black or African American
Year householder moved into unit - Moved in 1969 or earlier (%) - Asian
Year householder moved into unit - Moved in 1969 or earlier (%) - Hispanic or Latino
Year householder moved into unit - Moved in 1969 or earlier (%) - American Indian and Alaska Native
Year householder moved into unit - Moved in 1969 or earlier (%) - Multirace
Year householder moved into unit - Moved in 1969 or earlier (%) - Other Race
Housing units lacking complete plumbing facilities (%)
Housing units lacking complete kitchen facilities (%)
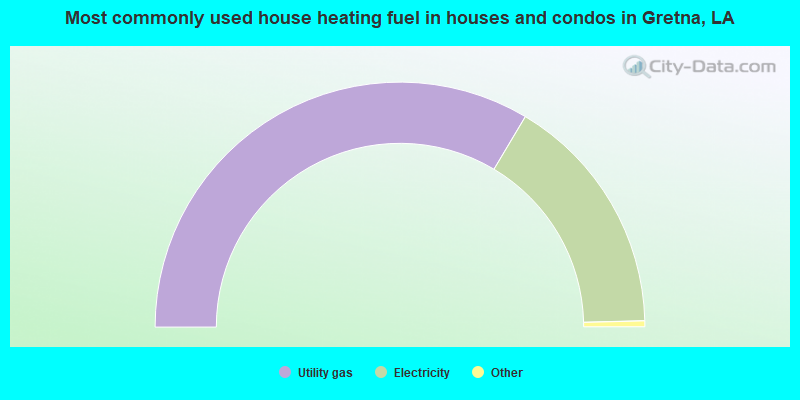
House heating fuel used in houses and condos - Utility gas (%)
House heating fuel used in houses and condos - Bottled, tank, or LP gas (%)
House heating fuel used in houses and condos - Electricity (%)
House heating fuel used in houses and condos - Fuel oil, kerosene, etc. (%)
House heating fuel used in houses and condos - Coal or coke (%)
House heating fuel used in houses and condos - Wood (%)
House heating fuel used in houses and condos - Solar energy (%)
House heating fuel used in houses and condos - Other fuel (%)
House heating fuel used in houses and condos - No fuel used (%)
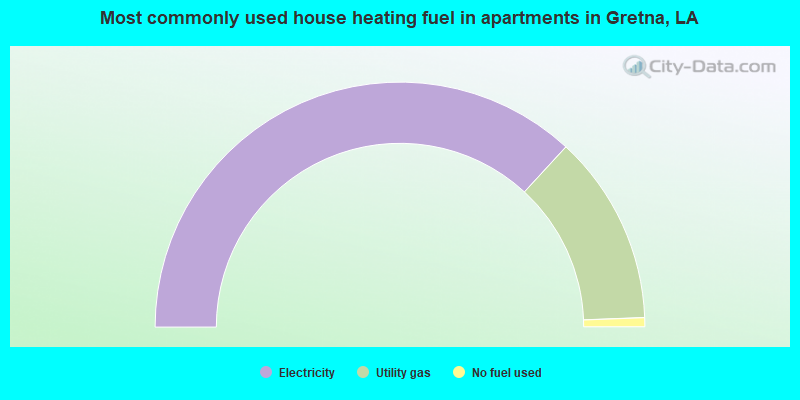
House heating fuel used in apartments - Utility gas (%)
House heating fuel used in apartments - Bottled, tank, or LP gas (%)
House heating fuel used in apartments - Electricity (%)
House heating fuel used in apartments - Fuel oil, kerosene, etc. (%)
House heating fuel used in apartments - Coal or coke (%)
House heating fuel used in apartments - Wood (%)
House heating fuel used in apartments - Solar energy (%)
House heating fuel used in apartments - Other fuel (%)
House heating fuel used in apartments - No fuel used (%)
Latest news about housing in Gretna, LA collected exclusively by city-data.com from local newspapers, TV, and radio stations
Median year house/condo built: 1961Median year apartment built: 1969Household type by relationship:
Households: 17,223
Male householders: 3,573 (1,548 living alone ), Female householders: 3,923 (1,565 living alone )1,843 spouses (1,825 opposite-sex spouses ), 576 unmarried partners , (574 opposite-sex unmarried partners ), 4,339 children (4,070 natural , 124 adopted , 144 stepchildren ), 352 grandchildren , 212 brothers or sisters , 216 parents , 10 foster children , 486 other relatives , 647 non-relatives In group quarters: 1,041
Size of family households: 1,632 2-persons , 959 3-persons , 686 4-persons , 288 5-persons , 79 6-persons , 86 7-or-more-persons .
Size of nonfamily households: 3,428 1-person , 471 2-persons , 141 3-persons .
1,356 married couples with children. single-parent households (457 men , 1,072 women ).
77.1% of residents of Gretna speak English at home. of residents speak Spanish at home (37% speak English very well , 13% speak English well , 18% speak English not well , 32% don't speak English at all ).of residents speak other Indo-European language at home (92% speak English very well , 8% speak English well ).of residents speak Asian or Pacific Island language at home (66% speak English very well , 14% speak English well , 16% speak English not well , 4% don't speak English at all ).of residents speak other language at home (52% speak English very well , 8% speak English well , 40% speak English not well ).
Foreign born population: 2,822 (16.4%)of them are naturalized citizens )
Median number of rooms in houses and condos:
Median number of rooms in apartments
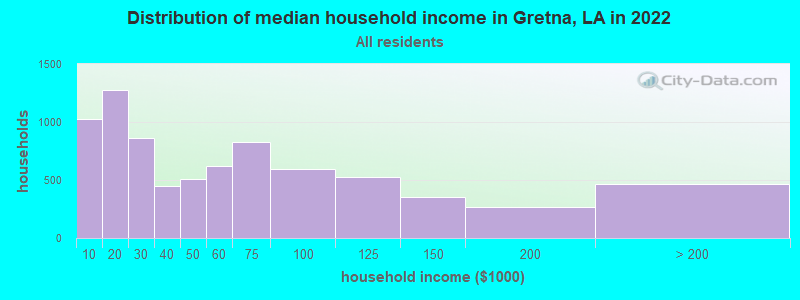
Gretna, LA household income distribution 1,026 Less than $10,0001,278 $10,000 to $19,999864 $20,000 to $29,999444 $30,000 to $39,999509 $40,000 to $49,999618 $50,000 to $59,999826 $60,000 to $74,999594 $75,000 to $99,999527 $100,000 to $124,999355 $125,000 to $149,999270 $150,000 to $199,999469 $200,000 or more
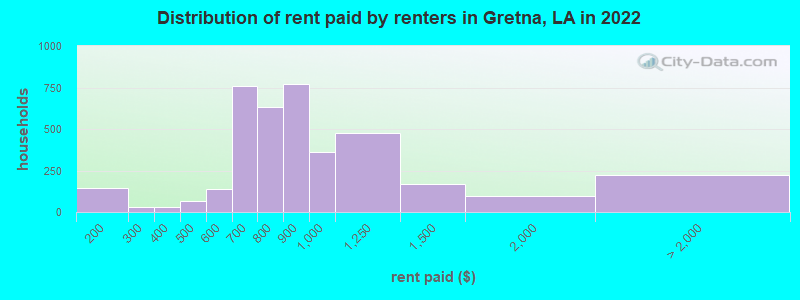
Home value of owner - occupied houses in 2022 in Gretna, LA 10 Less than $10,0009 $10,000 to $14,9998 $15,000 to $19,99924 $20,000 to $24,99925 $25,000 to $29,99930 $30,000 to $34,99913 $50,000 to $59,99941 $70,000 to $79,99933 $80,000 to $89,99944 $90,000 to $99,999381 $100,000 to $124,999223 $125,000 to $149,999307 $150,000 to $174,999167 $175,000 to $199,999430 $200,000 to $249,999623 $250,000 to $299,999959 $300,000 to $399,999319 $400,000 to $499,999120 $500,000 to $749,99953 $750,000 to $999,9999 $2,000,000 or moreRent paid by renters in 2022 in Gretna, LA 64 $100 to $14977 $150 to $19929 $200 to $24922 $300 to $3496 $350 to $39952 $400 to $44913 $450 to $49942 $500 to $54993 $550 to $599315 $600 to $649441 $650 to $699197 $700 to $749431 $750 to $799771 $800 to $899363 $900 to $999477 $1,000 to $1,249170 $1,250 to $1,49995 $1,500 to $1,99924 $2,000 to $2,499199 No cash rent
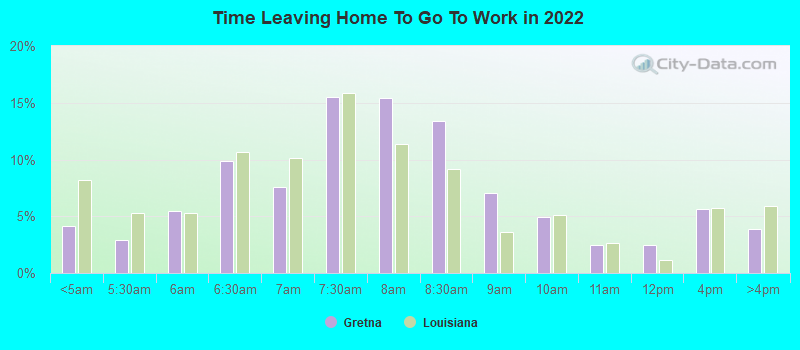
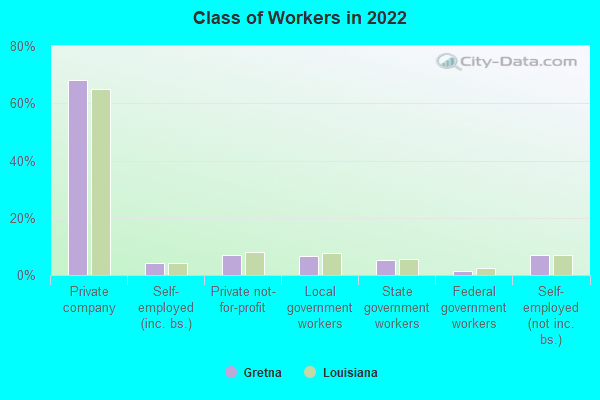
Percentage of workers working in this county: 61.3%Number of people working at home: 542 (7.3% of all workers )
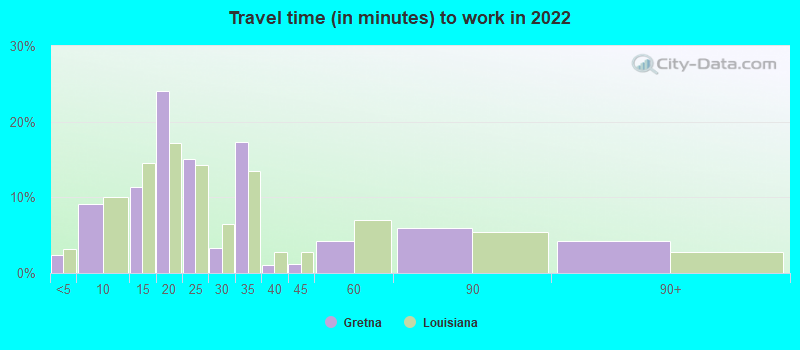
Travel time to work (commute)
Less than 5 minutes: 1625 to 9 minutes: 55710 to 14 minutes: 93915 to 19 minutes: 1,22320 to 24 minutes: 1,13725 to 29 minutes: 50230 to 34 minutes: 1,08735 to 39 minutes: 17640 to 44 minutes: 31245 to 59 minutes: 17560 to 89 minutes: 40390 or more minutes: 125
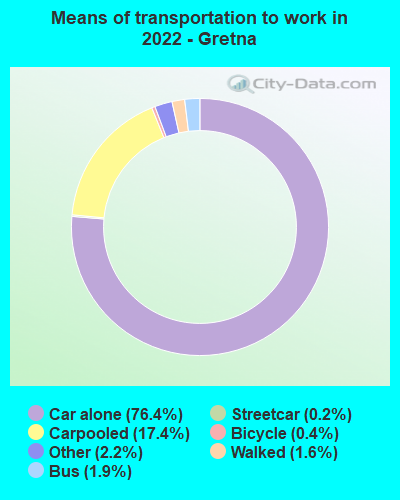
Means of transportation to work:
Drove a car alone: 6,643 (72.3%)Carpooled: 1,236 (13.4%)Bus : 84 (0.9%)Subway or elevated rail : 19 (0.2%)Taxi: 287 (3.1%)Bicycle: 17 (0.2%)Walked: 104 (1.1%)Worked at home: 542 (5.9%)
Unemployment by race in 2022
Unemployment rate for White non-Hispanic residents 3.8% Males3.5% FemalesUnemployment rate for Black residents 4.3% Males9.7% FemalesUnemployment rate for Asian residents 3.5% Males30.6% FemalesUnemployment rate for other race residents 2.1% Males27.4% FemalesUnemployment rate for two or more race residents 2.3% MalesUnemployment rate for Hispanic or Latino residents 2.1% Males12.9% Females
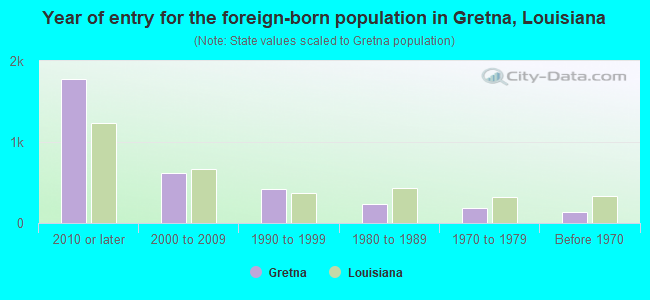
Year of entry for the foreign-born population in Gretna, Louisiana
1,774 2010 or later 620 2000 to 2009 417 1990 to 1999 240 1980 to 1989 190 1970 to 1979 131 Before 1970
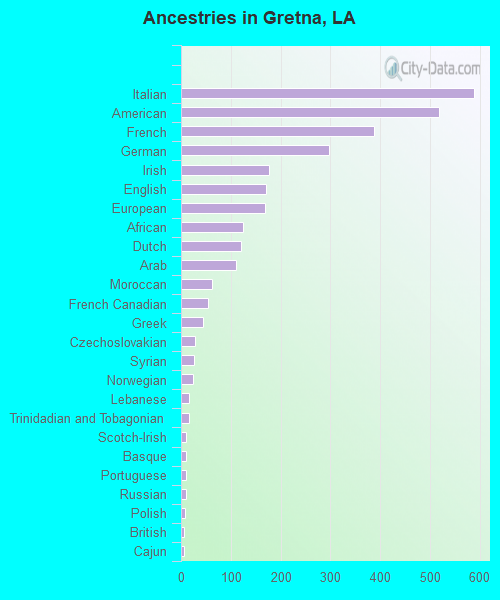
First ancestries reported:
Italian: 589 (5.4%)
American: 518 (4.7%)
French: 387 (3.5%)
German: 298 (2.7%)
Irish: 176 (1.6%)
English: 171 (1.6%)
European: 169 (1.5%)
African: 125 (1.1%)
Dutch: 121 (1.1%)
Arab: 111 (1.0%)
Moroccan: 63 (0.6%)
French Canadian: 55 (0.5%)
Greek: 44 (0.4%)
Czechoslovakian: 28 (0.3%)
Syrian: 27 (0.2%)
Norwegian: 25 (0.2%)
Lebanese: 17 (0.2%)
Trinidadian and Tobagonian: 17 (0.2%)
Scotch-Irish: 11 (0.1%)
Basque: 10 (0.09%)
Portuguese: 10 (0.09%)
Russian: 10 (0.09%)
Polish: 8 (0.07%)
British: 7 (0.06%)
Cajun: 6 (0.05%)
Swiss: 6 (0.05%)
Scottish: 4 (0.04%)
West Indian: 4 (0.04%)
Egyptian: 2 (0.02%)
Austrian: 1 (0.01%) Most common places of birth for foreign-born residents (%): Honduras Gretna:
69.0% (2,264)Louisiana:
18.9% (37,225)
Mexico Gretna:
9.4% (308)Louisiana:
12.1% (23,732)
Cuba Gretna:
9.0% (296)Louisiana:
3.1% (6,172)
Vietnam Gretna:
5.4% (177)Louisiana:
9.2% (18,115)
Netherlands Gretna:
3.1% (101)Louisiana:
0.3% (632)
Israel Gretna:
2.7% (87)Louisiana:
0.5% (901)
Place of birth for U.S.-born residents:
This state: 11,625Other state: 2,325Northeast: 400Midwest: 394South: 1,220West: 302 84.5% of Gretna residents lived in the same house 1 years ago.
Out of people who lived in different houses, 36.2% lived in this county.
Out of people who lived in different counties, 89.7% lived in Louisiana.
Gretna:
84.5%State average:
88.3%
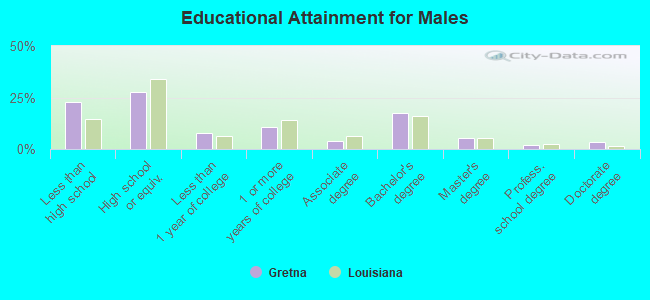
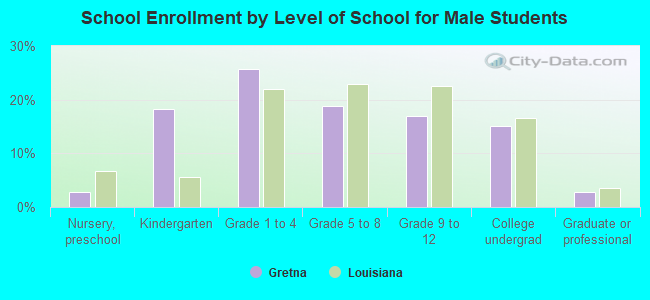
Education attainment for males 25 years and older:
No schooling: 292Nursery to 4th grade: 465th and 6th grade: 2357th and 8th grade: 489th grade: 15110th grade: 26411th grade: 11612th grade, no diploma: 191High school graduate (or equivalency): 1,637Less than 1 year of college: 454Some college more than 1 year, no degree: 625Associate degree: 219Bachelor's degree: 1,026Master's degree: 311Professional school degree: 119Doctorate degree: 211
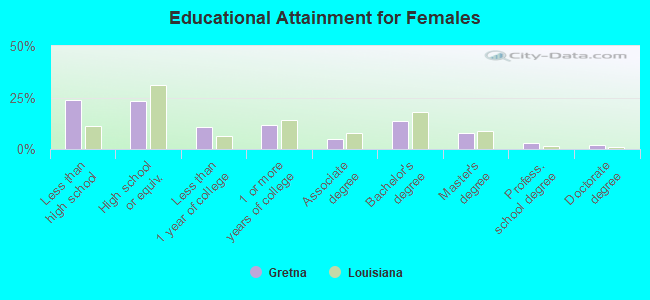
Education attainment for females 25 years and older:
No schooling: 120Nursery to 4th grade: 735th and 6th grade: 867th and 8th grade: 3639th grade: 21210th grade: 4711th grade: 28512th grade, no diploma: 291High school graduate (or equivalency): 1,448Less than 1 year of college: 675Some college more than 1 year, no degree: 724Associate degree: 314Bachelor's degree: 846Master's degree: 477Professional school degree: 177Doctorate degree: 131
Housing units in structures:
One, detached: 5,040One, attached: 592Two: 5973 or 4: 5075 to 9: 75110 to 19: 54620 to 49: 28550 or more: 145Mobile homes: 97Housing units lacking complete plumbing facilities in 2022: 2.5%Housing units lacking complete kitchen facilities in 2022: 1.7%House/condo owner moved in on average 12 years ago
Renter moved in on average 4 years ago
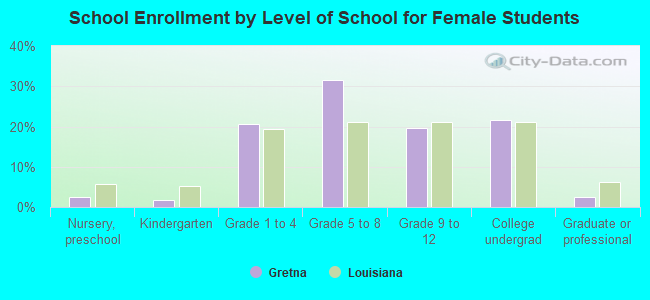
Private vs. public school enrollment:
Students in private schools in grades 1 to 8 (elementary and middle school): 489 Here:
30.0%Louisiana:
19.6%
Students in private schools in grades 9 to 12 (high school): 170 Here:
28.1%Louisiana:
18.3%
Students in private undergraduate colleges: 94 Here:
16.0%Louisiana:
17.4%