Hancock, MA (Massachusetts) Houses and Residents
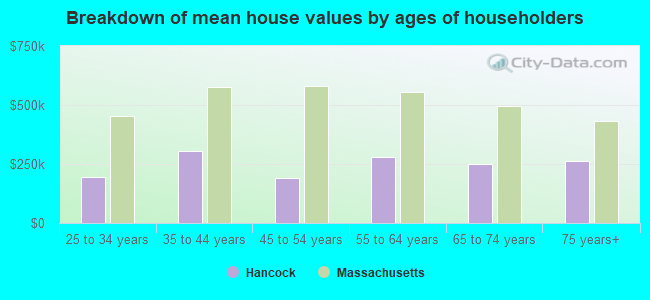
| Hancock: | $357,540 |
| Massachusetts: | $534,700 |
Total population: 717 (Urban population: 0, Rural population: 731 (10 farm, 721 nonfarm))
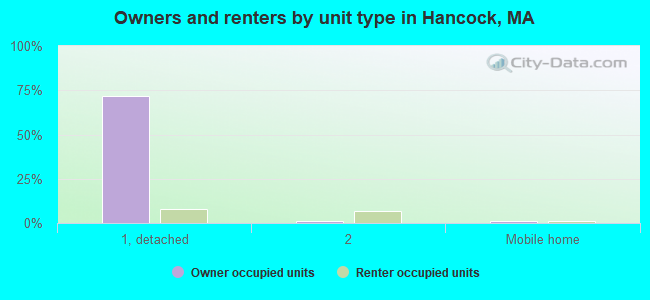
Houses: 474 (297 occupied: 232 owner occupied, 65 renter occupied)
| % of renters here: | 22% |
| State: | 38% |
Housing density: 13 houses/condos per square mile
Median price asked for vacant for-sale houses and condos in 2022 in this county: $708,441.
Median contract rent in 2022: $857 (lower quartile is $616, upper quartile is $1,101)
Median rent asked for vacant for-rent units in 2022: $626
Median gross rent in Hancock, MA in 2022: $1,092
Housing units in Hancock with a mortgage: 113 (7 second mortgage, 22 home equity loan, 0 both second mortgage and home equity loan)
Houses without a mortgage: 51
Compare current foreclosures near Hancock, MA:
| Photo | Address | Area | Beds / Baths | Price | Details |
|---|---|---|---|---|---|

|
#1
Crystal St
Lenox Dale, MA 01242
|
1,918 sq. feet
|
2 baths 3 beds |
$165,900
|
show details |

|
#2
Elmwood Ave
North Adams, MA 01247
|
2,777 sq. feet
|
3 baths 5 beds |
$215,000
|
show details |

|
#3
Washington Mountain Rd
Lee, MA 01238
|
- sq. feet
|
1 baths 3 beds |
$155,000
|
show details |

|
#4
Houghton St
North Adams, MA 01247
|
1,614 sq. feet
|
2 baths 4 beds |
show details | |

|
#5
Tierney Pl
Pittsfield, MA 01201
|
1,103 sq. feet
|
1 baths 3 beds |
show details | |

|
#6
Grove St
Adams, MA 01220
|
2,644 sq. feet
|
2 baths 7 beds |
show details | |

|
#7
Franklin St
North Adams, MA 01247
|
1,386 sq. feet
|
1 baths 3 beds |
show details | |

|
#8
Church St
Cheshire, MA 01225
|
1,281 sq. feet
|
1 baths 3 beds |
show details | |

|
#9
Fenn St
Pittsfield, MA 01201
|
5,166 sq. feet
|
6 baths 12 beds |
show details | |

|
#10
Elberon Ave
Pittsfield, MA 01201
|
1,726 sq. feet
|
1 baths 3 beds |
show details |
| Photo | Address | Area | Beds / Baths | Price | Details |
|---|---|---|---|---|---|

|
#11
Barbour St
North Adams, MA 01247
|
1,224 sq. feet
|
1 baths 2 beds |
show details | |

|
#12
West St
Pittsfield, MA 01201
|
3,722 sq. feet
|
3 baths 6 beds |
show details | |

|
#13
Wilshire Dr
Cheshire, MA 01225
|
4,302 sq. feet
|
2 baths 3 beds |
show details | |

|
#14
Daniels Ave
Pittsfield, MA 01201
|
3,040 sq. feet
|
3 baths 6 beds |
show details | |

|
#15
Circular Ave
Pittsfield, MA 01201
|
2,808 sq. feet
|
4 baths 8 beds |
show details | |

|
#16
Madison Ave
Pittsfield, MA 01201
|
2,192 sq. feet
|
2 baths 6 beds |
show details | |

|
#17
Robbins Ave
Pittsfield, MA 01201
|
1,872 sq. feet
|
2 baths 4 beds |
show details | |

|
#18
Weller Ave
Pittsfield, MA 01201
|
3,376 sq. feet
|
3 baths 6 beds |
show details | |

|
#19
North St
North Adams, MA 01247
|
1,164 sq. feet
|
1 baths 3 beds |
show details | |

|
#20
Blue Factory Rd
Averill Park, NY 12018
|
1,344 sq. feet
|
2 baths 3 beds |
show details |
| Photo | Address | Area | Beds / Baths | Price | Details |
|---|---|---|---|---|---|

|
#21
North St
Pittsfield, MA 01201
|
1,661 sq. feet
|
2 baths 4 beds |
show details | |

|
#22
Frisbee St
East Chatham, NY 12060
|
2,400 sq. feet
|
2 baths 4 beds |
show details | |

|
#23
Weber St # 12
Adams, MA 01220
|
1,728 sq. feet
|
2 baths 4 beds |
show details | |

|
#24
Richmond St
Adams, MA 01220
|
1,920 sq. feet
|
2 baths 4 beds |
show details | |

|
#25
North St
North Adams, MA 01247
|
1,164 sq. feet
|
1 baths 3 beds |
show details | |

|
#26
Franklin St
North Adams, MA 01247
|
1,386 sq. feet
|
1 baths 3 beds |
show details | |

|
#27
E Hoosac St
Adams, MA 01220
|
594 sq. feet
|
1 baths 2 beds |
show details | |

|
#28
Anthony St # B
Adams, MA 01220
|
1,622 sq. feet
|
2 baths 3 beds |
show details | |

|
#29
Park Ave
Nassau, NY 12123
|
1,734 sq. feet
|
1 baths 3 beds |
show details | |

|
#30
Woodlawn Dr
Williamstown, MA 01267
|
1,806 sq. feet
|
2 baths 4 beds |
show details |
| Photo | Address | Area | Beds / Baths | Price | Details |
|---|---|---|---|---|---|

|
#31
Housatonic St
Lenox, MA 01240
|
1,380 sq. feet
|
1 baths 3 beds |
show details | |

|
#32
Mohawk Trl
North Adams, MA 01247
|
1,210 sq. feet
|
1 baths 3 beds |
show details | |

|
#33
Linden St
Williamstown, MA 01267
|
2,298 sq. feet
|
3 baths 4 beds |
show details | |

|
#34
Tremont Dr
Nassau, NY 12123
|
1,080 sq. feet
|
2 baths 3 beds |
show details | |

|
#35
Morgan St
Lenox, MA 01240
|
3,959 sq. feet
|
2 baths 3 beds |
show details | |

|
#36
W Shaft Rd
North Adams, MA 01247
|
1,144 sq. feet
|
1 baths 3 beds |
show details | |

|
#37
Liberty S 2
North Adams, MA 01247
|
3,010 sq. feet
|
3 baths 4 beds |
show details | |

|
#38
E Shore Dr
Petersburg, NY 12138
|
1,000 sq. feet
|
1 baths 6 beds |
show details | |

|
#39
Fox Way
Petersburg, NY 12138
|
1,734 sq. feet
|
1 baths 1 beds |
show details | |

|
#40
Rte 9
Windsor, MA 01270
|
1,223 sq. feet
|
1 baths 2 beds |
show details |
| Photo | Address | Area | Beds / Baths | Price | Details |
|---|---|---|---|---|---|

|
#41
Westbrook Dr
Nassau, NY 12123
|
768 sq. feet
|
1 baths 2 beds |
show details | |

|
#42
Tollgate Rd
Averill Park, NY 12018
|
2,088 sq. feet
|
2 baths 3 beds |
show details | |

|
#43
Melville Ct
Lenox, MA 01240
|
3,988 sq. feet
|
6 baths 5 beds |
show details | |

|
#44
Hill Hollow Rd
Petersburg, NY 12138
|
980 sq. feet
|
1 baths 1 beds |
show details | |

|
#45
Birds Hill Rd
Averill Park, NY 12018
|
1,128 sq. feet
|
1 baths 2 beds |
show details | |

|
#46
North St
Williamstown, MA 01267
|
1,552 sq. feet
|
2 baths 3 beds |
show details | |

|
#47
Cranberry Pond Rd
Cropseyville, NY 12052
|
1,152 sq. feet
|
1 baths 2 beds |
show details | |

|
#48
Grange Hall Rd
Stephentown, NY 12168
|
1,670 sq. feet
|
1 baths 2 beds |
show details | |

|
#49
Upper Queechy Rd
Canaan, NY 12029
|
912 sq. feet
|
1 baths 2 beds |
show details | |

|
Check over 1 million property listings on Foreclosure.com!
|
browse all offers | |||
Latest news about housing in Hancock, MA collected exclusively by city-data.com from local newspapers, TV, and radio stations


Household type by relationship:
Households: 125,060- In family households: 97,905 (22,577 male householders, 11,041 female householders)
24,607 spouses, 32,029 children (29,913 natural, 899 adopted, 1,217 stepchildren), 1,640 grandchildren, 800 brothers or sisters, 888 parents, foster children, 744 other relatives, 3,122 non-relatives
- In nonfamily households: 27,155 (10,008 male householders (7,904 living alone)), 12,465 female householders (10,630 living alone)), 4,682 nonrelatives
- In group quarters: 6,159 (2,280 institutionalized population)
19,886 married couples with children.
7,840 single-parent households (1,582 men, 6,258 women).
98.2% of residents of Hancock speak English at home.
0.7% of residents speak Spanish at home (40% speak English very well, 60% speak English not well).
0.9% of residents speak other Indo-European language at home (100% speak English very well).
0.1% of residents speak Asian or Pacific Island language at home (100% speak English very well).
Foreign born population: 20 (2.9%)
(55.0% of them are naturalized citizens)
| Here: | 6.5 |
| State: | 6.5 |
| Here: | 4.2 |
| State: | 4.0 |
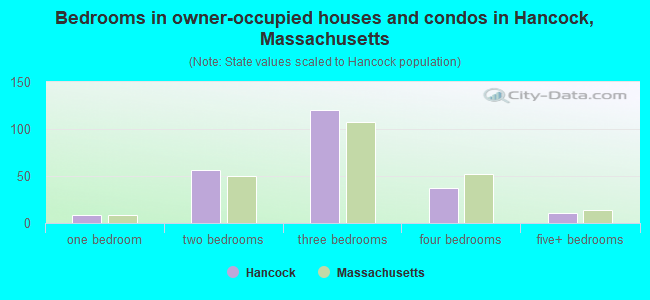
- Bedrooms in owner-occupied houses and condos in Hancock, Massachusetts
- 0no bedroom
- 81 bedroom
- 562 bedrooms
- 1203 bedrooms
- 374 bedrooms
- 115+ bedrooms
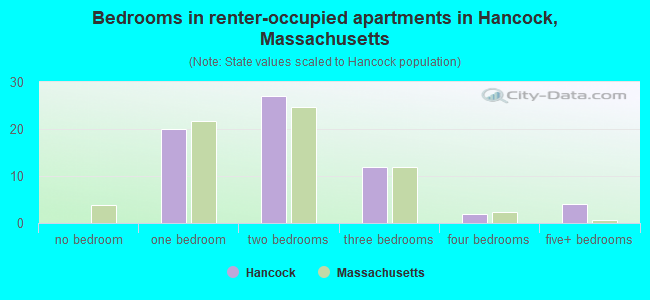
- Bedrooms in renter-occupied apartments in Hancock, Massachusetts
- 0no bedroom
- 201 bedroom
- 272 bedrooms
- 123 bedrooms
- 24 bedrooms
- 45+ bedrooms
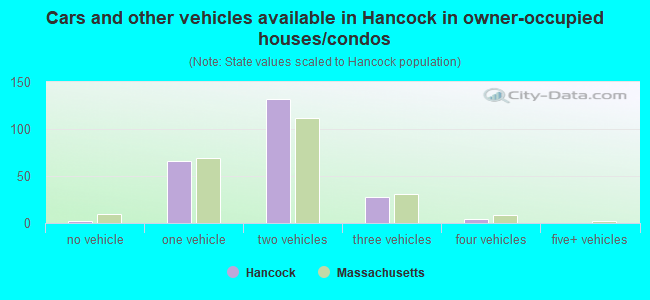
- Cars and other vehicles available in Hancock in owner-occupied houses/condos
- 2no vehicle
- 661 vehicle
- 1322 vehicles
- 283 vehicles
- 44 vehicles
- 05+ vehicles
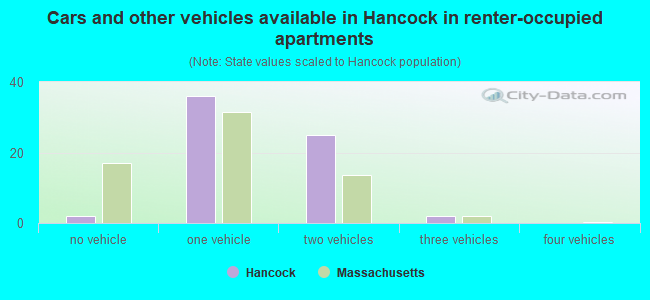
- Cars and other vehicles available in Hancock in renter-occupied apartments
- 2no vehicle
- 361 vehicle
- 252 vehicles
- 23 vehicles
- 04 vehicles
- 05+ vehicles
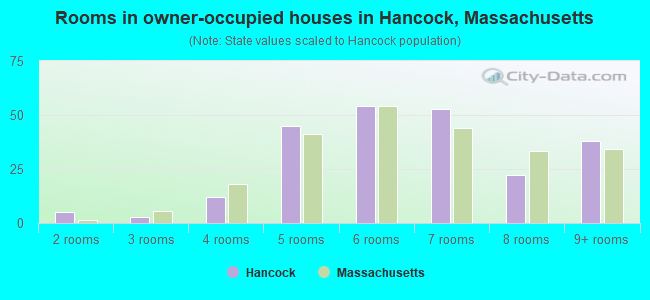
- Rooms in owner-occupied houses in Hancock, Massachusetts
- 01 room
- 52 rooms
- 33 rooms
- 124 rooms
- 455 rooms
- 546 rooms
- 537 rooms
- 228 rooms
- 389+ rooms
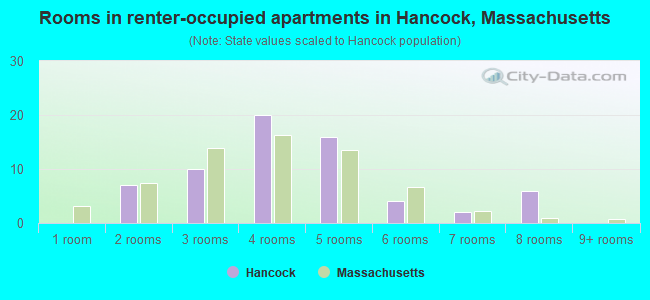
- Rooms in renter-occupied apartments in Hancock, Massachusetts
- 01 room
- 72 rooms
- 103 rooms
- 204 rooms
- 165 rooms
- 46 rooms
- 27 rooms
- 68 rooms
- 09+ rooms
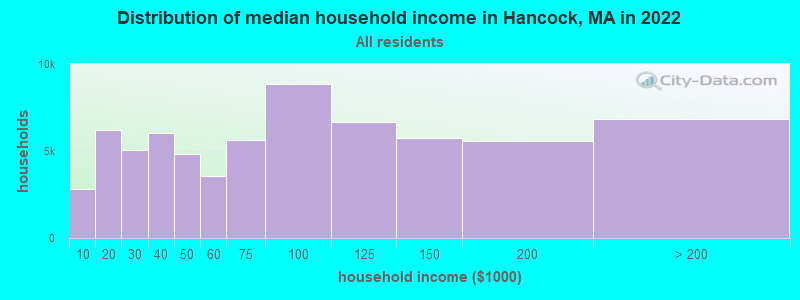
Hancock, MA household income distribution

- 2,795Less than $10,000
- 6,226$10,000 to $19,999
- 5,056$20,000 to $29,999
- 6,028$30,000 to $39,999
- 4,836$40,000 to $49,999
- 3,548$50,000 to $59,999
- 5,635$60,000 to $74,999
- 8,853$75,000 to $99,999
- 6,663$100,000 to $124,999
- 5,739$125,000 to $149,999
- 5,566$150,000 to $199,999
- 6,843$200,000 or more
Percentage of workers working in this county: 87.0%
Number of people working at home: 74 (18.3% of all workers)
Travel time to work (commute)
- Less than 5 minutes: 13
- 5 to 9 minutes: 28
- 10 to 14 minutes: 35
- 15 to 19 minutes: 50
- 20 to 24 minutes: 71
- 25 to 29 minutes: 55
- 30 to 34 minutes: 33
- 35 to 39 minutes: 13
- 40 to 44 minutes: 14
- 45 to 59 minutes: 19
- 60 to 89 minutes: 5
- 90 or more minutes: 9
Means of transportation to work:
- Drove a car alone: 310 (86.4%)
- Carpooled: 26 (7.2%)
- Railroad: 2 (0.6%)
- Walked: 3 (0.8%)
- Other means: 4 (1.1%)
- Worked at home: 14 (3.9%)
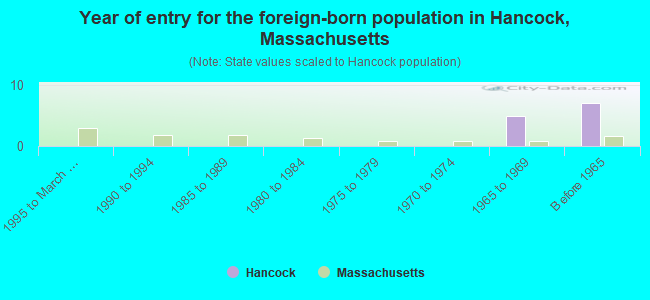
- Year of entry for the foreign-born population in Hancock, Massachusetts
- 01995 to March 2000
- 01990 to 1994
- 01985 to 1989
- 01980 to 1984
- 01975 to 1979
- 01970 to 1974
- 51965 to 1969
- 7Before 1965
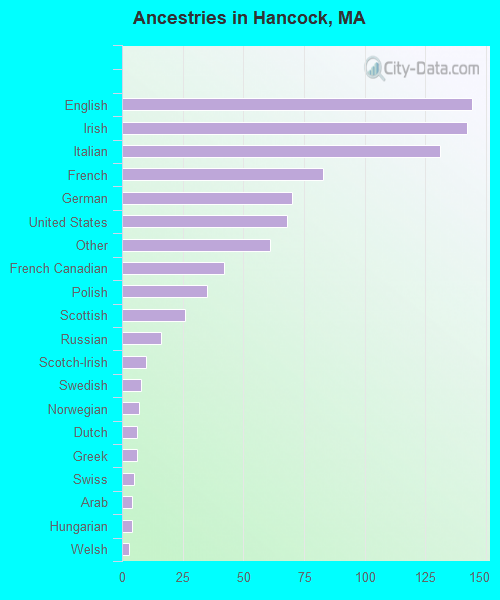
First ancestries reported:
- English: 144 (16.5%)
- Irish: 142 (16.3%)
- Italian: 131 (15.0%)
- French: 83 (9.5%)
- German: 70 (8.0%)
- United States: 68 (7.8%)
- Other: 61 (7.0%)
- French Canadian: 42 (4.8%)
- Polish: 35 (4.0%)
- Scottish: 26 (3.0%)
- Russian: 16 (1.8%)
- Scotch-Irish: 10 (1.1%)
- Swedish: 8 (0.9%)
- Norwegian: 7 (0.8%)
- Dutch: 6 (0.7%)
- Greek: 6 (0.7%)
- Swiss: 5 (0.6%)
- Arab: 4 (0.5%)
- Hungarian: 4 (0.5%)
- Welsh: 3 (0.3%)
Most common places of birth for foreign-born residents (%):
| Hancock: | 41.7% (5) |
| Massachusetts: | 5.2% (40,247) |
| Hancock: | 16.7% (2) |
| Massachusetts: | 0.8% (5,895) |
| Hancock: | 16.7% (2) |
| Massachusetts: | 1.6% (12,350) |
| Hancock: | 16.7% (2) |
| Massachusetts: | 0.4% (2,780) |
Place of birth for U.S.-born residents:
- This state: 450
- Other state: 269
- Northeast: 234
- Midwest: 16
- South: 11
- West: 8
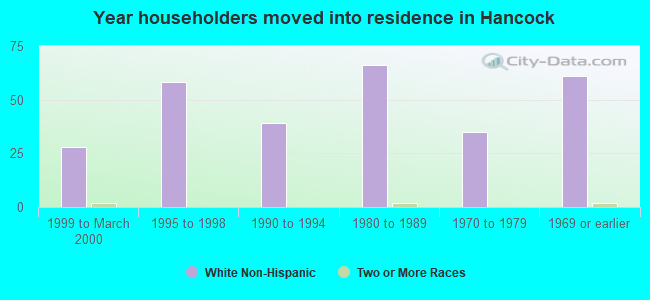
65% of Hancock residents lived in the same house 5 years ago.
Out of people who lived in different houses, 55% lived in this county.
Out of people who lived in different counties, 7% lived in Massachusetts.
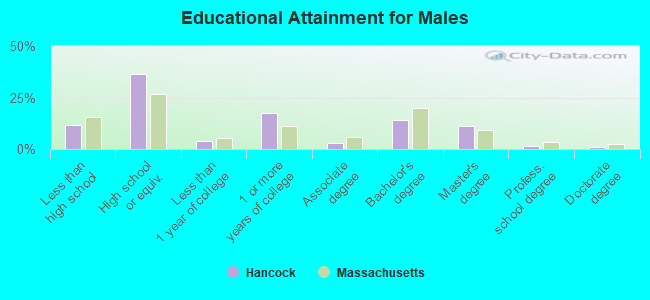
Education attainment for males 25 years and older:
- No schooling: 0
- Nursery to 4th grade: 0
- 5th and 6th grade: 2
- 7th and 8th grade: 4
- 9th grade: 8
- 10th grade: 3
- 11th grade: 1
- 12th grade, no diploma: 11
- High school graduate (or equivalency): 92
- Less than 1 year of college: 10
- Some college more than 1 year, no degree: 44
- Associate degree: 7
- Bachelor's degree: 35
- Master's degree: 28
- Professional school degree: 4
- Doctorate degree: 2
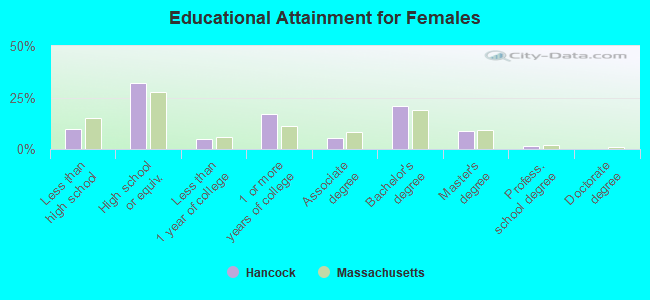
Education attainment for females 25 years and older:
- No schooling: 2
- Nursery to 4th grade: 0
- 5th and 6th grade: 0
- 7th and 8th grade: 5
- 9th grade: 6
- 10th grade: 8
- 11th grade: 0
- 12th grade, no diploma: 5
- High school graduate (or equivalency): 86
- Less than 1 year of college: 13
- Some college more than 1 year, no degree: 45
- Associate degree: 14
- Bachelor's degree: 56
- Master's degree: 24
- Professional school degree: 4
- Doctorate degree: 0


Housing units in structures:
- One, detached: 293
- One, attached: 97
- Two: 25
- 3 or 4: 31
- 5 to 9: 21
- Mobile homes: 7
Median worth of mobile homes: $166,699
Housing units lacking complete kitchen facilities: 0.6%
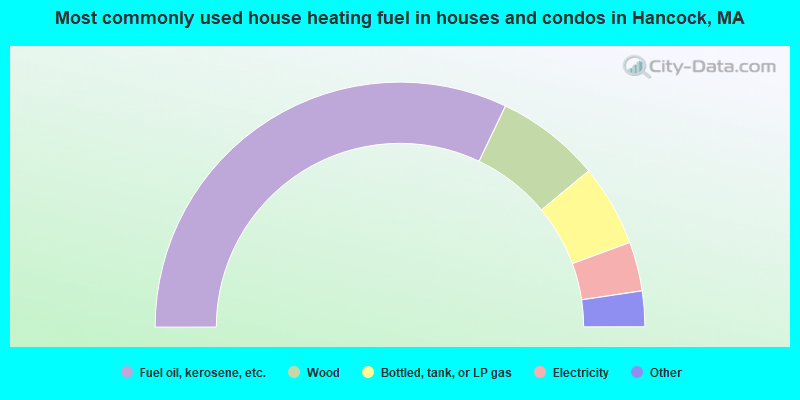
- 64.2%Fuel oil, kerosene, etc.
- 13.8%Wood
- 10.8%Bottled, tank, or LP gas
- 6.5%Electricity
- 3.9%Coal or coke
- 0.9%Other fuel
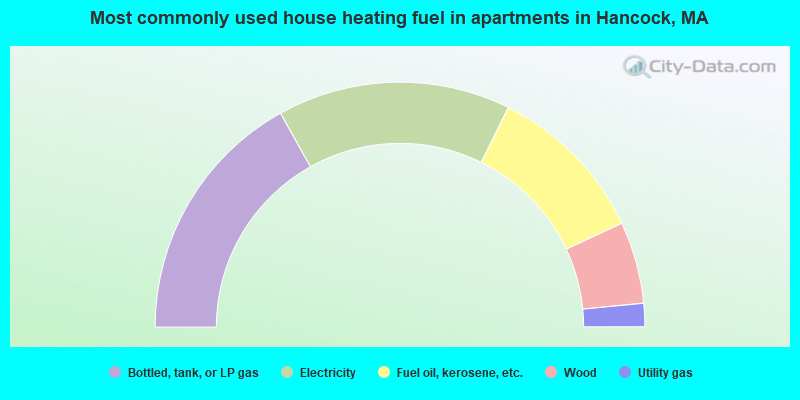
- 33.8%Bottled, tank, or LP gas
- 30.8%Electricity
- 21.5%Fuel oil, kerosene, etc.
- 10.8%Wood
- 3.1%Utility gas
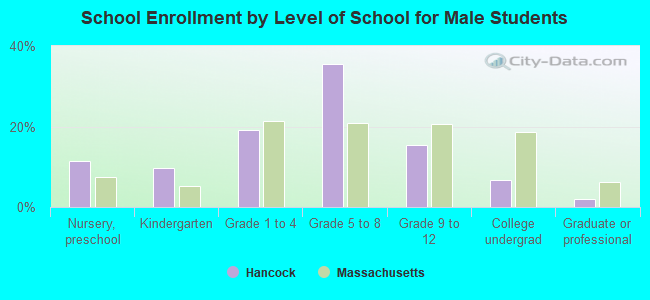
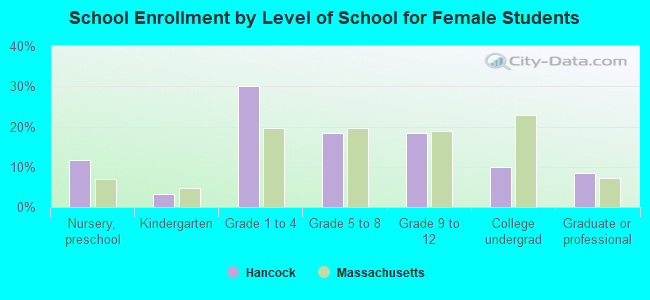
Private vs. public school enrollment:
| Here: | 22.1% |
| Massachusetts: | 10.8% |
| Here: | 0.0% |
| Massachusetts: | 12.2% |
| Here: | 38.5% |
| Massachusetts: | 48.2% |