Huntington, WV (West Virginia) Houses and Residents
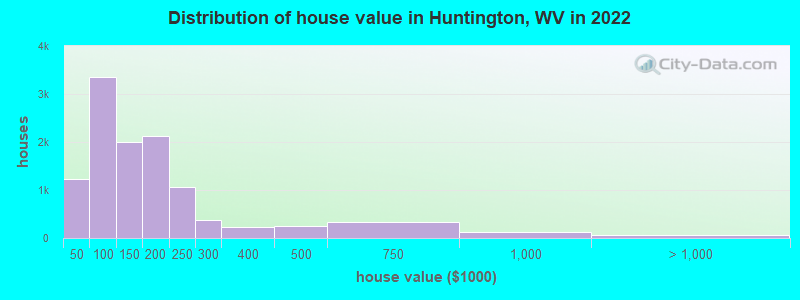
Estimated median house or condo value in 2022: $125,150 (it was $65,600 in 2000 )
Huntington:
$125,150West Virginia:
$155,100
Lower value quartile - upper value quartile: $82,704 - $191,612Mean price in 2022: Detached houses: $156,193 Here:
$156,193State:
$206,655
Townhouses or other attached units: $224,584 Here:
$224,584State:
$205,683
In 2-unit structures: $67,873 Here:
$67,873State:
$127,101
In 3-to-4-unit structures: $205,306 Here:
$205,306State:
$136,692
In 5-or-more-unit structures: $257,675 Here:
$257,675State:
$177,533
Mobile homes: $147,842 Here:
$147,842State:
$63,963
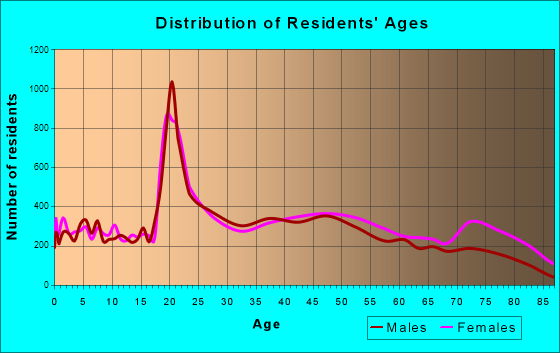
Total population: 48,807 (All urban)
Houses: 24,192 (19,386 occupied: 10,565 owner occupied, 8,861 renter occupied )
% of renters here:
46%State:
26%
Housing density: 1,520 houses/condos per square mile
Median price asked for vacant for-sale houses and condos in 2022: $110,979.
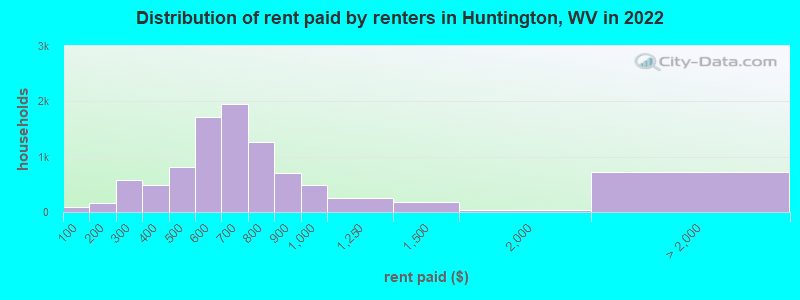
Median contract rent in 2022: $651 (lower quartile is $540, upper quartile is $781)
Median rent asked for vacant for-rent units in 2022: $867
Median gross rent in Huntington, WV in 2022: $876
Housing units in Huntington with a mortgage: 5,596 (231 second mortgage, 29 home equity loan, 186 both second mortgage and home equity loan )Houses without a mortgage: 245
Median household income for houses/condos with a mortgage: $86,752
Median household income for apartments without a mortgage: $40,713
Median monthly housing costs: $848
Data:
Median house or condo value ($)
Median house or condo value ($ change since 2000)
Median house or condo value ($) - White
Median house or condo value ($) - Black or African American
Median house or condo value ($) - Asian
Median house or condo value ($) - Hispanic or Latino
Median house or condo value ($) - American Indian and Alaska Native
Median house or condo value ($) - Multirace
Median house or condo value ($) - Other Race
Median price asked for mobile homes ($)
Household density (households per square mile)
Mean house or condo value by units in structure - 1, detached ($)
Mean house or condo value by units in structure - 1, attached ($)
Mean house or condo value by units in structure - 2 ($)
Mean house or condo value by units in structure by units in structure - 3 or 4 ($)
Mean house or condo value by units in structure - 5 or more ($)
Mean house or condo value by units in structure - Boat, RV, van, etc. ($)
Mean house or condo value by units in structure - Mobile home ($)
Median contract rent ($)
Median contract rent - Lower quartile ($)
Median contract rent - Upper quartile ($)
Median gross rent ($)
Urban houses (%)
Rural houses (%)
Houses occupied (%)
Houses occupied (% change since 2000)
Houses owner occupied (%)
Houses owner occupied (% change since 2000)
Houses renter occupied (%)
Houses renter occupied (% change since 2000)
Vacant housing units - For rent (%)
Vacant housing units - For rent (% change since 2000)
Vacant housing units - For sale only (%)
Vacant housing units - For sale only (% change since 2000)
Vacant housing units - Rented or sold, not occupied (%)
Vacant housing units - Rented or sold, not occupied (% change since 2000)
Vacant housing units - For seasonal, recreational, or occasional use (%)
Vacant housing units - For seasonal, recreational, or occasional use (% change since 2000)
Vacant housing units - For migrant workers (%)
Vacant housing units - For migrant workers (% change since 2000)
Vacant housing units - Other vacant (%)
Vacant housing units - Other vacant (% change since 2000)
Median monthly housing costs ($)
Median household income for houses/condos with a mortgage ($)
Median household income for houses/condos without a mortgage ($)
Median household income ($)
Median household income ($) - White
Median household income ($) - Black or African American
Median household income ($) - Asian
Median household income ($) - Hispanic or Latino
Median household income ($) - American Indian and Alaska Native
Median household income ($) - Multirace
Median household income ($) - Other Race
Mortgage status - with mortgage (%)
Mortgage status - with second mortgage (%)
Mortgage status - with home equity loan (%)
Mortgage status - with both second mortgage and home equity loan (%)
Mortgage status - without a mortgage (%)
Median year house/condo built
Median year apartment built
Household type by relationship - Male householder living alone (%)
Household type by relationship - Male householder not living alone (%)
Household type by relationship - Female householder living alone (%)
Household type by relationship - Female householder not living alone (%)
Household type by relationship - Opposite-Sex spouse (%)
Household type by relationship - Same-Sex spouse (%)
Household type by relationship - Opposite-Sex unmarried partner (%)
Household type by relationship - Same-Sex unmarried partner (%)
Household type by relationship - In group quarters (%)
Size of family households - 2-person household (%)
Size of family households - 3-person household (%)
Size of family households - 4-person household (%)
Size of family households - 5-person household (%)
Size of family households - 6-person household (%)
Size of family households - 7-or-more-person household (%)
Size of nonfamily households - 1-person household (%)
Size of nonfamily households - 2-person household (%)
Size of nonfamily households - 3-person household (%)
Size of nonfamily households - 4-person household (%)
Size of nonfamily households - 5-person household (%)
Size of nonfamily households - 6-person household (%)
Size of nonfamily households - 7-or-moreperson household (%)
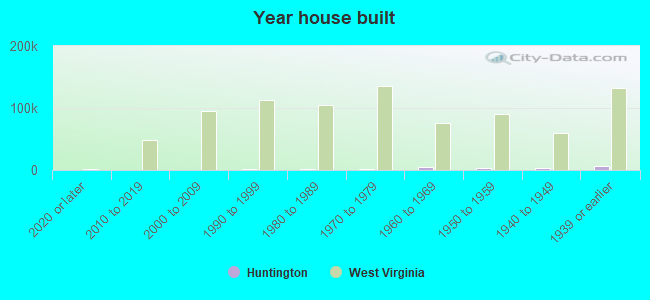
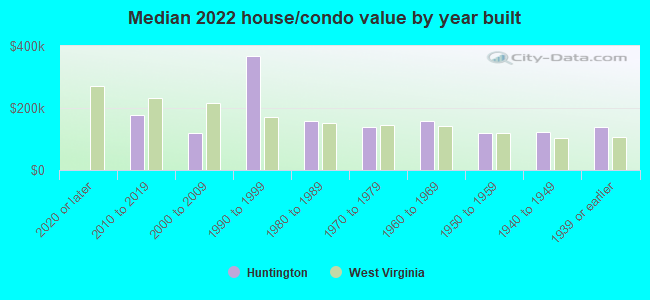
Year house built - Built 2010 or later (%)
Year house built - Built 2000 to 2009 (%)
Year house built - Built 1990 to 1999 (%)
Year house built - Built 1980 to 1989 (%)
Year house built - Built 1970 to 1979 (%)
Year house built - Built 1960 to 1969 (%)
Year house built - Built 1950 to 1959 (%)
Year house built - Built 1940 to 1949 (%)
Year house built - Built 1939 or earlier (%)
Median number of rooms in houses and condos
Median number of rooms in apartments
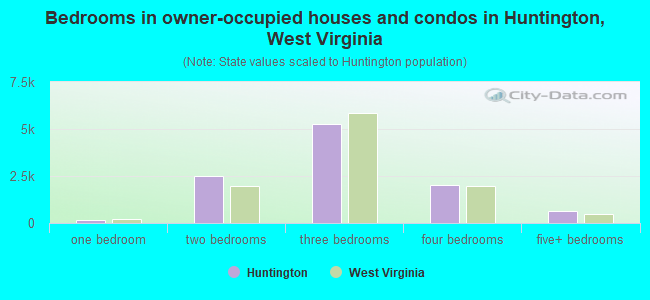
Median number of bedrooms in owner occupied houses
Mean number of bedrooms in owner occupied houses
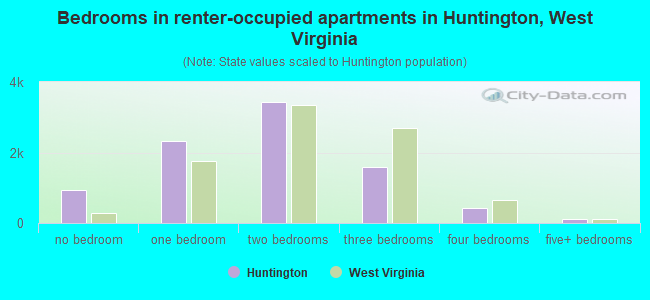
Median number of bedrooms in renter occupied houses
Mean number of bedrooms in renter occupied houses
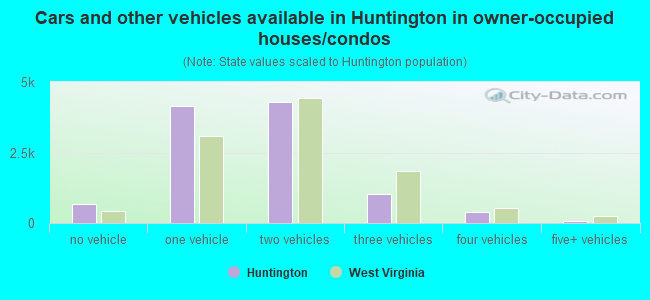
Median number of vehichles in owner occupied houses
Mean number of vehichles in owner occupied houses
Median number of vehichles in renter occupied houses
Mean number of vehichles in renter occupied houses
Rooms in owner-occupied houses - 1 room (%)
Rooms in owner-occupied houses - 2 rooms (%)
Rooms in owner-occupied houses - 3 rooms (%)
Rooms in owner-occupied houses - 4 rooms (%)
Rooms in owner-occupied houses - 5 rooms (%)
Rooms in owner-occupied houses - 6 rooms (%)
Rooms in owner-occupied houses - 7 rooms (%)
Rooms in owner-occupied houses - 8 rooms (%)
Rooms in owner-occupied houses - 9+ rooms (%)
Rooms in renter-occupied houses - 1 room (%)
Rooms in renter-occupied houses - 2 rooms (%)
Rooms in renter-occupied houses - 3 rooms (%)
Rooms in renter-occupied houses - 4 rooms (%)
Rooms in renter-occupied houses - 5 rooms (%)
Rooms in renter-occupied houses - 6 rooms (%)
Rooms in renter-occupied houses - 7 rooms (%)
Rooms in renter-occupied houses - 8 rooms (%)
Rooms in renter-occupied houses - 9+ rooms (%)
Bedrooms in owner-occupied houses - no bedrooms (%)
Bedrooms in owner-occupied houses - 1 bedroom (%)
Bedrooms in owner-occupied houses - 2 bedrooms (%)
Bedrooms in owner-occupied houses - 3 bedrooms (%)
Bedrooms in owner-occupied houses - 4 bedrooms (%)
Bedrooms in owner-occupied houses - 5+ bedrooms (%)
Bedrooms in renter-occupied houses - no bedrooms (%)
Bedrooms in renter-occupied houses - 1 bedroom (%)
Bedrooms in renter-occupied houses - 2 bedrooms (%)
Bedrooms in renter-occupied houses - 3 bedrooms (%)
Bedrooms in renter-occupied houses - 4 bedrooms (%)
Bedrooms in renter-occupied houses - 5+ bedrooms (%)
Vehicles available in owner-occupied houses - no vehicle available (%)
Vehicles available in owner-occupied houses - 1 vehicle available(%)
Vehicles available in owner-occupied houses - 2 Vehicles available (%)
Vehicles available in owner-occupied houses - 3 Vehicles available (%)
Vehicles available in owner-occupied houses - 4 Vehicles available (%)
Vehicles available in owner-occupied houses - 5+ Vehicles available (%)
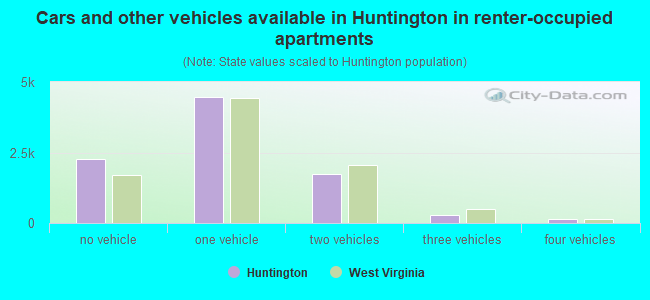
Vehicles available in renter-occupied houses - no vehicle available (%)
Vehicles available in renter-occupied houses - 1 vehicle available (%)
Vehicles available in renter-occupied houses - 2 Vehicles available (%)
Vehicles available in renter-occupied houses - 3 Vehicles available (%)
Vehicles available in renter-occupied houses - 4 Vehicles available (%)
Vehicles available in renter-occupied houses - 5+ Vehicles available (%)
Housing units in structures - 1, detached (%)
Housing units in structures - 1, attached (%)
Housing units in structures - 2 (%)
Housing units in structures - 3 or 4 (%)
Housing units in structures - 5 to 9 (%)
Housing units in structures - 10 to 19 (%)
Housing units in structures - 20 to 49 (%)
Housing units in structures - 50 or more (%)
Housing units in structures - Mobile home (%)
Housing units in structures - Boat, RV, van, etc. (%)
Housing units in structures - Owners - 1, detached (%)
Housing units in structures - Owners - 1, attached (%)
Housing units in structures - Owners - 2 (%)
Housing units in structures - Owners - 3 or 4 (%)
Housing units in structures - Owners - 5 to 9 (%)
Housing units in structures - Owners - 10 to 19 (%)
Housing units in structures - Owners - 20 to 49 (%)
Housing units in structures - Owners - 50 or more (%)
Housing units in structures - Owners - Mobile home (%)
Housing units in structures - Owners - Boat, RV, van, etc. (%)
Housing units in structures - Renters - 1, detached (%)
Housing units in structures - Renters - 1, attached (%)
Housing units in structures - Renters - 2 (%)
Housing units in structures - Renters - 3 or 4 (%)
Housing units in structures - Renters - 5 to 9 (%)
Housing units in structures - Renters - 10 to 19 (%)
Housing units in structures - Renters - 20 to 49 (%)
Housing units in structures - Renters - 50 or more (%)
Housing units in structures - Renters - Mobile home (%)
Housing units in structures - Renters - Boat, RV, van, etc. (%)
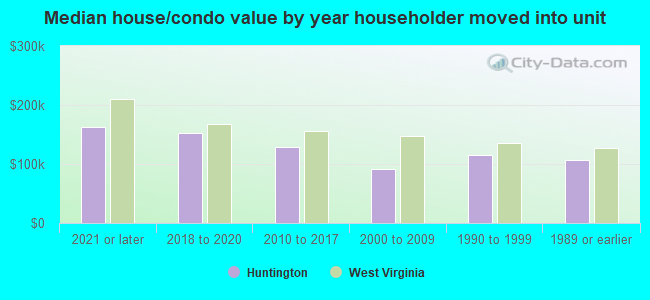
House/condo owner moved in on average (years ago)
Renter moved in on average (years ago)
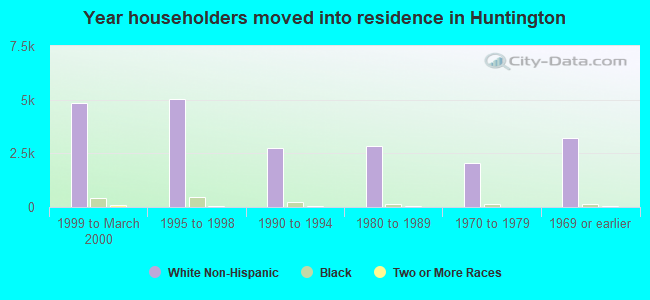
Year householder moved into unit - Moved in 1999 to March 2000 (%)
Year householder moved into unit - Moved in 1999 to March 2000 (%) - White
Year householder moved into unit - Moved in 1999 to March 2000 (%) - Black or African American
Year householder moved into unit - Moved in 1999 to March 2000 (%) - Asian
Year householder moved into unit - Moved in 1999 to March 2000 (%) - Hispanic or Latino
Year householder moved into unit - Moved in 1999 to March 2000 (%) - American Indian and Alaska Native
Year householder moved into unit - Moved in 1999 to March 2000 (%) - Multirace
Year householder moved into unit - Moved in 1999 to March 2000 (%) - Other Race
Year householder moved into unit - Moved in 1995 to 1998 (%)
Year householder moved into unit - Moved in 1995 to 1998 (%) - White
Year householder moved into unit - Moved in 1995 to 1998 (%) - Black or African American
Year householder moved into unit - Moved in 1995 to 1998 (%) - Asian
Year householder moved into unit - Moved in 1995 to 1998 (%) - Hispanic or Latino
Year householder moved into unit - Moved in 1995 to 1998 (%) - American Indian and Alaska Native
Year householder moved into unit - Moved in 1995 to 1998 (%) - Multirace
Year householder moved into unit - Moved in 1995 to 1998 (%) - Other Race
Year householder moved into unit - Moved in 1990 to 1994 (%)
Year householder moved into unit - Moved in 1990 to 1994 (%) - White
Year householder moved into unit - Moved in 1990 to 1994 (%) - Black or African American
Year householder moved into unit - Moved in 1990 to 1994 (%) - Asian
Year householder moved into unit - Moved in 1990 to 1994 (%) - Hispanic or Latino
Year householder moved into unit - Moved in 1990 to 1994 (%) - American Indian and Alaska Native
Year householder moved into unit - Moved in 1990 to 1994 (%) - Multirace
Year householder moved into unit - Moved in 1990 to 1994 (%) - Other Race
Year householder moved into unit - Moved in 1980 to 1989 (%)
Year householder moved into unit - Moved in 1980 to 1989 (%) - White
Year householder moved into unit - Moved in 1980 to 1989 (%) - Black or African American
Year householder moved into unit - Moved in 1980 to 1989 (%) - Asian
Year householder moved into unit - Moved in 1980 to 1989 (%) - Hispanic or Latino
Year householder moved into unit - Moved in 1980 to 1989 (%) - American Indian and Alaska Native
Year householder moved into unit - Moved in 1980 to 1989 (%) - Multirace
Year householder moved into unit - Moved in 1980 to 1989 (%) - Other Race
Year householder moved into unit - Moved in 1970 to 1979 (%)
Year householder moved into unit - Moved in 1970 to 1979 (%) - White
Year householder moved into unit - Moved in 1970 to 1979 (%) - Black or African American
Year householder moved into unit - Moved in 1970 to 1979 (%) - Asian
Year householder moved into unit - Moved in 1970 to 1979 (%) - Hispanic or Latino
Year householder moved into unit - Moved in 1970 to 1979 (%) - American Indian and Alaska Native
Year householder moved into unit - Moved in 1970 to 1979 (%) - Multirace
Year householder moved into unit - Moved in 1970 to 1979 (%) - Other Race
Year householder moved into unit - Moved in 1969 or earlier (%)
Year householder moved into unit - Moved in 1969 or earlier (%) - White
Year householder moved into unit - Moved in 1969 or earlier (%) - Black or African American
Year householder moved into unit - Moved in 1969 or earlier (%) - Asian
Year householder moved into unit - Moved in 1969 or earlier (%) - Hispanic or Latino
Year householder moved into unit - Moved in 1969 or earlier (%) - American Indian and Alaska Native
Year householder moved into unit - Moved in 1969 or earlier (%) - Multirace
Year householder moved into unit - Moved in 1969 or earlier (%) - Other Race
Housing units lacking complete plumbing facilities (%)
Housing units lacking complete kitchen facilities (%)
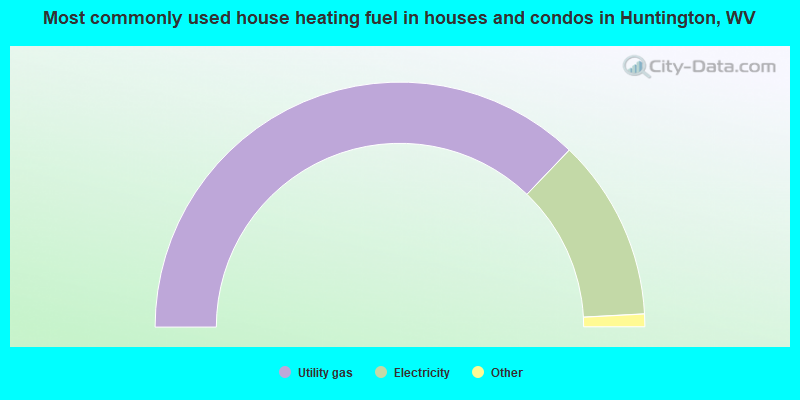
House heating fuel used in houses and condos - Utility gas (%)
House heating fuel used in houses and condos - Bottled, tank, or LP gas (%)
House heating fuel used in houses and condos - Electricity (%)
House heating fuel used in houses and condos - Fuel oil, kerosene, etc. (%)
House heating fuel used in houses and condos - Coal or coke (%)
House heating fuel used in houses and condos - Wood (%)
House heating fuel used in houses and condos - Solar energy (%)
House heating fuel used in houses and condos - Other fuel (%)
House heating fuel used in houses and condos - No fuel used (%)
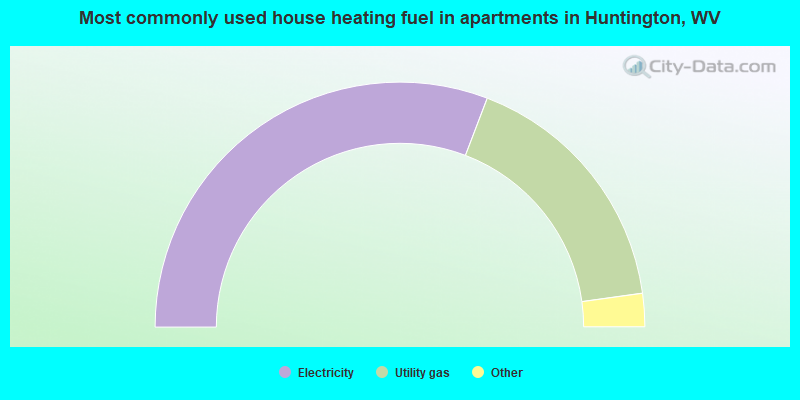
House heating fuel used in apartments - Utility gas (%)
House heating fuel used in apartments - Bottled, tank, or LP gas (%)
House heating fuel used in apartments - Electricity (%)
House heating fuel used in apartments - Fuel oil, kerosene, etc. (%)
House heating fuel used in apartments - Coal or coke (%)
House heating fuel used in apartments - Wood (%)
House heating fuel used in apartments - Solar energy (%)
House heating fuel used in apartments - Other fuel (%)
House heating fuel used in apartments - No fuel used (%)
Latest news about housing in Huntington, WV collected exclusively by city-data.com from local newspapers, TV, and radio stations
Median year house/condo built: 1950Median year apartment built: 1961Household type by relationship:
Households: 46,024
Male householders: 8,674 (3,724 living alone ), Female householders: 10,481 (4,311 living alone )6,414 spouses (6,369 opposite-sex spouses ), 1,695 unmarried partners , (1,607 opposite-sex unmarried partners ), 9,980 children (9,500 natural , 101 adopted , 377 stepchildren ), 1,071 grandchildren , 500 brothers or sisters , 437 parents , 16 foster children , 684 other relatives , 2,834 non-relatives In group quarters: 3,232
Size of family households: 4,595 2-persons , 2,479 3-persons , 1,461 4-persons , 718 5-persons , 111 6-persons , 99 7-or-more-persons .
Size of nonfamily households: 8,336 1-person , 1,711 2-persons , 303 3-persons , 98 4-persons , 2 5-persons , 6 6-persons , 6 7-or-more-persons .
3,711 married couples with children. single-parent households (978 men , 2,648 women ).
96.4% of residents of Huntington speak English at home. of residents speak Spanish at home (65% speak English very well , 25% speak English well , 10% speak English not well ).of residents speak other Indo-European language at home (79% speak English very well , 8% speak English well , 7% speak English not well , 6% don't speak English at all ).of residents speak Asian or Pacific Island language at home (65% speak English very well , 18% speak English well , 18% speak English not well ).of residents speak other language at home (91% speak English very well , 9% speak English well ).
Foreign born population: 703 (1.5%)of them are naturalized citizens )
Median number of rooms in houses and condos:
Median number of rooms in apartments
Owner-occupied Renter-occupied
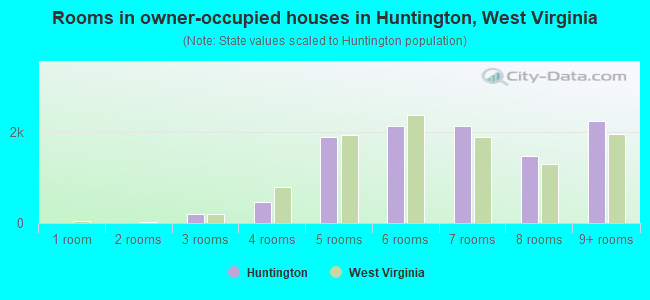
Rooms in owner-occupied houses in Huntington, West Virginia
0 1 room 0 2 rooms 188 3 rooms 454 4 rooms 1,908 5 rooms 2,145 6 rooms 2,144 7 rooms 1,470 8 rooms 2,257 9+ rooms
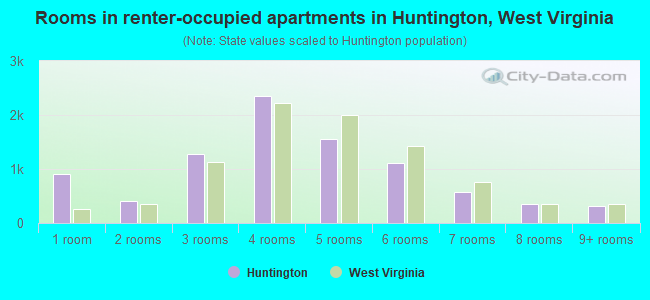
Rooms in renter-occupied apartments in Huntington, West Virginia
903 1 room 406 2 rooms 1,280 3 rooms 2,349 4 rooms 1,561 5 rooms 1,120 6 rooms 570 7 rooms 353 8 rooms 318 9+ rooms
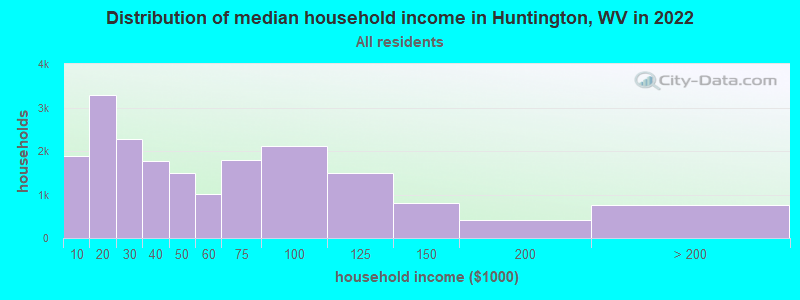
Huntington, WV household income distribution 1,890 Less than $10,0003,286 $10,000 to $19,9992,280 $20,000 to $29,9991,761 $30,000 to $39,9991,488 $40,000 to $49,9991,020 $50,000 to $59,9991,789 $60,000 to $74,9992,106 $75,000 to $99,9991,492 $100,000 to $124,999814 $125,000 to $149,999413 $150,000 to $199,999756 $200,000 or more
Home value of owner - occupied houses in 2022 in Huntington, WV 87 Less than $10,000134 $10,000 to $14,99932 $15,000 to $19,99996 $20,000 to $24,999114 $25,000 to $29,999244 $30,000 to $34,999135 $35,000 to $39,999386 $40,000 to $49,999247 $50,000 to $59,999489 $60,000 to $69,999354 $70,000 to $79,9991,003 $80,000 to $89,999872 $90,000 to $99,999720 $100,000 to $124,9991,280 $125,000 to $149,9991,270 $150,000 to $174,999844 $175,000 to $199,9991,052 $200,000 to $249,999365 $250,000 to $299,999230 $300,000 to $399,999239 $400,000 to $499,999335 $500,000 to $749,999125 $750,000 to $999,99963 $1,000,000 to $1,499,9996 $1,500,000 to $1,999,9991 $2,000,000 or moreRent paid by renters in 2022 in Huntington, WV 92 Less than $10039 $100 to $149117 $150 to $199360 $200 to $249219 $250 to $299114 $300 to $349368 $350 to $399640 $400 to $449177 $450 to $499868 $500 to $549840 $550 to $599956 $600 to $649986 $650 to $699769 $700 to $749504 $750 to $799701 $800 to $899485 $900 to $999246 $1,000 to $1,249173 $1,250 to $1,49927 $1,500 to $1,99917 $2,000 to $2,49956 $2,500 to $2,99941 $3,000 to $3,499613 No cash rent
Percentage of workers working in this county: 79.7%Number of people working at home: 1,933 (9.9% of all workers )
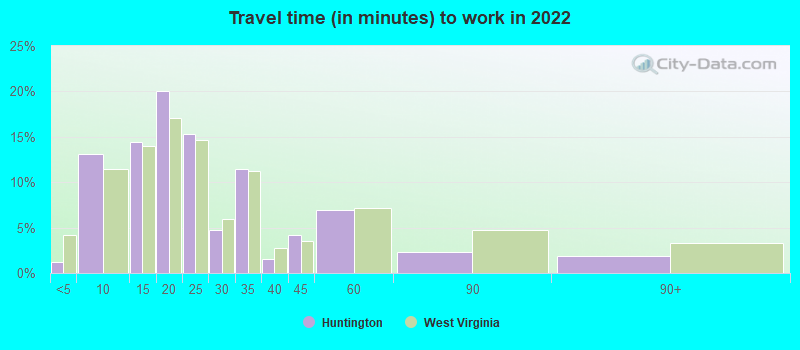
Travel time to work (commute)
Less than 5 minutes: 3175 to 9 minutes: 4,36710 to 14 minutes: 4,12815 to 19 minutes: 3,69820 to 24 minutes: 2,24925 to 29 minutes: 71630 to 34 minutes: 1,02635 to 39 minutes: 44540 to 44 minutes: 25045 to 59 minutes: 56860 to 89 minutes: 67890 or more minutes: 271
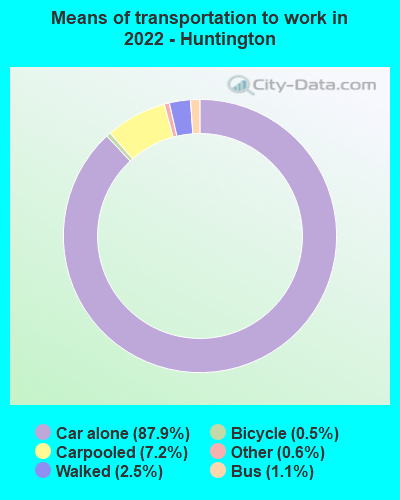
Means of transportation to work:
Drove a car alone: 30,359 (82.5%)Carpooled: 2,487 (6.8%)Bus : 364 (1.0%)Subway or elevated rail : 31 (0.1%)Taxi: 250 (0.7%)Bicycle: 75 (0.2%)Walked: 817 (2.2%)Worked at home: 1,933 (5.3%)
Unemployment by race in 2022
Unemployment rate for White non-Hispanic residents 11.2% Males4.6% FemalesUnemployment rate for Black residents 4.6% Males4.9% FemalesUnemployment rate for other race residents 6.0% Males12.6% FemalesUnemployment rate for two or more race residents 3.1% Males7.7% FemalesUnemployment rate for Hispanic or Latino residents 22.9% Females
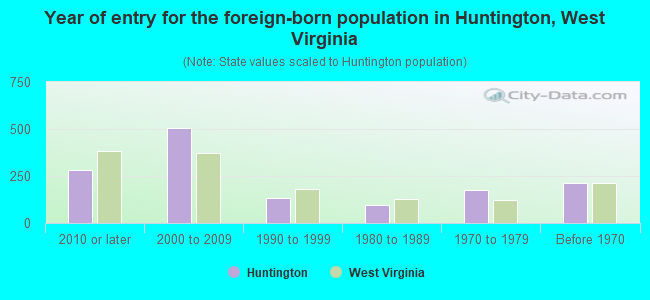
Year of entry for the foreign-born population in Huntington, West Virginia
282 2010 or later 503 2000 to 2009 134 1990 to 1999 96 1980 to 1989 175 1970 to 1979 213 Before 1970
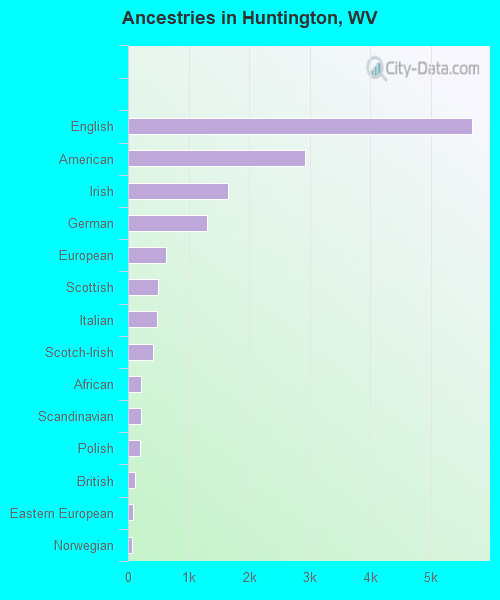
First ancestries reported:
English: 5,678 (30.0%)
American: 2,924 (15.5%)
Irish: 1,648 (8.7%)
German: 1,303 (6.9%)
European: 626 (3.3%)
Scottish: 493 (2.6%)
Italian: 485 (2.6%)
Scotch-Irish: 418 (2.2%)
African: 222 (1.2%)
Scandinavian: 208 (1.1%)
Polish: 192 (1.0%)
British: 115 (0.6%)
Eastern European: 80 (0.4%)
Norwegian: 71 (0.4%)
French: 46 (0.2%)
Northern European: 34 (0.2%)
Ghanaian: 25 (0.1%)
Swiss: 22 (0.1%)
Belgian: 21 (0.1%)
Czech: 21 (0.1%)
Slovak: 17 (0.09%)
Iranian: 17 (0.09%)
Trinidadian and Tobagonian: 16 (0.08%)
Lebanese: 15 (0.08%)
Brazilian: 13 (0.07%)
Greek: 13 (0.07%)
Canadian: 12 (0.06%)
Dutch: 11 (0.06%)
Nigerian: 11 (0.06%)
West Indian: 11 (0.06%)
Lithuanian: 10 (0.05%)
Czechoslovakian: 10 (0.05%)
Croatian: 9 (0.05%)
Hungarian: 8 (0.04%)
Portuguese: 7 (0.04%)
Russian: 7 (0.04%)
Welsh: 7 (0.04%)
Syrian: 3 (0.02%)
German Russian: 2 (0.01%) Most common places of birth for foreign-born residents (%): India Huntington:
19.5% (205)West Virginia:
7.2% (2,098)
Mexico Huntington:
10.4% (109)West Virginia:
7.4% (2,143)
China, excluding Hong Kong and Taiwan Huntington:
8.4% (88)West Virginia:
5.8% (1,673)
Taiwan Huntington:
8.0% (84)West Virginia:
0.7% (202)
Jamaica Huntington:
5.1% (54)West Virginia:
1.7% (479)
Germany Huntington:
3.1% (33)West Virginia:
5.5% (1,585)
Other Northern Europe Huntington:
3.0% (32)West Virginia:
0.2% (60)
Burma (Myanmar) Huntington:
2.9% (30)West Virginia:
0.5% (152)
Pakistan Huntington:
2.8% (29)West Virginia:
1.1% (326)
Vietnam Huntington:
2.7% (28)West Virginia:
3.0% (877)
Korea Huntington:
2.7% (28)West Virginia:
2.5% (733)
Philippines Huntington:
2.4% (25)West Virginia:
6.2% (1,798)
El Salvador Huntington:
2.0% (21)West Virginia:
2.5% (737)
Uganda Huntington:
2.0% (21)West Virginia:
0.1% (17)
Israel Huntington:
1.8% (19)West Virginia:
0.2% (58)
Thailand Huntington:
1.7% (18)West Virginia:
0.7% (207)
Canada Huntington:
1.6% (17)West Virginia:
4.3% (1,233)
Trinidad and Tobago Huntington:
1.5% (16)West Virginia:
0.5% (147)
Iran Huntington:
1.5% (16)West Virginia:
0.7% (196)
Place of birth for U.S.-born residents:
This state: 32,634Other state: 12,282Northeast: 1,329Midwest: 3,838South: 5,726West: 1,457 81.5% of Huntington residents lived in the same house 1 years ago.
Out of people who lived in different houses, 35.9% lived in this county.
Out of people who lived in different counties, 70.4% lived in West Virginia.
Huntington:
81.5%State average:
89.6%
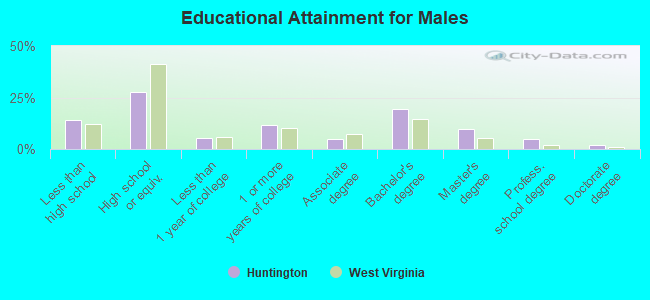
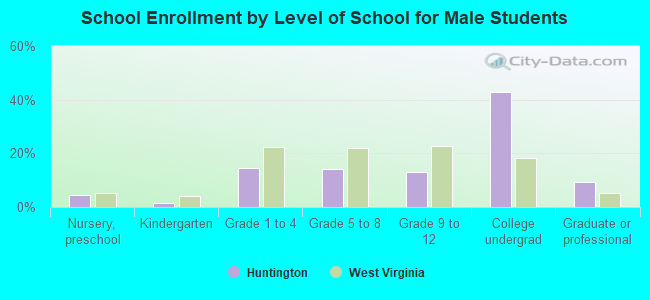
Education attainment for males 25 years and older:
No schooling: 95Nursery to 4th grade: 85th and 6th grade: 1807th and 8th grade: 1749th grade: 36410th grade: 37411th grade: 35012th grade, no diploma: 423High school graduate (or equivalency): 3,827Less than 1 year of college: 763Some college more than 1 year, no degree: 1,581Associate degree: 682Bachelor's degree: 2,673Master's degree: 1,351Professional school degree: 687Doctorate degree: 287
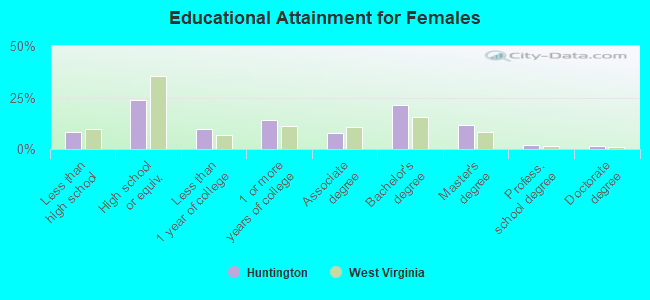
Education attainment for females 25 years and older:
No schooling: 281Nursery to 4th grade: 105th and 6th grade: 507th and 8th grade: 779th grade: 15210th grade: 35211th grade: 18812th grade, no diploma: 199High school graduate (or equivalency): 3,745Less than 1 year of college: 1,537Some college more than 1 year, no degree: 2,217Associate degree: 1,216Bachelor's degree: 3,415Master's degree: 1,825Professional school degree: 326Doctorate degree: 227
Housing units in structures:
One, detached: 15,963One, attached: 147Two: 1,4323 or 4: 1,5595 to 9: 1,50010 to 19: 1,59120 to 49: 74250 or more: 1,090Mobile homes: 165Housing units lacking complete plumbing facilities in 2022: 5.8%Housing units lacking complete kitchen facilities in 2022: 6.0%House/condo owner moved in on average 12 years ago
Renter moved in on average 1 years ago
Private vs. public school enrollment:
Students in private schools in grades 1 to 8 (elementary and middle school): 387 Here:
10.1%West Virginia:
12.2%
Students in private schools in grades 9 to 12 (high school): 158 Here:
11.1%West Virginia:
8.8%
Students in private undergraduate colleges: 236 Here:
3.8%West Virginia:
17.3%