Huntington, West Virginia Submit your own pictures of this city and show them to the world
OSM Map
General Map
Google Map
MSN Map
OSM Map
General Map
Google Map
MSN Map
OSM Map
General Map
Google Map
MSN Map
OSM Map
General Map
Google Map
MSN Map
Please wait while loading the map...
Population in 2022: 45,746 (100% urban, 0% rural). Population change since 2000: -11.1%Males: 21,554 Females: 24,192
March 2022 cost of living index in Huntington: 83.4 (less than average, U.S. average is 100) Percentage of residents living in poverty in 2022: 28.8%for White Non-Hispanic residents , 48.3% for Black residents , 44.9% for Hispanic or Latino residents , 18.9% for American Indian residents , 48.0% for other race residents , 40.1% for two or more races residents )
Profiles of local businesses
Business Search - 14 Million verified businesses
Data:
Median household income ($)
Median household income (% change since 2000)
Household income diversity
Ratio of average income to average house value (%)
Ratio of average income to average rent
Median household income ($) - White
Median household income ($) - Black or African American
Median household income ($) - Asian
Median household income ($) - Hispanic or Latino
Median household income ($) - American Indian and Alaska Native
Median household income ($) - Multirace
Median household income ($) - Other Race
Median household income for houses/condos with a mortgage ($)
Median household income for apartments without a mortgage ($)
Races - White alone (%)
Races - White alone (% change since 2000)
Races - Black alone (%)
Races - Black alone (% change since 2000)
Races - American Indian alone (%)
Races - American Indian alone (% change since 2000)
Races - Asian alone (%)
Races - Asian alone (% change since 2000)
Races - Hispanic (%)
Races - Hispanic (% change since 2000)
Races - Native Hawaiian and Other Pacific Islander alone (%)
Races - Native Hawaiian and Other Pacific Islander alone (% change since 2000)
Races - Two or more races (%)
Races - Two or more races (% change since 2000)
Races - Other race alone (%)
Races - Other race alone (% change since 2000)
Racial diversity
Unemployment (%)
Unemployment (% change since 2000)
Unemployment (%) - White
Unemployment (%) - Black or African American
Unemployment (%) - Asian
Unemployment (%) - Hispanic or Latino
Unemployment (%) - American Indian and Alaska Native
Unemployment (%) - Multirace
Unemployment (%) - Other Race
Population density (people per square mile)
Population - Males (%)
Population - Females (%)
Population - Males (%) - White
Population - Males (%) - Black or African American
Population - Males (%) - Asian
Population - Males (%) - Hispanic or Latino
Population - Males (%) - American Indian and Alaska Native
Population - Males (%) - Multirace
Population - Males (%) - Other Race
Population - Females (%) - White
Population - Females (%) - Black or African American
Population - Females (%) - Asian
Population - Females (%) - Hispanic or Latino
Population - Females (%) - American Indian and Alaska Native
Population - Females (%) - Multirace
Population - Females (%) - Other Race
Coronavirus confirmed cases (Apr 27, 2024)
Deaths caused by coronavirus (Apr 27, 2024)
Coronavirus confirmed cases (per 100k population) (Apr 27, 2024)
Deaths caused by coronavirus (per 100k population) (Apr 27, 2024)
Daily increase in number of cases (Apr 27, 2024)
Weekly increase in number of cases (Apr 27, 2024)
Cases doubled (in days) (Apr 27, 2024)
Hospitalized patients (Apr 18, 2022)
Negative test results (Apr 18, 2022)
Total test results (Apr 18, 2022)
COVID Vaccine doses distributed (per 100k population) (Sep 19, 2023)
COVID Vaccine doses administered (per 100k population) (Sep 19, 2023)
COVID Vaccine doses distributed (Sep 19, 2023)
COVID Vaccine doses administered (Sep 19, 2023)
Likely homosexual households (%)
Likely homosexual households (% change since 2000)
Likely homosexual households - Lesbian couples (%)
Likely homosexual households - Lesbian couples (% change since 2000)
Likely homosexual households - Gay men (%)
Likely homosexual households - Gay men (% change since 2000)
Cost of living index
Median gross rent ($)
Median contract rent ($)
Median monthly housing costs ($)
Median house or condo value ($)
Median house or condo value ($ change since 2000)
Mean house or condo value by units in structure - 1, detached ($)
Mean house or condo value by units in structure - 1, attached ($)
Mean house or condo value by units in structure - 2 ($)
Mean house or condo value by units in structure by units in structure - 3 or 4 ($)
Mean house or condo value by units in structure - 5 or more ($)
Mean house or condo value by units in structure - Boat, RV, van, etc. ($)
Mean house or condo value by units in structure - Mobile home ($)
Median house or condo value ($) - White
Median house or condo value ($) - Black or African American
Median house or condo value ($) - Asian
Median house or condo value ($) - Hispanic or Latino
Median house or condo value ($) - American Indian and Alaska Native
Median house or condo value ($) - Multirace
Median house or condo value ($) - Other Race
Median resident age
Resident age diversity
Median resident age - Males
Median resident age - Females
Median resident age - White
Median resident age - Black or African American
Median resident age - Asian
Median resident age - Hispanic or Latino
Median resident age - American Indian and Alaska Native
Median resident age - Multirace
Median resident age - Other Race
Median resident age - Males - White
Median resident age - Males - Black or African American
Median resident age - Males - Asian
Median resident age - Males - Hispanic or Latino
Median resident age - Males - American Indian and Alaska Native
Median resident age - Males - Multirace
Median resident age - Males - Other Race
Median resident age - Females - White
Median resident age - Females - Black or African American
Median resident age - Females - Asian
Median resident age - Females - Hispanic or Latino
Median resident age - Females - American Indian and Alaska Native
Median resident age - Females - Multirace
Median resident age - Females - Other Race
Commute - mean travel time to work (minutes)
Travel time to work - Less than 5 minutes (%)
Travel time to work - Less than 5 minutes (% change since 2000)
Travel time to work - 5 to 9 minutes (%)
Travel time to work - 5 to 9 minutes (% change since 2000)
Travel time to work - 10 to 19 minutes (%)
Travel time to work - 10 to 19 minutes (% change since 2000)
Travel time to work - 20 to 29 minutes (%)
Travel time to work - 20 to 29 minutes (% change since 2000)
Travel time to work - 30 to 39 minutes (%)
Travel time to work - 30 to 39 minutes (% change since 2000)
Travel time to work - 40 to 59 minutes (%)
Travel time to work - 40 to 59 minutes (% change since 2000)
Travel time to work - 60 to 89 minutes (%)
Travel time to work - 60 to 89 minutes (% change since 2000)
Travel time to work - 90 or more minutes (%)
Travel time to work - 90 or more minutes (% change since 2000)
Marital status - Never married (%)
Marital status - Now married (%)
Marital status - Separated (%)
Marital status - Widowed (%)
Marital status - Divorced (%)
Median family income ($)
Median family income (% change since 2000)
Median non-family income ($)
Median non-family income (% change since 2000)
Median per capita income ($)
Median per capita income (% change since 2000)
Median family income ($) - White
Median family income ($) - Black or African American
Median family income ($) - Asian
Median family income ($) - Hispanic or Latino
Median family income ($) - American Indian and Alaska Native
Median family income ($) - Multirace
Median family income ($) - Other Race
Median year house/condo built
Median year apartment built
Year house built - Built 2005 or later (%)
Year house built - Built 2000 to 2004 (%)
Year house built - Built 1990 to 1999 (%)
Year house built - Built 1980 to 1989 (%)
Year house built - Built 1970 to 1979 (%)
Year house built - Built 1960 to 1969 (%)
Year house built - Built 1950 to 1959 (%)
Year house built - Built 1940 to 1949 (%)
Year house built - Built 1939 or earlier (%)
Average household size
Household density (households per square mile)
Average household size - White
Average household size - Black or African American
Average household size - Asian
Average household size - Hispanic or Latino
Average household size - American Indian and Alaska Native
Average household size - Multirace
Average household size - Other Race
Occupied housing units (%)
Vacant housing units (%)
Owner occupied housing units (%)
Renter occupied housing units (%)
Vacancy status - For rent (%)
Vacancy status - For sale only (%)
Vacancy status - Rented or sold, not occupied (%)
Vacancy status - For seasonal, recreational, or occasional use (%)
Vacancy status - For migrant workers (%)
Vacancy status - Other vacant (%)
Residents with income below the poverty level (%)
Residents with income below 50% of the poverty level (%)
Children below poverty level (%)
Poor families by family type - Married-couple family (%)
Poor families by family type - Male, no wife present (%)
Poor families by family type - Female, no husband present (%)
Poverty status for native-born residents (%)
Poverty status for foreign-born residents (%)
Poverty among high school graduates not in families (%)
Poverty among people who did not graduate high school not in families (%)
Residents with income below the poverty level (%) - White
Residents with income below the poverty level (%) - Black or African American
Residents with income below the poverty level (%) - Asian
Residents with income below the poverty level (%) - Hispanic or Latino
Residents with income below the poverty level (%) - American Indian and Alaska Native
Residents with income below the poverty level (%) - Multirace
Residents with income below the poverty level (%) - Other Race
Air pollution - Air Quality Index (AQI)
Air pollution - CO
Air pollution - NO2
Air pollution - SO2
Air pollution - Ozone
Air pollution - PM10
Air pollution - PM25
Air pollution - Pb
Crime - Murders per 100,000 population
Crime - Rapes per 100,000 population
Crime - Robberies per 100,000 population
Crime - Assaults per 100,000 population
Crime - Burglaries per 100,000 population
Crime - Thefts per 100,000 population
Crime - Auto thefts per 100,000 population
Crime - Arson per 100,000 population
Crime - City-data.com crime index
Crime - Violent crime index
Crime - Property crime index
Crime - Murders per 100,000 population (5 year average)
Crime - Rapes per 100,000 population (5 year average)
Crime - Robberies per 100,000 population (5 year average)
Crime - Assaults per 100,000 population (5 year average)
Crime - Burglaries per 100,000 population (5 year average)
Crime - Thefts per 100,000 population (5 year average)
Crime - Auto thefts per 100,000 population (5 year average)
Crime - Arson per 100,000 population (5 year average)
Crime - City-data.com crime index (5 year average)
Crime - Violent crime index (5 year average)
Crime - Property crime index (5 year average)
1996 Presidential Elections Results (%) - Democratic Party (Clinton)
1996 Presidential Elections Results (%) - Republican Party (Dole)
1996 Presidential Elections Results (%) - Other
2000 Presidential Elections Results (%) - Democratic Party (Gore)
2000 Presidential Elections Results (%) - Republican Party (Bush)
2000 Presidential Elections Results (%) - Other
2004 Presidential Elections Results (%) - Democratic Party (Kerry)
2004 Presidential Elections Results (%) - Republican Party (Bush)
2004 Presidential Elections Results (%) - Other
2008 Presidential Elections Results (%) - Democratic Party (Obama)
2008 Presidential Elections Results (%) - Republican Party (McCain)
2008 Presidential Elections Results (%) - Other
2012 Presidential Elections Results (%) - Democratic Party (Obama)
2012 Presidential Elections Results (%) - Republican Party (Romney)
2012 Presidential Elections Results (%) - Other
2016 Presidential Elections Results (%) - Democratic Party (Clinton)
2016 Presidential Elections Results (%) - Republican Party (Trump)
2016 Presidential Elections Results (%) - Other
2020 Presidential Elections Results (%) - Democratic Party (Biden)
2020 Presidential Elections Results (%) - Republican Party (Trump)
2020 Presidential Elections Results (%) - Other
Ancestries Reported - Arab (%)
Ancestries Reported - Czech (%)
Ancestries Reported - Danish (%)
Ancestries Reported - Dutch (%)
Ancestries Reported - English (%)
Ancestries Reported - French (%)
Ancestries Reported - French Canadian (%)
Ancestries Reported - German (%)
Ancestries Reported - Greek (%)
Ancestries Reported - Hungarian (%)
Ancestries Reported - Irish (%)
Ancestries Reported - Italian (%)
Ancestries Reported - Lithuanian (%)
Ancestries Reported - Norwegian (%)
Ancestries Reported - Polish (%)
Ancestries Reported - Portuguese (%)
Ancestries Reported - Russian (%)
Ancestries Reported - Scotch-Irish (%)
Ancestries Reported - Scottish (%)
Ancestries Reported - Slovak (%)
Ancestries Reported - Subsaharan African (%)
Ancestries Reported - Swedish (%)
Ancestries Reported - Swiss (%)
Ancestries Reported - Ukrainian (%)
Ancestries Reported - United States (%)
Ancestries Reported - Welsh (%)
Ancestries Reported - West Indian (%)
Ancestries Reported - Other (%)
Educational Attainment - No schooling completed (%)
Educational Attainment - Less than high school (%)
Educational Attainment - High school or equivalent (%)
Educational Attainment - Less than 1 year of college (%)
Educational Attainment - 1 or more years of college (%)
Educational Attainment - Associate degree (%)
Educational Attainment - Bachelor's degree (%)
Educational Attainment - Master's degree (%)
Educational Attainment - Professional school degree (%)
Educational Attainment - Doctorate degree (%)
School Enrollment - Nursery, preschool (%)
School Enrollment - Kindergarten (%)
School Enrollment - Grade 1 to 4 (%)
School Enrollment - Grade 5 to 8 (%)
School Enrollment - Grade 9 to 12 (%)
School Enrollment - College undergrad (%)
School Enrollment - Graduate or professional (%)
School Enrollment - Not enrolled in school (%)
School enrollment - Public schools (%)
School enrollment - Private schools (%)
School enrollment - Not enrolled (%)
Median number of rooms in houses and condos
Median number of rooms in apartments
Housing units lacking complete plumbing facilities (%)
Housing units lacking complete kitchen facilities (%)
Density of houses
Urban houses (%)
Rural houses (%)
Households with people 60 years and over (%)
Households with people 65 years and over (%)
Households with people 75 years and over (%)
Households with one or more nonrelatives (%)
Households with no nonrelatives (%)
Population in households (%)
Family households (%)
Nonfamily households (%)
Population in families (%)
Family households with own children (%)
Median number of bedrooms in owner occupied houses
Mean number of bedrooms in owner occupied houses
Median number of bedrooms in renter occupied houses
Mean number of bedrooms in renter occupied houses
Median number of vehichles in owner occupied houses
Mean number of vehichles in owner occupied houses
Median number of vehichles in renter occupied houses
Mean number of vehichles in renter occupied houses
Mortgage status - with mortgage (%)
Mortgage status - with second mortgage (%)
Mortgage status - with home equity loan (%)
Mortgage status - with both second mortgage and home equity loan (%)
Mortgage status - without a mortgage (%)
Average family size
Average family size - White
Average family size - Black or African American
Average family size - Asian
Average family size - Hispanic or Latino
Average family size - American Indian and Alaska Native
Average family size - Multirace
Average family size - Other Race
Geographical mobility - Same house 1 year ago (%)
Geographical mobility - Moved within same county (%)
Geographical mobility - Moved from different county within same state (%)
Geographical mobility - Moved from different state (%)
Geographical mobility - Moved from abroad (%)
Place of birth - Born in state of residence (%)
Place of birth - Born in other state (%)
Place of birth - Native, outside of US (%)
Place of birth - Foreign born (%)
Housing units in structures - 1, detached (%)
Housing units in structures - 1, attached (%)
Housing units in structures - 2 (%)
Housing units in structures - 3 or 4 (%)
Housing units in structures - 5 to 9 (%)
Housing units in structures - 10 to 19 (%)
Housing units in structures - 20 to 49 (%)
Housing units in structures - 50 or more (%)
Housing units in structures - Mobile home (%)
Housing units in structures - Boat, RV, van, etc. (%)
House/condo owner moved in on average (years ago)
Renter moved in on average (years ago)
Year householder moved into unit - Moved in 1999 to March 2000 (%)
Year householder moved into unit - Moved in 1995 to 1998 (%)
Year householder moved into unit - Moved in 1990 to 1994 (%)
Year householder moved into unit - Moved in 1980 to 1989 (%)
Year householder moved into unit - Moved in 1970 to 1979 (%)
Year householder moved into unit - Moved in 1969 or earlier (%)
Means of transportation to work - Drove car alone (%)
Means of transportation to work - Carpooled (%)
Means of transportation to work - Public transportation (%)
Means of transportation to work - Bus or trolley bus (%)
Means of transportation to work - Streetcar or trolley car (%)
Means of transportation to work - Subway or elevated (%)
Means of transportation to work - Railroad (%)
Means of transportation to work - Ferryboat (%)
Means of transportation to work - Taxicab (%)
Means of transportation to work - Motorcycle (%)
Means of transportation to work - Bicycle (%)
Means of transportation to work - Walked (%)
Means of transportation to work - Other means (%)
Working at home (%)
Industry diversity
Most Common Industries - Agriculture, forestry, fishing and hunting, and mining (%)
Most Common Industries - Agriculture, forestry, fishing and hunting (%)
Most Common Industries - Mining, quarrying, and oil and gas extraction (%)
Most Common Industries - Construction (%)
Most Common Industries - Manufacturing (%)
Most Common Industries - Wholesale trade (%)
Most Common Industries - Retail trade (%)
Most Common Industries - Transportation and warehousing, and utilities (%)
Most Common Industries - Transportation and warehousing (%)
Most Common Industries - Utilities (%)
Most Common Industries - Information (%)
Most Common Industries - Finance and insurance, and real estate and rental and leasing (%)
Most Common Industries - Finance and insurance (%)
Most Common Industries - Real estate and rental and leasing (%)
Most Common Industries - Professional, scientific, and management, and administrative and waste management services (%)
Most Common Industries - Professional, scientific, and technical services (%)
Most Common Industries - Management of companies and enterprises (%)
Most Common Industries - Administrative and support and waste management services (%)
Most Common Industries - Educational services, and health care and social assistance (%)
Most Common Industries - Educational services (%)
Most Common Industries - Health care and social assistance (%)
Most Common Industries - Arts, entertainment, and recreation, and accommodation and food services (%)
Most Common Industries - Arts, entertainment, and recreation (%)
Most Common Industries - Accommodation and food services (%)
Most Common Industries - Other services, except public administration (%)
Most Common Industries - Public administration (%)
Occupation diversity
Most Common Occupations - Management, business, science, and arts occupations (%)
Most Common Occupations - Management, business, and financial occupations (%)
Most Common Occupations - Management occupations (%)
Most Common Occupations - Business and financial operations occupations (%)
Most Common Occupations - Computer, engineering, and science occupations (%)
Most Common Occupations - Computer and mathematical occupations (%)
Most Common Occupations - Architecture and engineering occupations (%)
Most Common Occupations - Life, physical, and social science occupations (%)
Most Common Occupations - Education, legal, community service, arts, and media occupations (%)
Most Common Occupations - Community and social service occupations (%)
Most Common Occupations - Legal occupations (%)
Most Common Occupations - Education, training, and library occupations (%)
Most Common Occupations - Arts, design, entertainment, sports, and media occupations (%)
Most Common Occupations - Healthcare practitioners and technical occupations (%)
Most Common Occupations - Health diagnosing and treating practitioners and other technical occupations (%)
Most Common Occupations - Health technologists and technicians (%)
Most Common Occupations - Service occupations (%)
Most Common Occupations - Healthcare support occupations (%)
Most Common Occupations - Protective service occupations (%)
Most Common Occupations - Fire fighting and prevention, and other protective service workers including supervisors (%)
Most Common Occupations - Law enforcement workers including supervisors (%)
Most Common Occupations - Food preparation and serving related occupations (%)
Most Common Occupations - Building and grounds cleaning and maintenance occupations (%)
Most Common Occupations - Personal care and service occupations (%)
Most Common Occupations - Sales and office occupations (%)
Most Common Occupations - Sales and related occupations (%)
Most Common Occupations - Office and administrative support occupations (%)
Most Common Occupations - Natural resources, construction, and maintenance occupations (%)
Most Common Occupations - Farming, fishing, and forestry occupations (%)
Most Common Occupations - Construction and extraction occupations (%)
Most Common Occupations - Installation, maintenance, and repair occupations (%)
Most Common Occupations - Production, transportation, and material moving occupations (%)
Most Common Occupations - Production occupations (%)
Most Common Occupations - Transportation occupations (%)
Most Common Occupations - Material moving occupations (%)
People in Group quarters - Institutionalized population (%)
People in Group quarters - Correctional institutions (%)
People in Group quarters - Federal prisons and detention centers (%)
People in Group quarters - Halfway houses (%)
People in Group quarters - Local jails and other confinement facilities (including police lockups) (%)
People in Group quarters - Military disciplinary barracks (%)
People in Group quarters - State prisons (%)
People in Group quarters - Other types of correctional institutions (%)
People in Group quarters - Nursing homes (%)
People in Group quarters - Hospitals/wards, hospices, and schools for the handicapped (%)
People in Group quarters - Hospitals/wards and hospices for chronically ill (%)
People in Group quarters - Hospices or homes for chronically ill (%)
People in Group quarters - Military hospitals or wards for chronically ill (%)
People in Group quarters - Other hospitals or wards for chronically ill (%)
People in Group quarters - Hospitals or wards for drug/alcohol abuse (%)
People in Group quarters - Mental (Psychiatric) hospitals or wards (%)
People in Group quarters - Schools, hospitals, or wards for the mentally retarded (%)
People in Group quarters - Schools, hospitals, or wards for the physically handicapped (%)
People in Group quarters - Institutions for the deaf (%)
People in Group quarters - Institutions for the blind (%)
People in Group quarters - Orthopedic wards and institutions for the physically handicapped (%)
People in Group quarters - Wards in general hospitals for patients who have no usual home elsewhere (%)
People in Group quarters - Wards in military hospitals for patients who have no usual home elsewhere (%)
People in Group quarters - Juvenile institutions (%)
People in Group quarters - Long-term care (%)
People in Group quarters - Homes for abused, dependent, and neglected children (%)
People in Group quarters - Residential treatment centers for emotionally disturbed children (%)
People in Group quarters - Training schools for juvenile delinquents (%)
People in Group quarters - Short-term care, detention or diagnostic centers for delinquent children (%)
People in Group quarters - Type of juvenile institution unknown (%)
People in Group quarters - Noninstitutionalized population (%)
People in Group quarters - College dormitories (includes college quarters off campus) (%)
People in Group quarters - Military quarters (%)
People in Group quarters - On base (%)
People in Group quarters - Barracks, unaccompanied personnel housing (UPH), (Enlisted/Officer), ;and similar group living quarters for military personnel (%)
People in Group quarters - Transient quarters for temporary residents (%)
People in Group quarters - Military ships (%)
People in Group quarters - Group homes (%)
People in Group quarters - Homes or halfway houses for drug/alcohol abuse (%)
People in Group quarters - Homes for the mentally ill (%)
People in Group quarters - Homes for the mentally retarded (%)
People in Group quarters - Homes for the physically handicapped (%)
People in Group quarters - Other group homes (%)
People in Group quarters - Religious group quarters (%)
People in Group quarters - Dormitories (%)
People in Group quarters - Agriculture workers' dormitories on farms (%)
People in Group quarters - Job Corps and vocational training facilities (%)
People in Group quarters - Other workers' dormitories (%)
People in Group quarters - Crews of maritime vessels (%)
People in Group quarters - Other nonhousehold living situations (%)
People in Group quarters - Other noninstitutional group quarters (%)
Residents speaking English at home (%)
Residents speaking English at home - Born in the United States (%)
Residents speaking English at home - Native, born elsewhere (%)
Residents speaking English at home - Foreign born (%)
Residents speaking Spanish at home (%)
Residents speaking Spanish at home - Born in the United States (%)
Residents speaking Spanish at home - Native, born elsewhere (%)
Residents speaking Spanish at home - Foreign born (%)
Residents speaking other language at home (%)
Residents speaking other language at home - Born in the United States (%)
Residents speaking other language at home - Native, born elsewhere (%)
Residents speaking other language at home - Foreign born (%)
Class of Workers - Employee of private company (%)
Class of Workers - Self-employed in own incorporated business (%)
Class of Workers - Private not-for-profit wage and salary workers (%)
Class of Workers - Local government workers (%)
Class of Workers - State government workers (%)
Class of Workers - Federal government workers (%)
Class of Workers - Self-employed workers in own not incorporated business and Unpaid family workers (%)
House heating fuel used in houses and condos - Utility gas (%)
House heating fuel used in houses and condos - Bottled, tank, or LP gas (%)
House heating fuel used in houses and condos - Electricity (%)
House heating fuel used in houses and condos - Fuel oil, kerosene, etc. (%)
House heating fuel used in houses and condos - Coal or coke (%)
House heating fuel used in houses and condos - Wood (%)
House heating fuel used in houses and condos - Solar energy (%)
House heating fuel used in houses and condos - Other fuel (%)
House heating fuel used in houses and condos - No fuel used (%)
House heating fuel used in apartments - Utility gas (%)
House heating fuel used in apartments - Bottled, tank, or LP gas (%)
House heating fuel used in apartments - Electricity (%)
House heating fuel used in apartments - Fuel oil, kerosene, etc. (%)
House heating fuel used in apartments - Coal or coke (%)
House heating fuel used in apartments - Wood (%)
House heating fuel used in apartments - Solar energy (%)
House heating fuel used in apartments - Other fuel (%)
House heating fuel used in apartments - No fuel used (%)
Armed forces status - In Armed Forces (%)
Armed forces status - Civilian (%)
Armed forces status - Civilian - Veteran (%)
Armed forces status - Civilian - Nonveteran (%)
Fatal accidents locations in years 2005-2021
Fatal accidents locations in 2005
Fatal accidents locations in 2006
Fatal accidents locations in 2007
Fatal accidents locations in 2008
Fatal accidents locations in 2009
Fatal accidents locations in 2010
Fatal accidents locations in 2011
Fatal accidents locations in 2012
Fatal accidents locations in 2013
Fatal accidents locations in 2014
Fatal accidents locations in 2015
Fatal accidents locations in 2016
Fatal accidents locations in 2017
Fatal accidents locations in 2018
Fatal accidents locations in 2019
Fatal accidents locations in 2020
Fatal accidents locations in 2021
Alcohol use - People drinking some alcohol every month (%)
Alcohol use - People not drinking at all (%)
Alcohol use - Average days/month drinking alcohol
Alcohol use - Average drinks/week
Alcohol use - Average days/year people drink much
Audiometry - Average condition of hearing (%)
Audiometry - People that can hear a whisper from across a quiet room (%)
Audiometry - People that can hear normal voice from across a quiet room (%)
Audiometry - Ears ringing, roaring, buzzing (%)
Audiometry - Had a job exposure to loud noise (%)
Audiometry - Had off-work exposure to loud noise (%)
Blood Pressure & Cholesterol - Has high blood pressure (%)
Blood Pressure & Cholesterol - Checking blood pressure at home (%)
Blood Pressure & Cholesterol - Frequently checking blood cholesterol (%)
Blood Pressure & Cholesterol - Has high cholesterol level (%)
Consumer Behavior - Money monthly spent on food at supermarket/grocery store
Consumer Behavior - Money monthly spent on food at other stores
Consumer Behavior - Money monthly spent on eating out
Consumer Behavior - Money monthly spent on carryout/delivered foods
Consumer Behavior - Income spent on food at supermarket/grocery store (%)
Consumer Behavior - Income spent on food at other stores (%)
Consumer Behavior - Income spent on eating out (%)
Consumer Behavior - Income spent on carryout/delivered foods (%)
Current Health Status - General health condition (%)
Current Health Status - Blood donors (%)
Current Health Status - Has blood ever tested for HIV virus (%)
Current Health Status - Left-handed people (%)
Dermatology - People using sunscreen (%)
Diabetes - Diabetics (%)
Diabetes - Had a blood test for high blood sugar (%)
Diabetes - People taking insulin (%)
Diet Behavior & Nutrition - Diet health (%)
Diet Behavior & Nutrition - Milk product consumption (# of products/month)
Diet Behavior & Nutrition - Meals not home prepared (#/week)
Diet Behavior & Nutrition - Meals from fast food or pizza place (#/week)
Diet Behavior & Nutrition - Ready-to-eat foods (#/month)
Diet Behavior & Nutrition - Frozen meals/pizza (#/month)
Drug Use - People that ever used marijuana or hashish (%)
Drug Use - Ever used hard drugs (%)
Drug Use - Ever used any form of cocaine (%)
Drug Use - Ever used heroin (%)
Drug Use - Ever used methamphetamine (%)
Health Insurance - People covered by health insurance (%)
Kidney Conditions-Urology - Avg. # of times urinating at night
Medical Conditions - People with asthma (%)
Medical Conditions - People with anemia (%)
Medical Conditions - People with psoriasis (%)
Medical Conditions - People with overweight (%)
Medical Conditions - Elderly people having difficulties in thinking or remembering (%)
Medical Conditions - People who ever received blood transfusion (%)
Medical Conditions - People having trouble seeing even with glass/contacts (%)
Medical Conditions - People with arthritis (%)
Medical Conditions - People with gout (%)
Medical Conditions - People with congestive heart failure (%)
Medical Conditions - People with coronary heart disease (%)
Medical Conditions - People with angina pectoris (%)
Medical Conditions - People who ever had heart attack (%)
Medical Conditions - People who ever had stroke (%)
Medical Conditions - People with emphysema (%)
Medical Conditions - People with thyroid problem (%)
Medical Conditions - People with chronic bronchitis (%)
Medical Conditions - People with any liver condition (%)
Medical Conditions - People who ever had cancer or malignancy (%)
Mental Health - People who have little interest in doing things (%)
Mental Health - People feeling down, depressed, or hopeless (%)
Mental Health - People who have trouble sleeping or sleeping too much (%)
Mental Health - People feeling tired or having little energy (%)
Mental Health - People with poor appetite or overeating (%)
Mental Health - People feeling bad about themself (%)
Mental Health - People who have trouble concentrating on things (%)
Mental Health - People moving or speaking slowly or too fast (%)
Mental Health - People having thoughts they would be better off dead (%)
Oral Health - Average years since last visit a dentist
Oral Health - People embarrassed because of mouth (%)
Oral Health - People with gum disease (%)
Oral Health - General health of teeth and gums (%)
Oral Health - Average days a week using dental floss/device
Oral Health - Average days a week using mouthwash for dental problem
Oral Health - Average number of teeth
Pesticide Use - Households using pesticides to control insects (%)
Pesticide Use - Households using pesticides to kill weeds (%)
Physical Activity - People doing vigorous-intensity work activities (%)
Physical Activity - People doing moderate-intensity work activities (%)
Physical Activity - People walking or bicycling (%)
Physical Activity - People doing vigorous-intensity recreational activities (%)
Physical Activity - People doing moderate-intensity recreational activities (%)
Physical Activity - Average hours a day doing sedentary activities
Physical Activity - Average hours a day watching TV or videos
Physical Activity - Average hours a day using computer
Physical Functioning - People having limitations keeping them from working (%)
Physical Functioning - People limited in amount of work they can do (%)
Physical Functioning - People that need special equipment to walk (%)
Physical Functioning - People experiencing confusion/memory problems (%)
Physical Functioning - People requiring special healthcare equipment (%)
Prescription Medications - Average number of prescription medicines taking
Preventive Aspirin Use - Adults 40+ taking low-dose aspirin (%)
Reproductive Health - Vaginal deliveries (%)
Reproductive Health - Cesarean deliveries (%)
Reproductive Health - Deliveries resulted in a live birth (%)
Reproductive Health - Pregnancies resulted in a delivery (%)
Reproductive Health - Women breastfeeding newborns (%)
Reproductive Health - Women that had a hysterectomy (%)
Reproductive Health - Women that had both ovaries removed (%)
Reproductive Health - Women that have ever taken birth control pills (%)
Reproductive Health - Women taking birth control pills (%)
Reproductive Health - Women that have ever used Depo-Provera or injectables (%)
Reproductive Health - Women that have ever used female hormones (%)
Sexual Behavior - People 18+ that ever had sex (vaginal, anal, or oral) (%)
Sexual Behavior - Males 18+ that ever had vaginal sex with a woman (%)
Sexual Behavior - Males 18+ that ever performed oral sex on a woman (%)
Sexual Behavior - Males 18+ that ever had anal sex with a woman (%)
Sexual Behavior - Males 18+ that ever had any sex with a man (%)
Sexual Behavior - Females 18+ that ever had vaginal sex with a man (%)
Sexual Behavior - Females 18+ that ever performed oral sex on a man (%)
Sexual Behavior - Females 18+ that ever had anal sex with a man (%)
Sexual Behavior - Females 18+ that ever had any kind of sex with a woman (%)
Sexual Behavior - Average age people first had sex
Sexual Behavior - Average number of female sex partners in lifetime (males 18+)
Sexual Behavior - Average number of female vaginal sex partners in lifetime (males 18+)
Sexual Behavior - Average age people first performed oral sex on a woman (18+)
Sexual Behavior - Average number of woman performed oral sex on in lifetime (18+)
Sexual Behavior - Average number of male sex partners in lifetime (males 18+)
Sexual Behavior - Average number of male anal sex partners in lifetime (males 18+)
Sexual Behavior - Average age people first performed oral sex on a man (18+)
Sexual Behavior - Average number of male oral sex partners in lifetime (18+)
Sexual Behavior - People using protection when performing oral sex (%)
Sexual Behavior - Average number of times people have vaginal or anal sex a year
Sexual Behavior - People having sex without condom (%)
Sexual Behavior - Average number of male sex partners in lifetime (females 18+)
Sexual Behavior - Average number of male vaginal sex partners in lifetime (females 18+)
Sexual Behavior - Average number of female sex partners in lifetime (females 18+)
Sexual Behavior - Circumcised males 18+ (%)
Sleep Disorders - Average hours sleeping at night
Sleep Disorders - People that has trouble sleeping (%)
Smoking-Cigarette Use - People smoking cigarettes (%)
Taste & Smell - People 40+ having problems with smell (%)
Taste & Smell - People 40+ having problems with taste (%)
Taste & Smell - People 40+ that ever had wisdom teeth removed (%)
Taste & Smell - People 40+ that ever had tonsils teeth removed (%)
Taste & Smell - People 40+ that ever had a loss of consciousness because of a head injury (%)
Taste & Smell - People 40+ that ever had a broken nose or other serious injury to face or skull (%)
Taste & Smell - People 40+ that ever had two or more sinus infections (%)
Weight - Average height (inches)
Weight - Average weight (pounds)
Weight - Average BMI
Weight - People that are obese (%)
Weight - People that ever were obese (%)
Weight - People trying to lose weight (%)
Officers per 1,000 residents here:
2.11West Virginia average:
1.95
Latest news from Huntington, WV collected exclusively by city-data.com from local newspapers, TV, and radio stations
Ancestries: English (24.4%), American (15.8%), Irish (8.3%), German (6.7%), European (3.7%), Italian (2.5%).
Current Local Time:
Land area: 15.9 square miles.
Population density: 2,874 people per square mile (average).
1,052 residents are foreign born (1.2% Asia , 0.6% Latin America , 0.3% Europe ).
This city:
2.3%West Virginia:
1.6%
Median real estate property taxes paid for housing units with mortgages in 2022: $897 (0.7%)Median real estate property taxes paid for housing units with no mortgage in 2022: $738 (0.6%)
Nearest city with pop. 200,000+: Columbus, OH
Nearest city with pop. 1,000,000+: Chicago, IL
Nearest cities:
Latitude: 38.41 N, Longitude: 82.43 W
Daytime population change due to commuting: +16,623 (+36.1%)Workers who live and work in this city: 12,929 (64.1%)
Single-family new house construction building permits:
2022: 7 buildings , average cost: $224,2002021: 4 buildings , average cost: $116,7002020: 2 buildings , average cost: $116,5002019: 5 buildings , average cost: $88,0002018: 7 buildings , average cost: $214,2002017: 4 buildings , average cost: $66,3002013: 2 buildings , average cost: $127,5002012: 14 buildings , average cost: $216,7002011: 12 buildings , average cost: $216,7002010: 12 buildings , average cost: $216,7002009: 12 buildings , average cost: $216,7002008: 16 buildings , average cost: $195,1002007: 35 buildings , average cost: $80,9002005: 20 buildings , average cost: $147,0002004: 9 buildings , average cost: $216,2002003: 14 buildings , average cost: $105,7002002: 10 buildings , average cost: $61,9002001: 12 buildings , average cost: $63,8002000: 19 buildings , average cost: $154,1001999: 25 buildings , average cost: $119,2001998: 18 buildings , average cost: $84,6001997: 25 buildings , average cost: $102,000Unemployment in December 2023: Here:
4.1%West Virginia:
4.0%
Most common occupations in Huntington, WV (%)
Both Males Females
Other sales and related occupations, including supervisors (4.9%)
Retail sales workers, except cashiers (4.6%)
Other office and administrative support workers, including supervisors (4.0%)
Cashiers (3.5%)
Building and grounds cleaning and maintenance occupations (3.3%)
Other management occupations, except farmers and farm managers (3.2%)
Preschool, kindergarten, elementary, and middle school teachers (3.0%)
Other sales and related occupations, including supervisors (4.8%)
Retail sales workers, except cashiers (4.3%)
Electrical equipment mechanics and other installation, maintenance, and repair workers, including supervisors (4.2%)
Sales representatives, services, wholesale and manufacturing (3.9%)
Other management occupations, except farmers and farm managers (3.9%)
Building and grounds cleaning and maintenance occupations (3.9%)
Driver/sales workers and truck drivers (3.7%)
Other office and administrative support workers, including supervisors (5.5%)
Secretaries and administrative assistants (5.4%)
Cashiers (5.1%)
Other sales and related occupations, including supervisors (5.1%)
Preschool, kindergarten, elementary, and middle school teachers (4.9%)
Retail sales workers, except cashiers (4.9%)
Waiters and waitresses (4.8%)
Tornado activity:
Huntington-area historical tornado activity is slightly above West Virginia state average. It is 60% smaller than the overall U.S. average.
On 4/23/1968, a category F5 (max. wind speeds 261-318 mph) tornado 28.0 miles away from the Huntington city center killed 7 people and injured 93 people and caused between $500,000 and $5,000,000 in damages.
On 4/8/1965, a category F3 (max. wind speeds 158-206 mph) tornado 7.4 miles away from the city center injured 3 people and caused between $50,000 and $500,000 in damages.
Earthquake activity:
Huntington-area historical earthquake activity is significantly above West Virginia state average. It is 8% greater than the overall U.S. average. On 7/27/1980 at 18:52:21, a magnitude 5.2 (5.1 MB, 4.7 MS, 5.0 UK, 5.2 UK, Class: Moderate, Intensity: VI - VII) earthquake occurred 83.2 miles away from Huntington center On 8/23/2011 at 17:51:04, a magnitude 5.8 (5.8 MW, Depth: 3.7 mi) earthquake occurred 247.0 miles away from the city center On 8/9/2020 at 12:07:37, a magnitude 5.1 (5.1 MW, Depth: 4.7 mi) earthquake occurred 152.9 miles away from the city center On 9/7/1988 at 02:28:09, a magnitude 4.6 (4.5 MB, 4.6 LG, Class: Light, Intensity: IV - V) earthquake occurred 80.6 miles away from Huntington center On 9/25/1998 at 19:52:52, a magnitude 5.2 (4.8 MB, 4.3 MS, 5.2 LG, 4.5 MW, Depth: 3.1 mi) earthquake occurred 238.7 miles away from Huntington center On 4/18/2008 at 09:36:59, a magnitude 5.4 (5.1 MB, 4.8 MS, 5.4 MW, 5.2 MW) earthquake occurred 295.4 miles away from the city center Magnitude types: regional Lg-wave magnitude (LG), body-wave magnitude (MB), surface-wave magnitude (MS), moment magnitude (MW) Natural disasters: The number of natural disasters in Cabell County (27) is a lot greater than the US average (15).Major Disasters (Presidential) Declared: 20Emergencies Declared: 5Floods: 16, Storms: 15, Landslides: 9, Mudslides: 5, Winter Storms: 4, Hurricanes: 2, Blizzard: 1, Fire: 1, Snowfall: 1, Tornado: 1, Wind: 1, Other: 2 (Note: some incidents may be assigned to more than one category). Main business address for: CHAMPION INDUSTRIES INC COMMERCIAL PRINTING ), UPTOWNER INNS INC HOTELS & MOTELS ), PREMIER FINANCIAL BANCORP INC STATE COMMERCIAL BANKS ).
Hospitals in Huntington: BETSY BROH HOUSE (1625 SIXTH AVENUE) CABELL-HUNTINGTON HOSPITAL INC (Voluntary non-profit - Private, provides emergency services, 1340 HAL GREER BOULEVARD) CORNERSTONE HOSPITAL OF HUNTINGTON ("2900 FIRST AVENUE, 2E") GUTHRIE MEMORIAL HOSPITAL INC (547 6TH AV) GUYANDOTTE GROUP HOME (209 RICHMOND STREET) HEALTHSOUTH REHABILITATION HOSPITAL OF HUNTINGTON (6900 WEST COUNTRY CLUB DRIVE) HOSPICE OF HUNTINGTON (1101 6TH AVENUE, P.O.BOX464) HUNTINGTON VA MEDICAL CENTER (Government Federal, provides emergency services, 1540 SPRING VALLEY ROAD) RIVER PARK HOSPITAL (1230 SIXTH AVENUE) ST MARY'S MEDICAL CENTER (Voluntary non-profit - Church, 2900 1ST AVENUE) Airports and heliports located in Huntington: Tri-State/Milton J Ferguson Field Airport (HTS) Runways: , Commercial Ops: 1,776, Air Taxi Ops: 4,403, Itinerant Ops: 5,778, Local Ops: 2,651, Military Ops: 593)Robert Newlon Field Airport (I41) Runways: , Itinerant Ops: 300, Local Ops: 4,000)Cabell Huntington Hospital Heliport (WV27) St Mary's Hospital Heliport (WV02) Va Medical Center Heliport (3WV2) See details about Airports and heliports located in Huntington, WV Amtrak station: HUNTINGTON (8TH AVE. & 10TH ST.)
.
Services: ticket office, fully wheelchair accessible, enclosed waiting area, public restrooms, public payphones, free short-term parking, free long-term parking, call for taxi service.
Colleges/Universities in Huntington: Marshall University Full-time enrollment: 11,450; Location: 1 John Marshall Dr; Public; Website: www.marshall.edu/; Offers Doctor's degree )
Mountwest Community and Technical College Full-time enrollment: 1,828; Location: One Mountwest Way; Public; Website: www.mctc.edu)
Huntington Junior College Full-time enrollment: 756; Location: 900 Fifth Ave; Private, for-profit; Website: www.huntingtonjuniorcollege.edu)
ITT Technical Institute-Huntington Full-time enrollment: 313; Location: 5183 US Route 60 Building 1 Ste40; Private, for-profit; Website: www.itt-tech.edu)
Huntington School of Beauty Culture-Main Campus Full-time enrollment: 148; Location: 5636 Us Route 60 East; Private, for-profit; Website: huntingtonschoolofbeauty.com/)
Cabell County Career Technology Center Full-time enrollment: 58; Location: 1035 Norway Ave; Public; Website: boe.cabe.k12.wv.us/ctc)
Other colleges/universities with over 2000 students near Huntington:
Ashland Community and Technical College (about 13 miles; Ashland, KY ; Full-time enrollment: 2,482)
West Virginia State University (about 37 miles; Institute, WV ; FT enrollment: 2,133)
Shawnee State University (about 38 miles; Portsmouth, OH ; FT enrollment: 4,160)
Big Sandy Community and Technical College (about 54 miles; Prestonsburg, KY ; FT enrollment: 2,660)
Morehead State University (about 57 miles; Morehead, KY ; FT enrollment: 7,523)
Ohio University-Main Campus (about 66 miles; Athens, OH ; FT enrollment: 26,181)
Hocking College (about 73 miles; Nelsonville, OH ; FT enrollment: 4,146)
Public high schools in Huntington: HUNTINGTON HIGH SCHOOL Students: 1,590, Location: 1 HIGHLANDER WAY, Grades: 9-12)SPRING VALLEY HIGH SCHOOL Students: 1,158, Location: #1 TIMBERWOLF DRIVE, Grades: 9-12)ALTERNATIVE EDUCATION HIGH SCHOOL Location: 2800 5TH AVE, Grades: 6-12)
CABELL COUNTY CAREER TECHNOLOGY CENTER Location: 1035 NORWAY AVE, Grades: PK-12)
Private high schools in Huntington: GRACE CHRISTIAN SCHOOL Students: 239, Location: 1111 ADAMS AVE, Grades: PK-12)
COVENANT SCHOOL Students: 161, Location: 2400 JOHNSTOWN RD, Grades: KG-12)
ST JOSEPH CATHOLIC HIGH SCHOOL Students: 137, Location: 600 13TH ST, Grades: 9-12)
Biggest public elementary/middle schools in Huntington: CENTRAL CITY ELEMENTARY SCHOOL Students: 570, Location: 2100 WASHINGTON AVE, Grades: PK-5)KELLOGG ELEMENTARY SCHOOL Students: 540, Location: 4415 PIEDMONT ROAD, Grades: PK-5)SPRING HILL ELEMENTARY SCHOOL Students: 447, Location: 1901 HALL AVENUE, Grades: PK-5)GENEVA KENT ELEMENTARY SCHOOL Students: 320, Location: 68 HOLLEY AVENUE, Grades: PK-5)ALTIZER ELEMENTARY SCHOOL Students: 284, Location: 250 THIRD STREET ALTIZER, Grades: PK-5)HIGHLAWN ELEMENTARY SCHOOL Students: 280, Location: 2549 1ST AVENUE, Grades: PK-5)GUYANDOTTE ELEMENTARY SCHOOL Students: 265, Location: 607 5TH AVE GUY, Grades: PK-5)VINSON MIDDLE SCHOOL Students: 255, Location: 3851 PIEDMONT ROAD, Grades: 6-8)HITE SAUNDERS ELEMENTARY SCHOOL Students: 241, Location: 3708 GREEN VALLEY ROAD, Grades: PK-5)MEADOWS ELEMENTARY SCHOOL Students: 216, Location: 1601 WASHINGTON BLVD, Grades: PK-5)Private elementary/middle schools in Huntington: ST JOSEPH GRADE SCHOOL Students: 405, Location: 1326 6TH AVE, Grades: PK-8)
OUR LADY OF FATIMA PARISH SCHOOL Students: 187, Location: 535 NORWAY AVE, Grades: PK-8)
See full list of schools located in Huntington Library in Huntington: CABELL COUNTY PUBLIC LIBRARY Operating income: $3,376,989; Location: 455 9TH STREET; 439,885 books ; 16 e-books ; 19,140 audio materials ; 25,281 video materials ; 17 local licensed databases ; 12 state licensed databases ; 686 print serial subscriptions ; 14 electronic serial subscriptions )
User-submitted facts and corrections:
Covenant School is another private school in the Huntington area.
IN THE CATERGORY FOR CHURCHES PLEASE LIST THE FOLLOWING: AME CHURCHES: Young Chapel AME Church 840 18th Street Huntington, West Virginia 25703
Soupy Sales was resident of huntington
Notable locations in Huntington: (A) , Crawford Landing (B) , Huntington Manufacturing Center (C) , Cabell County Public Library (D) , Cam Henderson Center (E) , Life Ambulance Service Incorporated (F) , Foster Memorial Home (G) , Jan - Care Ambulance Service Incorporated Huntington (H) , Cabell County Emergency Medical Services 2 (I) , Huntington Fire Department Station 4 West Huntington (J) , Huntington Fire Department Station 2 University (K) , Henrietta Payne Memorial Boys Club of Huntington (L) , Huntington Fire Department Station 10 Gallagher (M) , Huntington Fire Department Station 5 Guyandotte (N) , Fire Station Number 6 (O) , Gallaher Village Branch Cabell County Public Library (P) , Guyandotte Branch Cabell County Public Library (Q) , Cabell County Emergency Medical Services 3 (R) , Huntington City Hall (S) , Huntington Fire Department Station 8 Westmoreland (T) . Display/hide their locations on the map
Shopping Centers: (1) , First Street Shopping Center (2) , Harts Family Shopping Center (3) , Huntington Plaza Shopping Center (4) , Westland Plaza Shopping Center (5) . Display/hide their locations on the map
Main business address in Huntington include: (A) , UPTOWNER INNS INC (B) . Display/hide their locations on the map
Churches in Huntington include: (A) , Grace Gospel Church (B) , Glorious Church of God in Christ (C) , First Free Will Baptist Church (D) , Fifth Avenue Baptist Church (E) , Enslow Park Presbyterian Church (F) , First United Methodist Church (G) , First Presbyterian Church (H) , First Congregational Church (I) . Display/hide their locations on the map
Cemeteries: (1) , Harveytown Cemetery (2) , Highland Cemetery (3) , Woodmere Memorial Park (4) , Guyandotte United Methodist Church Cemetery (5) , Spring Hill Cemetery (6) , Bethel Memorial Park (7) . Display/hide their locations on the map
Streams, rivers, and creeks: (A) , Medley Fork (B) , Guyandotte River (C) , Fourpole Creek (D) . Display/hide their locations on the map
Parks in Huntington include: (1) , Saint Cloud Commons (2) , Kiwanis Park (3) , Ninth Street West Historic District (4) , Ritter Park Historic District (5) , Altizer Park (6) , David Harris Riverfront Park (7) , United States Post Office and Courthouse Historic District (8) , Riverside Park (9) . Display/hide their locations on the map
Tourist attractions: (1) , Huntington Fire Museum (816 9th Street) (2) , New River Train (Historical Places & Services; 1323 8th Avenue) (3) , Mills & Company Inc (Amusement & Theme Parks; 214 4th Street) (4) , Wacky Tacky Teeth (Arcades & Amusements; 452 5th Avenue) (5) , Croswell-Tours (Tours & Charters; 4401 Earl Ct.) (6) . Display/hide their approximate locations on the map
Hotels: (1) , Cabell Huntington Hospital (1340 Hal Greer Boulevard) (2) , Garden Park (500 Garden Lane) (3) , Radisson Hotel Huntington (101 3rd Avenue) (4) , Econo Lodge Huntington (3325 US 60 East) (5) , Holiday Inn Hotel & Suites (800 3rd Avenue) (6) , Ramada Ltd Conference Center (3094 16th Street) (7) , Travelodge-Uptowner Inn-U (1415 4th Avenue) (8) , Detemple Ronald E (6300 Beech Drive Ofc) (9) . Display/hide their approximate locations on the map
Court: (1) . Display/hide its approximate location on the map
Birthplace of: O. J. Mayo - Professional basketball player, Brad Dourif - (born 1950), actor, Bill Walker (basketball) - Professional basketball player, Carwood Lipton - Soilder, Jim Grobe - College football player, Justice M. Chambers - Marine Corps Medal of Honor recipient, Peter Marshall (U.S. entertainer) - Game show host, Anna Fitziu - Singer, Beau Smith - Writer, William C. Campbell - Amateur golfer.
Cabell County has a predicted average indoor radon screening level between 2 and 4 pCi/L (pico curies per liter) - Moderate Potential Drinking water stations with addresses in Huntington and their reported violations in the past:
VAMC - HUNTINGTON (Address: 1540 SPRING VALLEY DRIVE Population served: 1,759, Purch surface water):
Past monitoring violations:
2 routine major monitoring violations
One minor monitoring violation
Address: 3888 RT 75 Population served: 375, Purch surface water):
Past monitoring violations:
One minor monitoring violation
Serves VA, Population served: 40, Groundwater):
Past monitoring violations:
One routine major monitoring violation
Serves OH, Population served: 38, Groundwater):
Past monitoring violations:
2 routine major monitoring violations
One minor monitoring violation
Serves OH, Population served: 31, Groundwater):
Past monitoring violations:
3 routine major monitoring violations
One regular monitoring violation
Drinking water stations with addresses in Huntington that have no violations reported:
WVAWC - HUNTINGTON DIST (Address: 4002 OHIO RIVER ROAD Population served: 86,827, Primary Water Source Type: Surface water)
LAVALETTE PSD (Address: 3888 RT 75 Population served: 7,043, Primary Water Source Type: Purch surface water)
LAVALETTE PSD - EASTERN DISTRICT (Address: 3888 RT 75 Population served: 375, Primary Water Source Type: Purch surface water)
Average household size: This city:
2.1 peopleWest Virginia:
2.4 people
Percentage of family households: This city:
50.5%Whole state:
65.8%
Percentage of households with unmarried partners: This city:
7.8%Whole state:
6.6%
Likely homosexual households (counted as self-reported same-sex unmarried-partner households)
Lesbian couples: 0.5% of all households Gay men: 0.4% of all households
People in group quarters in Huntington in 2010:
1,973 people in college/university student housing
412 people in nursing facilities/skilled-nursing facilities
155 people in emergency and transitional shelters (with sleeping facilities) for people experiencing homelessness
94 people in hospitals with patients who have no usual home elsewhere
73 people in other noninstitutional facilities
71 people in mental (psychiatric) hospitals and psychiatric units in other hospitals
71 people in group homes intended for adults
67 people in correctional residential facilities
64 people in residential treatment centers for adults
27 people in residential treatment centers for juveniles (non-correctional)
5 people in in-patient hospice facilities
People in group quarters in Huntington in 2000:
1,662 people in college dormitories (includes college quarters off campus)
470 people in nursing homes
208 people in mental (psychiatric) hospitals or wards
189 people in local jails and other confinement facilities (including police lockups)
117 people in other noninstitutional group quarters
57 people in halfway houses
41 people in homes or halfway houses for drug/alcohol abuse
39 people in homes for the mentally retarded
33 people in residential treatment centers for emotionally disturbed children
20 people in wards in general hospitals for patients who have no usual home elsewhere
14 people in homes for the mentally ill
8 people in other nonhousehold living situations
5 people in agriculture workers' dormitories on farms
3 people in other group homes
Arena or stadium:
Big Sandy Superstore Arena. Capacity: 9,000.
Banks with most branches in Huntington (2011 data):
JPMorgan Chase Bank, National Association: Huntington Main Branch, Lavalette Branch, 20th Street Branch. Info updated 2011/11/10: Bank assets: $1,811,678.0 mil, Deposits: $1,190,738.0 mil, headquarters in Columbus, OH, positive income , International Specialization, 5577 total offices , Holding Company: Jpmorgan Chase & Co.
City National Bank of West Virginia: Fifth Avenue Facility, Huntington Branch, Huntington Branch. Info updated 2008/01/10: Bank assets: $2,753.2 mil, Deposits: $2,223.1 mil, headquarters in Charleston, WV, positive income , Commercial Lending Specialization, 68 total offices , Holding Company: City Holding Company
Huntington Federal Savings Bank: East Hills Mall Branch, Westmoreland Branch, at 1049 5th Avenue. Info updated 2011/07/21: Bank assets: $520.5 mil, Deposits: $453.5 mil, local headquarters , positive income , Mortgage Lending Specialization, 5 total offices
Branch Banking and Trust Company: Pea Ridge/Barboursville Branch, Huntington Main Branch, Huntington Fairfield Branch. Info updated 2010/03/29: Bank assets: $168,867.6 mil, Deposits: $127,549.5 mil, headquarters in Winston Salem, NC, positive income , Commercial Lending Specialization, 1793 total offices , Holding Company: Bb&T Corporation
The Huntington National Bank: Barboursville Branch at 5704 Route 60 East, branch established on 2004/04/26; Huntington Branch at 919 Fifth Avenue, branch established on 1939/10/10. Info updated 2012/04/02: Bank assets: $54,183.4 mil, Deposits: $44,300.3 mil, headquarters in Columbus, OH, positive income , Commercial Lending Specialization, 878 total offices , Holding Company: Huntington Bancshares Incorporated
United Bank: Huntington Branch at 2889 Third Ave, branch established on 1980/09/15; Westmoreland Branch at 473 Camden Road, branch established on 1986/12/01. Info updated 2007/09/20: Bank assets: $3,625.4 mil, Deposits: $3,023.8 mil, headquarters in Parkersburg, WV, positive income , Commercial Lending Specialization, 56 total offices , Holding Company: United Bankshares, Inc.
First Sentry Bank, Inc.: at 823 Eighth Street, branch established on 1996/10/23; U.S. Route 60 East Branch at 5604 U.S. Route 60 East, branch established on 2000/04/17. Info updated 2009/10/09: Bank assets: $496.1 mil, Deposits: $401.8 mil, local headquarters , positive income , Commercial Lending Specialization, 4 total offices , Holding Company: First Sentry Bancshares, Inc.
Fifth Third Bank: Huntington Downtown Branch at 517 9th Street, branch established on 2002/01/14; Hal Greer Banking Center at 1566 Hal Greer Boulevard, branch established on 2006/09/25. Info updated 2009/10/05: Bank assets: $114,540.4 mil, Deposits: $89,689.1 mil, headquarters in Cincinnati, OH, positive income , Commercial Lending Specialization, 1378 total offices , Holding Company: Fifth Third Bancorp
Peoples Bank, National Association: Fifth Avenue Office at 101 5th Avenue, branch established on 2007/11/13; South East Hills Branch at 1126 Twentieth Street, branch established on 1995/11/03. Info updated 2006/11/29: Bank assets: $1,788.7 mil, Deposits: $1,356.7 mil, headquarters in Marietta, OH, positive income , Commercial Lending Specialization, 45 total offices , Holding Company: Peoples Bancorp Inc.
5 other banks with 5 local branches
For population 15 years and over in Huntington:
Never married: 41.1%Now married: 38.6%Separated: 1.4%Widowed: 6.7%Divorced: 12.2% For population 25 years and over in Huntington:
High school or higher: 88.9%Bachelor's degree or higher: 32.3%Graduate or professional degree: 14.8%Unemployed: 10.7%Mean travel time to work (commute): 16.9 minutes
Education Gini index (Inequality in education) Here:
12.1West Virginia average:
11.1
Religion statistics for Huntington, WV (based on Cabell County data)
Religion Adherents Congregations Mainline Protestant 18,454 60 Evangelical Protestant 13,824 74 Catholic 3,052 5 Other 1,771 11 Black Protestant 415 4 Orthodox 255 2 None 58,548 -
Source: Clifford Grammich, Kirk Hadaway, Richard Houseal, Dale E.Jones, Alexei Krindatch, Richie Stanley and Richard H.Taylor. 2012. 2010 U.S.Religion Census: Religious Congregations & Membership Study. Association of Statisticians of American Religious Bodies. Jones, Dale E., et al. 2002. Congregations and Membership in the United States 2000. Nashville, TN: Glenmary Research Center. Graphs represent county-level data
Food Environment Statistics: Number of grocery stores : 18Here :
1.91 / 10,000 pop.West Virginia :
2.41 / 10,000 pop.
Number of convenience stores (no gas) : 9This county :
0.95 / 10,000 pop.West Virginia :
1.09 / 10,000 pop.
Number of convenience stores (with gas) : 40This county :
4.24 / 10,000 pop.State :
5.38 / 10,000 pop.
Number of full-service restaurants : 76Cabell County :
8.05 / 10,000 pop.West Virginia :
6.22 / 10,000 pop.
Adult diabetes rate : Cabell County :
13.9%West Virginia :
12.2%
Adult obesity rate : Cabell County :
31.0%State :
31.1%
Low-income preschool obesity rate : Cabell County :
16.7%West Virginia :
13.1%
Health and Nutrition: Healthy diet rate : Huntington:
53.1%West Virginia:
51.8%
Average overall health of teeth and gums : Huntington:
52.5%West Virginia:
49.7%
People feeling badly about themselves : Huntington:
18.2%West Virginia:
20.4%
People not drinking alcohol at all : Huntington:
9.0%West Virginia:
9.7%
Average hours sleeping at night : This city:
6.9West Virginia:
6.9
Overweight people : Huntington:
33.4%State:
34.8%
General health condition : This city:
60.1%West Virginia:
58.4%
Average condition of hearing : Huntington:
79.9%West Virginia:
78.6%
More about Health and Nutrition of Huntington, WV Residents
Local government employment and payroll (March 2022)
Function
Full-time employees
Monthly full-time payroll
Average yearly full-time wage
Part-time employees
Monthly part-time payroll
Police Protection - Officers
96 $521,192 $65,149 0 $0 Firefighters
83 $405,816 $58,672 0 $0 Other and Unallocable
40 $154,517 $46,355 5 $5,317 Solid Waste Management
34 $99,928 $35,269 0 $0 Financial Administration
27 $115,461 $51,316 0 $0 Streets and Highways
23 $75,171 $39,220 0 $0 Other Government Administration
22 $114,749 $62,590 1 $750 Judicial and Legal
6 $33,662 $67,324 2 $2,282 Police - Other
5 $16,500 $39,600 0 $0 Housing and Community Development (Local)
5 $21,925 $52,620 0 $0 Parks and Recreation
2 $7,357 $44,142 4 $4,290 Fire - Other
1 $3,509 $42,108 0 $0 Welfare
1 $4,772 $57,264 0 $0
Totals for Government
345 $1,574,560 $54,767 12 $12,640
Huntington government finances - Expenditure in 2021 (per resident):
Construction - General - Other: $2,182,000 ($47.70)
Current Operations - Sewerage: $15,311,000 ($334.70)
Financial Administration: $12,409,000 ($271.26)Police Protection: $7,945,000 ($173.68)Local Fire Protection: $6,117,000 ($133.72)Central Staff Services: $4,232,000 ($92.51)Solid Waste Management: $3,589,000 ($78.45)General - Other: $3,088,000 ($67.50)Housing and Community Development: $2,267,000 ($49.56)Parks and Recreation: $2,231,000 ($48.77)Regular Highways: $1,567,000 ($34.25)Parking Facilities: $771,000 ($16.85)Public Welfare - Other: $535,000 ($11.70)General Public Buildings: $500,000 ($10.93)Judicial and Legal Services: $475,000 ($10.38)Protective Inspection and Regulation - Other: $422,000 ($9.22)General - Interest on Debt: $120,000 ($2.62)
Other Capital Outlay - General - Other: $3,427,000 ($74.91)
Solid Waste Management: $220,000 ($4.81)Total Salaries and Wages: $21,392,000 ($467.63)
Huntington government finances - Revenue in 2021 (per resident):
Charges - Sewerage: $17,054,000 ($372.80)
Other: $13,271,000 ($290.10)Solid Waste Management: $1,647,000 ($36.00)Parking Facilities: $621,000 ($13.57)Parks and Recreation: $190,000 ($4.15)Federal Intergovernmental - Other: $14,457,000 ($316.03)
Housing and Community Development: $2,317,000 ($50.65)Miscellaneous - Donations From Private Sources: $1,050,000 ($22.95)
General Revenue - Other: $317,000 ($6.93)Fines and Forfeits: $254,000 ($5.55)Interest Earnings: $85,000 ($1.86)Sale of Property: $13,000 ($0.28)State Intergovernmental - Other: $2,305,000 ($50.39)
General Local Government Support: $171,000 ($3.74)Tax - Occupation and Business License - Other: $13,504,000 ($295.20)
General Sales and Gross Receipts: $8,212,000 ($179.51)Property: $6,624,000 ($144.80)Public Utilities Sales: $2,260,000 ($49.40)Other License: $1,101,000 ($24.07)Other Selective Sales: $616,000 ($13.47)Alcoholic Beverage Sales: $599,000 ($13.09)Amusements Sales: $92,000 ($2.01)
Huntington government finances - Debt in 2021 (per resident):
Long Term Debt - Outstanding Unspecified Public Purpose: $28,384,000 ($620.47)
Beginning Outstanding - Unspecified Public Purpose: $27,247,000 ($595.61)Beginning Outstanding - Public Debt for Private Purpose: $8,401,000 ($183.64)Outstanding Nonguaranteed - Industrial Revenue: $7,351,000 ($160.69)Issue, Unspecified Public Purpose: $4,844,000 ($105.89)Retired Unspecified Public Purpose: $3,706,000 ($81.01)Retired Nonguaranteed - Public Debt for Private Purpose: $1,050,000 ($22.95)Short Term Debt Outstanding - Beginning: $642,000 ($14.03)
Huntington government finances - Cash and Securities in 2021 (per resident):
Other Funds - Cash and Securities: $55,952,000 ($1223.10)
Sinking Funds - Cash and Securities: $10,005,000 ($218.71)
Businesses in Huntington, WV
Name Count Name Count
7-Eleven 3 Long John Silver's 2 ALDI 1 Marriott 1 AT&T 2 MasterBrand Cabinets 8 Ace Hardware 1 McDonald's 6 Advance Auto Parts 3 New Balance 2 Applebee's 1 Nike 3 Arby's 3 Nissan 1 AutoZone 2 Papa John's Pizza 1 Baskin-Robbins 1 Payless 1 Burger King 3 Penske 1 CVS 4 Pizza Hut 2 Chevrolet 1 Quality 1 Chick-Fil-A 1 RadioShack 1 Chico's 1 Ramada 1 Cold Stone Creamery 1 Red Lobster 1 Dairy Queen 2 Red Roof Inn 1 Days Inn 1 Rite Aid 3 Domino's Pizza 1 Ryder Rental & Truck Leasing 1 FedEx 10 SAS Shoes 1 Firestone Complete Auto Care 1 Soma Intimates 1 Ford 1 Starbucks 2 GNC 1 Subaru 1 GameStop 1 Subway 5 Goodwill 1 Super 8 1 H&R Block 3 Taco Bell 4 Hardee's 1 U-Haul 3 Holiday Inn 1 UPS 14 Honda 1 Value City Furniture 1 Hyundai 1 Verizon Wireless 2 Jones New York 1 Volkswagen 1 KFC 2 Waffle House 1 Kmart 1 Walgreens 1 Kroger 2 Walmart 1 Lane Furniture 1 Wendy's 5 Little Caesars Pizza 3 YMCA 1
Strongest AM radio stations in Huntington:
WVHU (800 AM; 5 kW; HUNTINGTON, WV; Owner: CAPSTAR TX LIMITED PARTNERSHIP)
WRVC (930 AM; 5 kW; HUNTINGTON, WV; Owner: FIFTH AVENUE BROADCASTING COMPANY, INC.)
WHRD (1470 AM; 5 kW; HUNTINGTON, WV; Owner: CONCORD MEDIA GROUP, INC.)
WTCR (1420 AM; 5 kW; KENOVA, WV; Owner: CAPSTAR TX LIMITED PARTNERSHIP)
WOKT (1040 AM; daytime; 2 kW; CANNONSBURG, KY; Owner: BIG RIVER RADIO, INC.-KY)
WTVN (610 AM; 50 kW; COLUMBUS, OH; Owner: CITICASTERS LICENSES, L.P.)
WZZW (1600 AM; 5 kW; MILTON, WV; Owner: CAPSTAR TX LIMITED PARTNERSHIP)
WBGS (1030 AM; daytime; 10 kW; POINT PLEASANT, WV; Owner: BIG RIVER RADIO, INC.)
WCMI (1340 AM; 1 kW; ASHLAND, KY; Owner: FIFTH AVENUE BROADCASTING CO., INC)
WCHS (580 AM; 5 kW; CHARLESTON, WV; Owner: WEST VIRGINIA RADIO CORPORATION OF CHARLESTON)
WCAW (680 AM; 10 kW; CHARLESTON, WV; Owner: WEST VIRGINIA RADIO CORPORATION OF CHARLESTON)
WLGC (1520 AM; daytime; 5 kW; GREENUP, KY; Owner: GREENUP COUNTY BROADCASTING, INC.)
WLW (700 AM; 50 kW; CINCINNATI, OH; Owner: JACOR BROADCASTING CORPORATION)
Strongest FM radio stations in Huntington:
WTCR-FM (103.3 FM; HUNTINGTON, WV; Owner: CAPSTAR TX LIMITED PARTNERSHIP)
WKEE-FM (100.5 FM; HUNTINGTON, WV; Owner: CAPSTAR TX LIMITED PARTNERSHIP)
WMEJ (91.9 FM; PROCTORVILLE, OH; Owner: MARANATHA BROADCASTING INC.)
WMUL (88.1 FM; HUNTINGTON, WV; Owner: MARSHALL UNIVERSITY BOARD OF GOVERNORS)
WVWV (89.9 FM; HUNTINGTON, WV; Owner: WEST VIRGINIA EDUCATIONAL BROADCASTING AUTHORITY)
WAMX (106.3 FM; MILTON, WV; Owner: CAPSTAR TX LIMITED PARTNERSHIP)
WRVC-FM (92.7 FM; CATLETTSBURG, KY; Owner: FIFTH AVENUE BROADCASTING CO., INC)
WDGG (93.7 FM; ASHLAND, KY; Owner: FIFTH AVENUE B/CASTING COMPANY, INC.)
WBKS (107.1 FM; IRONTON, OH; Owner: CAPSTAR TX LIMITED PARTNERSHIP)
WEMM (107.9 FM; HUNTINGTON, WV; Owner: MORTENSON BROADCASTING CO. OF WEST VIRGINIA, LLC)
WKLC-FM (105.1 FM; ST. ALBANS, WV; Owner: WKLC, INC.)
WBVB (97.1 FM; COAL GROVE, OH; Owner: CAPSTAR TX LIMITED PARTNERSHIP)
WRYV-FM1 (101.5 FM; HUNTINGTON, WV; Owner: LEGEND COMMUNICATIONS OF OHIO, LLC)
WPAY-FM (104.1 FM; PORTSMOUTH, OH; Owner: RADIO STATIONS WPAY/WPFB, INC.)
WOUL-FM (89.1 FM; IRONTON, OH; Owner: OHIO UNIVERSITY)
WOSP (91.5 FM; PORTSMOUTH, OH; Owner: THE OHIO STATE UNIVERSITY)
WZAQ (92.3 FM; LOUISA, KY; Owner: LOUISA COMMUNICATIONS, INC.)
WLGC-FM (105.7 FM; GREENUP, KY; Owner: GREENUP COUNTY BROADCASTING, INC.)
WRYV (101.5 FM; GALLIPOLIS, OH; Owner: LEGEND COMMUNICATIONS OF OHIO, LLC)
W216AT (91.1 FM; ASHLAND, KY; Owner: AMERICAN FAMILY ASSOCIATION)
TV broadcast stations around Huntington:
W55AT (Channel 55; HUNTINGTON, WV; Owner: CHANNEL AMERICA LPTV LIC. SUBSIDIARY)
W14CU (Channel 14; HUNTINGTON, WV; Owner: VENTANA TELEVISION, INC.)
WTSF (Channel 61; ASHLAND, KY; Owner: TRI STATE FAMILY BROADCASTING, INC.)
WPBY-TV (Channel 33; HUNTINGTON, WV; Owner: WEST VIRGINIA EDUCATIONAL BROADCASTING AUTHORITY)
WSAZ-TV (Channel 3; HUNTINGTON, WV; Owner: EMMIS TELEVISION LICENSE CORPORATION)
WOWK-TV (Channel 13; HUNTINGTON, WV; Owner: WEST VIRGINIA MEDIA HOLDINGS, LLC)
WVAH-TV (Channel 11; CHARLESTON, WV; Owner: WVAH LICENSEE, LLC)
W05CB (Channel 5; BURLINGTON, OH; Owner: VEARL R. PENNINGTON)
WCHS-TV (Channel 8; CHARLESTON, WV; Owner: WCHS LICENSEE, LLC)
WKAS (Channel 25; ASHLAND, KY; Owner: KENTUCKY AUTHORITY FOR EDUCATIONAL TV)
W49BN (Channel 49; HUNTINGTON, WV; Owner: PAXSON COMMUNCATIONS LPTV, INC.)
W36CR (Channel 36; HUNTINGTON, WV; Owner: NATIONAL MINORITY T.V., INC.)
WLPX-TV (Channel 29; CHARLESTON, WV; Owner: PAXSON CHARLESTON LICENSE, INC.)
WPBO (Channel 42; PORTSMOUTH, OH; Owner: THE OHIO STATE UNIVERSITY)
National Bridge Inventory (NBI) Statistics 118 Number of bridges2,674ft / 815m Total length $59,595,000 Total costs1,120,132 Total average daily traffic208,777 Total average daily truck traffic
New bridges - historical statistics
1 Before 1900 2 1900-1909 2 1910-1919 7 1920-1929 1 1930-1939 4 1940-1949 27 1960-1969 7 1970-1979 12 1980-1989 17 1990-1999 18 2000-2009 18 2010-2019 2 2020-2022
See full National Bridge Inventory statistics for Huntington, WV
Home Mortgage Disclosure Act Aggregated Statistics For Year 2009(Based on 17 full and 8 partial tracts) A) FHA, FSA/RHS & VA B) Conventional C) Refinancings D) Home Improvement Loans E) Loans on Dwellings For 5+ Families F) Non-occupant Loans on G) Loans On Manufactured Number Average Value Number Average Value Number Average Value Number Average Value Number Average Value Number Average Value Number Average Value
LOANS ORIGINATED 141 $97,457 246 $98,728 475 $109,650 75 $52,629 25 $417,363 134 $73,617 3 $56,390 APPLICATIONS APPROVED, NOT ACCEPTED 9 $76,313 11 $128,708 29 $122,572 8 $46,380 1 $650,000 6 $65,340 2 $47,095 APPLICATIONS DENIED 24 $94,064 53 $103,650 222 $88,477 73 $39,023 0 $0 41 $49,758 7 $68,829 APPLICATIONS WITHDRAWN 19 $103,941 24 $73,776 110 $106,309 10 $82,395 1 $800,000 10 $81,396 0 $0 FILES CLOSED FOR INCOMPLETENESS 2 $91,555 4 $224,402 28 $112,311 5 $76,030 0 $0 4 $60,875 1 $20,140
Aggregated Statistics For Year 2008(Based on 17 full and 8 partial tracts) A) FHA, FSA/RHS & VA B) Conventional C) Refinancings D) Home Improvement Loans E) Loans on Dwellings For 5+ Families F) Non-occupant Loans on G) Loans On Manufactured Number Average Value Number Average Value Number Average Value Number Average Value Number Average Value Number Average Value Number Average Value
LOANS ORIGINATED 106 $93,298 357 $96,331 354 $99,069 100 $41,502 22 $365,616 197 $80,499 2 $59,735 APPLICATIONS APPROVED, NOT ACCEPTED 4 $102,095 25 $72,520 34 $113,489 16 $48,477 2 $247,000 6 $65,848 6 $63,842 APPLICATIONS DENIED 34 $87,342 73 $66,712 280 $78,561 93 $40,282 4 $167,500 43 $50,481 19 $53,558 APPLICATIONS WITHDRAWN 11 $76,388 38 $154,956 130 $85,791 12 $47,191 1 $639,750 14 $68,393 2 $137,105 FILES CLOSED FOR INCOMPLETENESS 2 $128,500 6 $74,303 12 $78,112 1 $27,600 0 $0 5 $78,400 0 $0
Aggregated Statistics For Year 2007(Based on 17 full and 8 partial tracts) A) FHA, FSA/RHS & VA B) Conventional C) Refinancings D) Home Improvement Loans E) Loans on Dwellings For 5+ Families F) Non-occupant Loans on G) Loans On Manufactured Number Average Value Number Average Value Number Average Value Number Average Value Number Average Value Number Average Value Number Average Value
LOANS ORIGINATED 46 $89,725 533 $92,132 425 $87,157 140 $47,577 26 $299,598 206 $63,156 6 $64,668 APPLICATIONS APPROVED, NOT ACCEPTED 2 $68,475 46 $78,937 63 $95,325 11 $27,733 1 $170,000 10 $53,038 10 $56,830 APPLICATIONS DENIED 11 $79,705 93 $72,976 348 $71,550 106 $37,228 2 $246,000 42 $62,644 18 $46,622 APPLICATIONS WITHDRAWN 4 $91,125 50 $76,087 138 $82,764 9 $40,662 0 $0 21 $70,479 0 $0 FILES CLOSED FOR INCOMPLETENESS 0 $0 19 $75,698 20 $68,762 3 $36,007 0 $0 7 $44,247 0 $0
Aggregated Statistics For Year 2006(Based on 17 full and 8 partial tracts) A) FHA, FSA/RHS & VA B) Conventional C) Refinancings D) Home Improvement Loans E) Loans on Dwellings For 5+ Families F) Non-occupant Loans on G) Loans On Manufactured Number Average Value Number Average Value Number Average Value Number Average Value Number Average Value Number Average Value Number Average Value
LOANS ORIGINATED 50 $90,622 570 $83,832 486 $80,670 147 $37,330 19 $268,737 240 $73,214 11 $33,331 APPLICATIONS APPROVED, NOT ACCEPTED 8 $67,581 61 $75,210 68 $69,979 18 $33,967 1 $140,000 12 $55,003 15 $60,438 APPLICATIONS DENIED 12 $63,783 137 $58,064 381 $70,873 116 $30,037 1 $7,000 61 $56,059 56 $48,941 APPLICATIONS WITHDRAWN 1 $87,380 45 $78,259 144 $86,847 14 $39,150 3 $164,667 22 $77,902 4 $87,108 FILES CLOSED FOR INCOMPLETENESS 1 $99,000 31 $78,713 31 $65,246 1 $21,580 0 $0 3 $43,353 0 $0
Aggregated Statistics For Year 2005(Based on 17 full and 8 partial tracts) A) FHA, FSA/RHS & VA B) Conventional C) Refinancings D) Home Improvement Loans E) Loans on Dwellings For 5+ Families F) Non-occupant Loans on G) Loans On Manufactured Number Average Value Number Average Value Number Average Value Number Average Value Number Average Value Number Average Value Number Average Value
LOANS ORIGINATED 30 $72,116 549 $86,670 497 $79,958 119 $37,613 26 $344,269 231 $62,590 8 $59,685 APPLICATIONS APPROVED, NOT ACCEPTED 5 $54,262 69 $62,058 135 $67,718 35 $33,414 1 $185,000 13 $78,086 24 $50,907 APPLICATIONS DENIED 24 $71,013 178 $57,554 452 $70,815 156 $24,946 1 $135,000 49 $63,362 104 $46,468 APPLICATIONS WITHDRAWN 3 $63,437 50 $91,510 147 $83,483 34 $39,304 1 $300,000 34 $67,144 0 $0 FILES CLOSED FOR INCOMPLETENESS 1 $64,000 16 $134,514 26 $78,648 3 $33,900 0 $0 2 $48,225 0 $0
Aggregated Statistics For Year 2004(Based on 17 full and 8 partial tracts) A) FHA, FSA/RHS & VA B) Conventional C) Refinancings D) Home Improvement Loans E) Loans on Dwellings For 5+ Families F) Non-occupant Loans on G) Loans On Manufactured Number Average Value Number Average Value Number Average Value Number Average Value Number Average Value Number Average Value Number Average Value
LOANS ORIGINATED 57 $82,599 578 $73,640 638 $80,341 137 $33,531 27 $265,984 228 $58,890 4 $40,180 APPLICATIONS APPROVED, NOT ACCEPTED 5 $57,786 70 $60,011 161 $62,102 35 $31,983 1 $150,000 15 $44,994 21 $41,941 APPLICATIONS DENIED 18 $65,486 173 $52,949 444 $65,718 145 $26,071 2 $147,500 62 $54,842 69 $48,057 APPLICATIONS WITHDRAWN 11 $75,216 59 $74,210 140 $84,917 14 $36,115 0 $0 23 $73,511 3 $73,960 FILES CLOSED FOR INCOMPLETENESS 1 $50,730 7 $70,914 34 $87,139 7 $51,711 0 $0 9 $76,328 0 $0
Aggregated Statistics For Year 2003(Based on 17 full and 8 partial tracts) A) FHA, FSA/RHS & VA B) Conventional C) Refinancings D) Home Improvement Loans E) Loans on Dwellings For 5+ Families F) Non-occupant Loans on Number Average Value Number Average Value Number Average Value Number Average Value Number Average Value Number Average Value
LOANS ORIGINATED 63 $73,392 537 $74,291 1,077 $86,616 102 $22,236 27 $1,120,153 268 $58,914 APPLICATIONS APPROVED, NOT ACCEPTED 3 $61,983 50 $55,799 182 $66,543 22 $20,385 0 $0 25 $34,347 APPLICATIONS DENIED 11 $59,026 165 $52,939 476 $61,840 92 $33,482 0 $0 86 $49,746 APPLICATIONS WITHDRAWN 5 $77,988 55 $86,376 183 $72,636 2 $28,430 0 $0 20 $60,641 FILES CLOSED FOR INCOMPLETENESS 2 $43,820 13 $61,085 45 $94,694 5 $38,618 0 $0 7 $43,294
Aggregated Statistics For Year 2002(Based on 17 full and 8 partial tracts) A) FHA, FSA/RHS & VA B) Conventional C) Refinancings D) Home Improvement Loans E) Loans on Dwellings For 5+ Families F) Non-occupant Loans on Number Average Value Number Average Value Number Average Value Number Average Value Number Average Value Number Average Value
LOANS ORIGINATED 73 $68,332 426 $75,985 833 $82,948 93 $18,871 12 $381,417 190 $51,497 APPLICATIONS APPROVED, NOT ACCEPTED 6 $49,758 67 $53,434 230 $64,109 28 $27,342 0 $0 13 $39,758 APPLICATIONS DENIED 14 $59,029 201 $47,237 572 $62,533 94 $12,685 1 $118,000 63 $47,147 APPLICATIONS WITHDRAWN 14 $58,616 47 $73,009 194 $67,178 11 $14,124 1 $43,000 14 $57,643 FILES CLOSED FOR INCOMPLETENESS 3 $66,077 6 $55,933 42 $77,926 1 $3,000 0 $0 6 $65,345
Aggregated Statistics For Year 2001(Based on 17 full and 8 partial tracts) A) FHA, FSA/RHS & VA B) Conventional C) Refinancings D) Home Improvement Loans E) Loans on Dwellings For 5+ Families F) Non-occupant Loans on Number Average Value Number Average Value Number Average Value Number Average Value Number Average Value Number Average Value
LOANS ORIGINATED 78 $70,675 398 $76,243 860 $74,091 132 $17,429 11 $304,455 185 $54,387 APPLICATIONS APPROVED, NOT ACCEPTED 15 $48,186 72 $57,638 212 $50,192 25 $12,640 0 $0 28 $40,155 APPLICATIONS DENIED 16 $54,012 218 $48,183 504 $54,155 107 $12,647 0 $0 52 $42,898 APPLICATIONS WITHDRAWN 38 $57,006 61 $67,555 268 $58,837 20 $17,641 2 $126,000 23 $58,875 FILES CLOSED FOR INCOMPLETENESS 3 $40,907 8 $62,768 67 $70,883 4 $36,680 0 $0 3 $89,793
Aggregated Statistics For Year 2000(Based on 17 full and 8 partial tracts) A) FHA, FSA/RHS & VA B) Conventional C) Refinancings D) Home Improvement Loans E) Loans on Dwellings For 5+ Families F) Non-occupant Loans on Number Average Value Number Average Value Number Average Value Number Average Value Number Average Value Number Average Value
LOANS ORIGINATED 58 $58,431 428 $70,875 452 $56,029 138 $13,799 9 $262,680 151 $45,913 APPLICATIONS APPROVED, NOT ACCEPTED 26 $49,487 62 $47,277 151 $49,985 27 $18,531 0 $0 10 $38,771 APPLICATIONS DENIED 41 $45,008 220 $40,880 468 $49,645 94 $14,506 0 $0 35 $42,400 APPLICATIONS WITHDRAWN 23 $55,819 57 $66,838 217 $46,615 16 $16,948 0 $0 6 $43,040 FILES CLOSED FOR INCOMPLETENESS 3 $41,720 7 $44,427 43 $53,583 0 $0 0 $0 2 $74,000
Aggregated Statistics For Year 1999(Based on 17 full and 8 partial tracts) A) FHA, FSA/RHS & VA B) Conventional C) Refinancings D) Home Improvement Loans E) Loans on Dwellings For 5+ Families F) Non-occupant Loans on Number Average Value Number Average Value Number Average Value Number Average Value Number Average Value Number Average Value
LOANS ORIGINATED 49 $63,656 353 $67,250 659 $60,236 166 $17,143 14 $392,089 131 $48,044 APPLICATIONS APPROVED, NOT ACCEPTED 3 $38,363 51 $44,530 193 $48,591 41 $8,837 0 $0 17 $33,735 APPLICATIONS DENIED 7 $47,391 218 $42,244 442 $44,048 92 $13,770 1 $139,000 37 $31,829 APPLICATIONS WITHDRAWN 7 $54,077 60 $64,126 255 $51,299 11 $18,512 1 $58,000 13 $35,698 FILES CLOSED FOR INCOMPLETENESS 5 $56,924 3 $78,343 56 $46,720 3 $11,857 0 $0 1 $24,000
Detailed mortgage data for all 24 tracts in Huntington, WV
Private Mortgage Insurance Companies Aggregated Statistics For Year 2009(Based on 10 full and 8 partial tracts) A) Conventional B) Refinancings C) Non-occupant Loans on Number Average Value Number Average Value Number Average Value
LOANS ORIGINATED 36 $136,016 9 $113,470 2 $98,000 APPLICATIONS APPROVED, NOT ACCEPTED 6 $139,925 7 $78,999 0 $0 APPLICATIONS DENIED 3 $240,293 3 $107,737 0 $0 APPLICATIONS WITHDRAWN 4 $90,688 3 $121,927 0 $0 FILES CLOSED FOR INCOMPLETENESS 3 $130,667 0 $0 0 $0
Aggregated Statistics For Year 2008(Based on 14 full and 8 partial tracts) A) Conventional B) Refinancings C) Non-occupant Loans on Number Average Value Number Average Value Number Average Value
LOANS ORIGINATED 104 $95,844 18 $105,689 17 $77,767 APPLICATIONS APPROVED, NOT ACCEPTED 36 $93,363 9 $115,961 6 $62,645 APPLICATIONS DENIED 8 $73,092 2 $65,000 3 $70,033 APPLICATIONS WITHDRAWN 3 $80,707 0 $0 1 $68,000 FILES CLOSED FOR INCOMPLETENESS 4 $78,808 0 $0 0 $0
Aggregated Statistics For Year 2007(Based on 17 full and 8 partial tracts) A) Conventional B) Refinancings C) Non-occupant Loans on Number Average Value Number Average Value Number Average Value
LOANS ORIGINATED 203 $83,581 30 $101,996 23 $61,037 APPLICATIONS APPROVED, NOT ACCEPTED 34 $80,801 7 $91,866 6 $60,687 APPLICATIONS DENIED 4 $89,020 8 $282,569 1 $353,000 APPLICATIONS WITHDRAWN 7 $99,941 1 $85,000 1 $190,000 FILES CLOSED FOR INCOMPLETENESS 1 $132,000 0 $0 0 $0
Aggregated Statistics For Year 2006(Based on 17 full and 8 partial tracts) A) Conventional B) Refinancings C) Non-occupant Loans on Number Average Value Number Average Value Number Average Value
LOANS ORIGINATED 164 $74,891 23 $81,835 23 $58,717 APPLICATIONS APPROVED, NOT ACCEPTED 29 $79,409 5 $112,592 6 $57,552 APPLICATIONS DENIED 5 $80,000 0 $0 5 $80,000 APPLICATIONS WITHDRAWN 9 $62,349 1 $134,830 1 $79,000 FILES CLOSED FOR INCOMPLETENESS 3 $63,000 0 $0 2 $50,000
Aggregated Statistics For Year 2005(Based on 15 full and 8 partial tracts) A) Conventional B) Refinancings C) Non-occupant Loans on Number Average Value Number Average Value Number Average Value
LOANS ORIGINATED 167 $71,817 34 $97,373 28 $61,804 APPLICATIONS APPROVED, NOT ACCEPTED 25 $72,240 8 $87,766 6 $47,667 APPLICATIONS DENIED 2 $53,000 0 $0 2 $53,000 APPLICATIONS WITHDRAWN 7 $112,160 5 $101,892 2 $38,615 FILES CLOSED FOR INCOMPLETENESS 2 $51,865 0 $0 1 $46,000
Aggregated Statistics For Year 2004(Based on 16 full and 8 partial tracts) A) Conventional B) Refinancings C) Non-occupant Loans on Number Average Value Number Average Value Number Average Value
LOANS ORIGINATED 154 $70,748 46 $88,029 26 $53,250 APPLICATIONS APPROVED, NOT ACCEPTED 26 $65,662 16 $84,126 3 $38,053 APPLICATIONS DENIED 2 $66,545 1 $125,780 2 $66,500 APPLICATIONS WITHDRAWN 4 $46,405 1 $80,000 1 $45,000 FILES CLOSED FOR INCOMPLETENESS 0 $0 0 $0 0 $0
Aggregated Statistics For Year 2003(Based on 17 full and 8 partial tracts) A) Conventional B) Refinancings C) Non-occupant Loans on Number Average Value Number Average Value Number Average Value
LOANS ORIGINATED 153 $69,837 82 $88,051 22 $54,370 APPLICATIONS APPROVED, NOT ACCEPTED 17 $67,979 20 $95,002 3 $64,000 APPLICATIONS DENIED 1 $71,000 0 $0 0 $0 APPLICATIONS WITHDRAWN 5 $59,444 2 $91,000 0 $0 FILES CLOSED FOR INCOMPLETENESS 0 $0 0 $0 0 $0
Aggregated Statistics For Year 2002(Based on 15 full and 8 partial tracts) A) Conventional B) Refinancings C) Non-occupant Loans on Number Average Value Number Average Value Number Average Value
LOANS ORIGINATED 146 $78,927 74 $85,622 21 $49,847 APPLICATIONS APPROVED, NOT ACCEPTED 24 $75,760 30 $97,000 2 $77,910 APPLICATIONS DENIED 6 $62,833 1 $63,000 2 $59,500 APPLICATIONS WITHDRAWN 5 $42,428 7 $110,959 3 $37,047 FILES CLOSED FOR INCOMPLETENESS 0 $0 0 $0 0 $0
Aggregated Statistics For Year 2001(Based on 16 full and 8 partial tracts) A) Conventional B) Refinancings C) Non-occupant Loans on Number Average Value Number Average Value Number Average Value
LOANS ORIGINATED 138 $75,295 55 $88,507 18 $51,691 APPLICATIONS APPROVED, NOT ACCEPTED 23 $73,547 11 $74,783 4 $38,500 APPLICATIONS DENIED 3 $68,277 4 $72,962 2 $61,760 APPLICATIONS WITHDRAWN 2 $48,755 5 $66,000 0 $0 FILES CLOSED FOR INCOMPLETENESS 0 $0 0 $0 0 $0
Aggregated Statistics For Year 2000(Based on 14 full and 8 partial tracts) A) Conventional B) Refinancings C) Non-occupant Loans on Number Average Value Number Average Value Number Average Value
LOANS ORIGINATED 83 $74,208 19 $63,088 11 $56,818 APPLICATIONS APPROVED, NOT ACCEPTED 15 $63,459 4 $87,788 5 $73,600 APPLICATIONS DENIED 1 $60,140 0 $0 0 $0 APPLICATIONS WITHDRAWN 4 $69,688 1 $40,470 1 $68,000 FILES CLOSED FOR INCOMPLETENESS 0 $0 0 $0 0 $0
Aggregated Statistics For Year 1999(Based on 15 full and 8 partial tracts) A) Conventional B) Refinancings C) Non-occupant Loans on Number Average Value Number Average Value Number Average Value
LOANS ORIGINATED 118 $74,564 32 $70,218 9 $46,440 APPLICATIONS APPROVED, NOT ACCEPTED 3 $38,290 6 $150,712 0 $0 APPLICATIONS DENIED 9 $69,571 3 $47,790 1 $43,000 APPLICATIONS WITHDRAWN 4 $71,528 1 $124,560 1 $32,000 FILES CLOSED FOR INCOMPLETENESS 0 $0 0 $0 0 $0
Fire-safe hotels and motels in Huntington, West Virginia:
Hidden Trails, 5601 Peyton CT, Huntington, West Virginia 25705 Phone: (304) 736-1415
Huntington Days Inn, 5196 Us Rt 60 E, Huntington, West Virginia 25705 Phone: (304) 733-4477, Fax: (304) 733-4493
Pullman Plaza Hotel, 1001 3rd Ave, Huntington, West Virginia 25701 Phone: (304) 525-1001, Fax: (304) 525-1048
Quality Inn, 3325 Us Rt 60 E, Huntington, West Virginia 25705 Phone: (304) 525-7001, Fax: (304) 525-7225
Towneplace Suites By Marriott Huntington, 157 Kinetic Dr, Huntington, West Virginia 25701 Phone: (304) 525-4877, Fax: (304) 525-0039
Hamptpon Inn Huntington (university Area), 177 Kinetic Dr, Huntington, West Virginia 25701 Phone: (304) 523-8001, Fax: (304) 522-0120
All 6 fire-safe hotels and motels in Huntington, West Virginia
Most common first names in Huntington, WV among deceased individuals Name Count Lived (average)
Mary 797 78.1 years James 761 70.8 years William 745 73.5 years John 681 74.3 years Charles 627 73.2 years Robert 485 70.7 years George 362 74.1 years Helen 279 77.2 years Virginia 256 78.4 years Ruth 244 79.8 years
Most common last names in Huntington, WV among deceased individuals Last name Count Lived (average)
Adkins 606 74.7 years Smith 492 75.0 years Johnson 312 74.3 years Davis 236 76.0 years Miller 202 75.9 years Jones 177 75.4 years Chapman 169 73.4 years Moore 160 76.3 years Thompson 153 75.9 years Williams 151 76.4 years
Huntington compared to West Virginia state average:
Median age below state average. Renting percentage above state average. Length of stay since moving in above state average. House age above state average. Number of college students above state average. Percentage of population with a bachelor's degree or higher above state average. Huntington on our top lists :
#19 on the list of "Top 101 cities with the largest racial income disparity between any two races with at least 200 householders"
#52 on the list of "Top 101 cities with the highest number of burglaries per 100,000 residents, excludes tourist destinations and others with a lot of outsiders visiting based on city industries data (population 5,000+)"
#9 (25703) on the list of "Top 101 zip codes with the smallest percentage of taxpayers using charity contributions deductions in 2012 (pop 1,000+)"
#18 (25703) on the list of "Top 101 zip codes with the lowest charity contributions deductions as a percentage of AGI in 2012 (pop 5,000+)"
#24 (25703) on the list of "Top 101 zip codes with the lowest average reported salary/wage in 2012 (pop 5,000+)"
#28 (25703) on the list of "Top 101 zip codes with the lowest 2012 average Adjusted Gross Income (AGI) for individuals (pop 5,000+)"
#43 (25703) on the list of "Top 101 zip codes with the smallest percentage of taxpayers reporting profit/loss from business in 2012 (pop 5,000+)"
#25 on the list of "Top 101 counties with the highest Sulfur Oxides Annual air pollution readings in 2012 (µg/m3 )"
#28 on the list of "Top 101 counties with the smallest number of children under 18 without health insurance coverage in 2000 (pop. 50,000+)"
#49 on the list of "Top 101 counties with the highest number of deaths per 1000 residents 2007-2013 (pop. 50,000+)"
#101 on the list of "Top 101 counties with the highest Particulate Matter (PM2.5 ) Annual air pollution readings in 2012 (µg/m3 )"
Top Patent Applicants
Christopher Scott Smith (5)
H. Darrel Darby, Ii (4)
Hongwei D. Yu (3)
Richard M. Niles (3)
Richard D. Begley (3)
Gaylord D. Smith (3)
Debajyoti Maitra (3)
Pier Paolo Claudio (3)
Jackie L. Hearld (2)
Alexander H. Slocum, Jr. (2)
Total of 74 patent applications in 2008-2024.


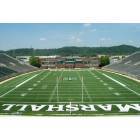


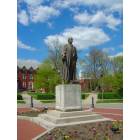
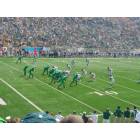
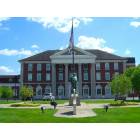
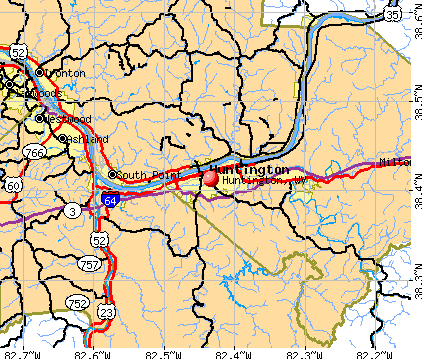


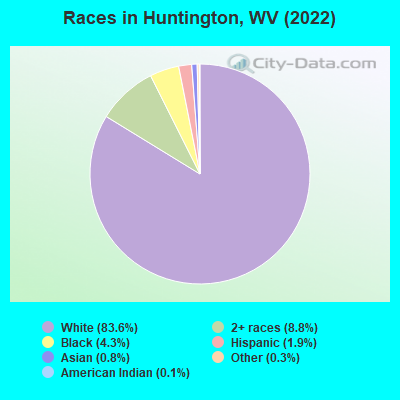
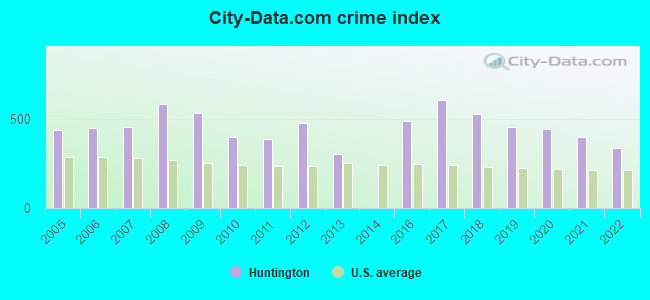
 Recent articles from our blog. Our writers, many of them Ph.D. graduates or candidates, create easy-to-read articles on a wide variety of topics.

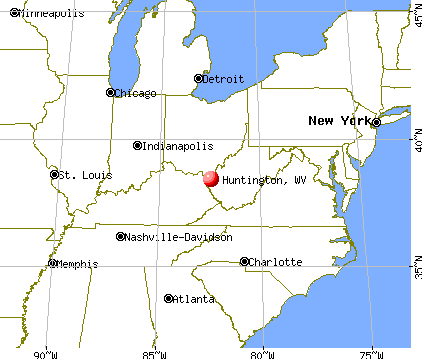
 (113.1 miles
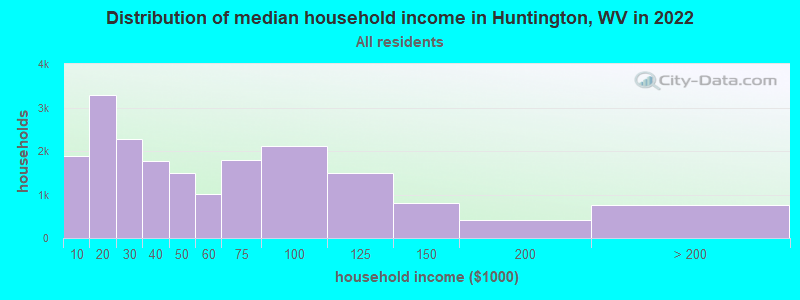
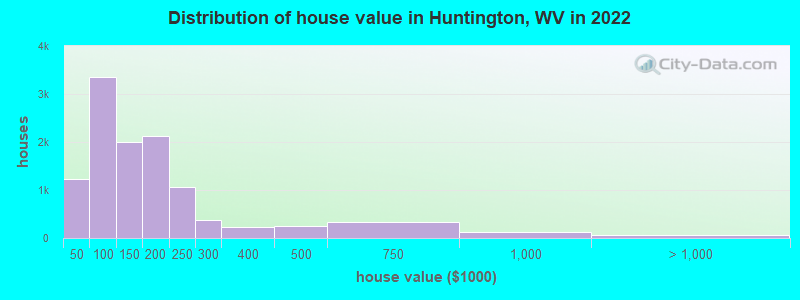
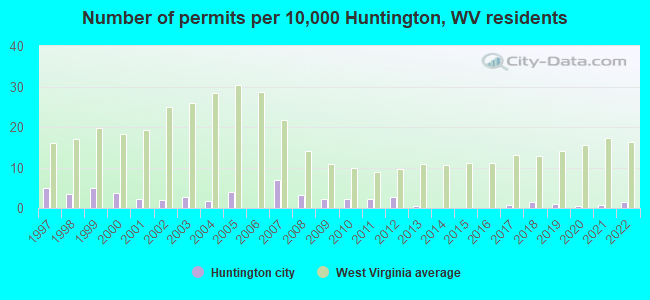
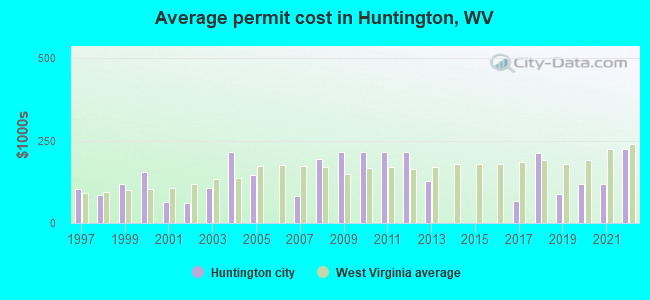
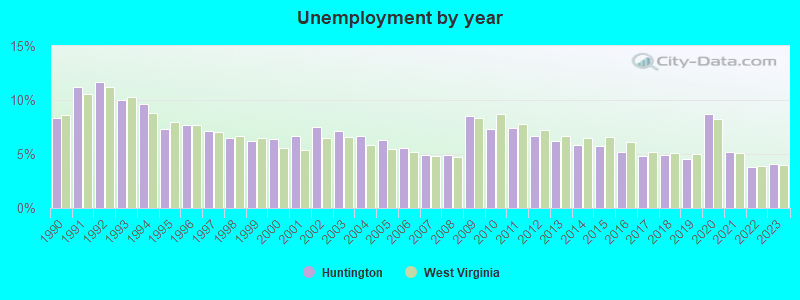
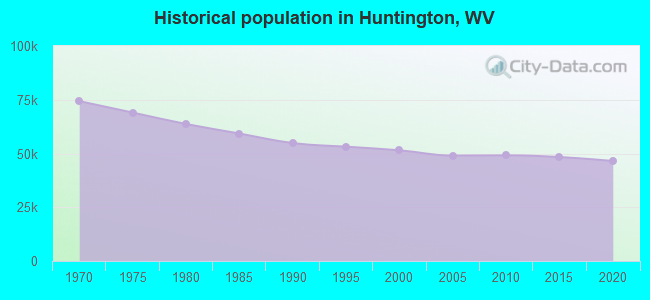
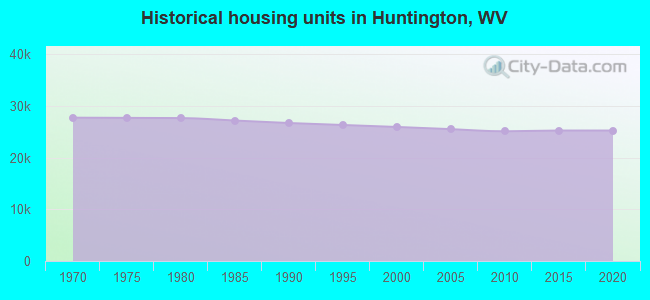
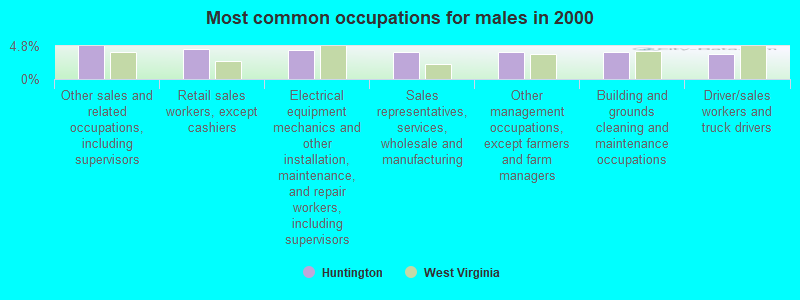
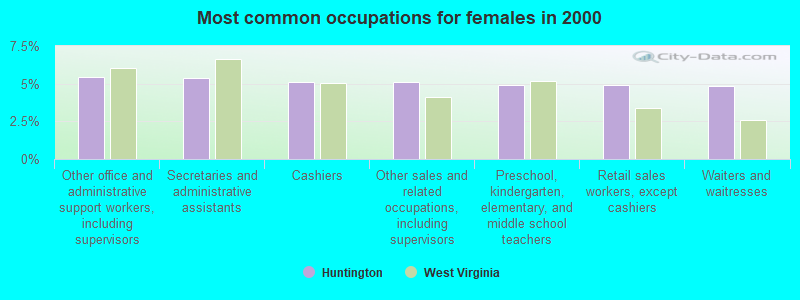
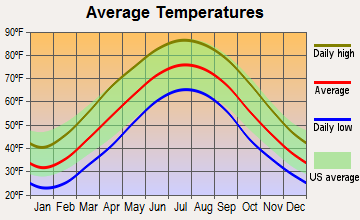
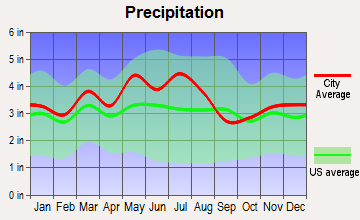
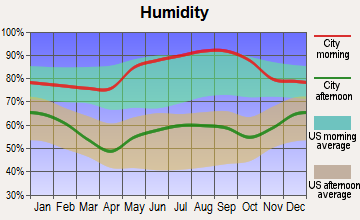
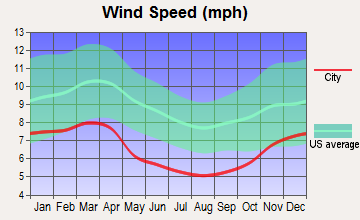
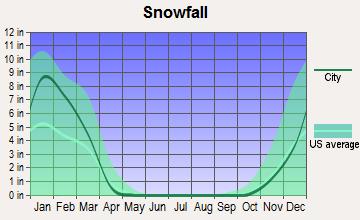
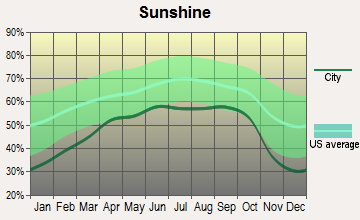
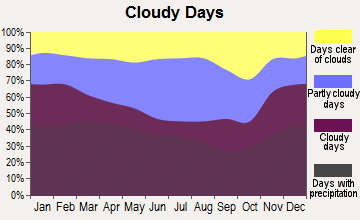


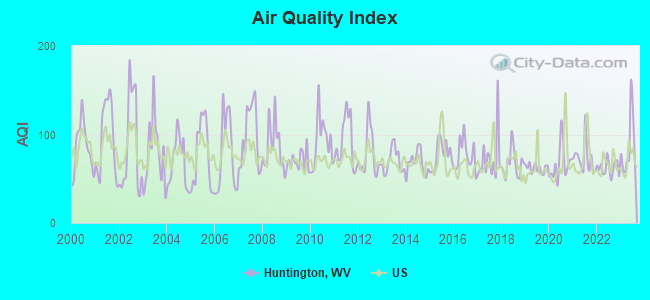
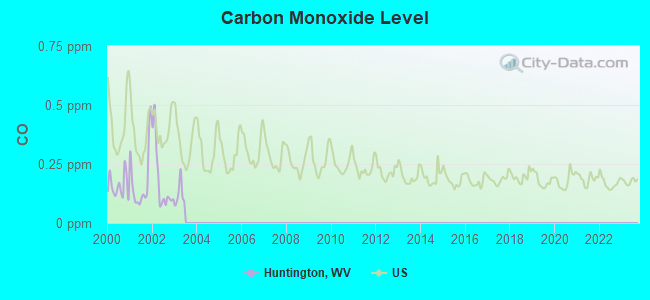
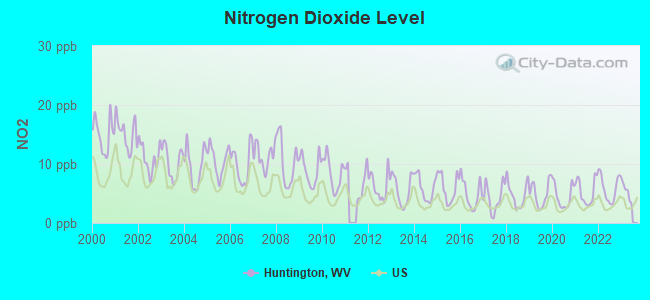
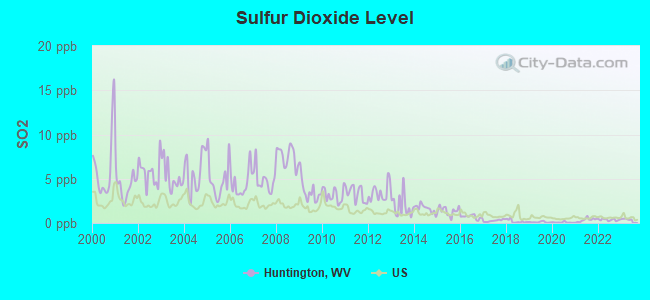
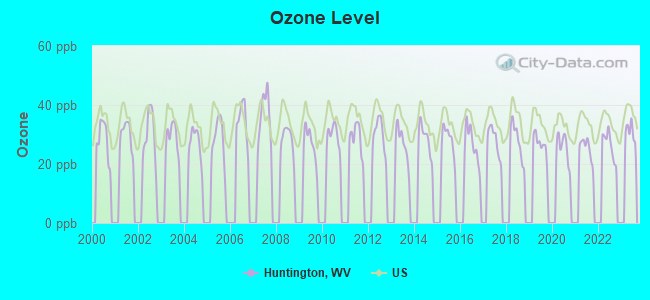
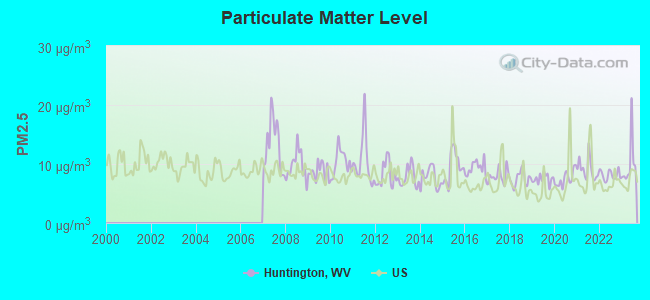

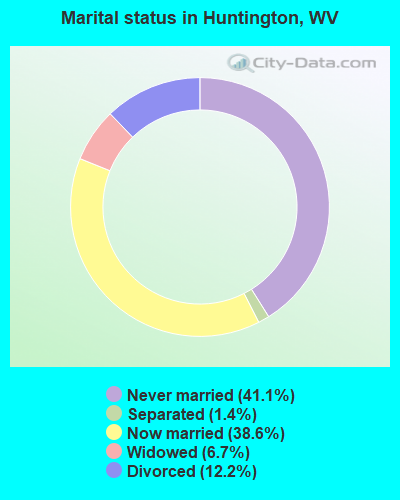
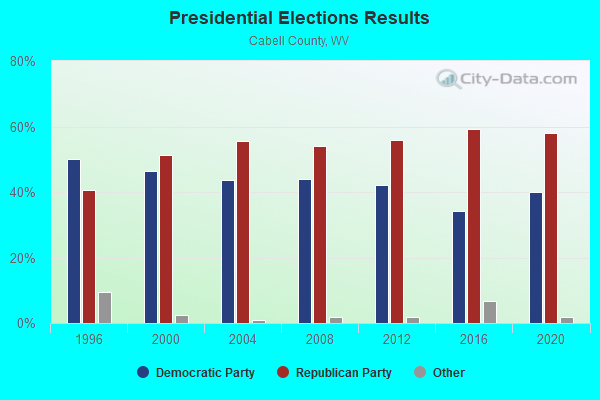
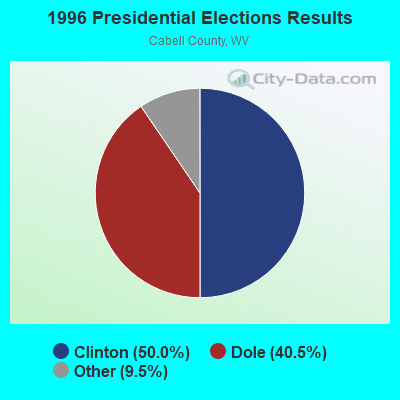
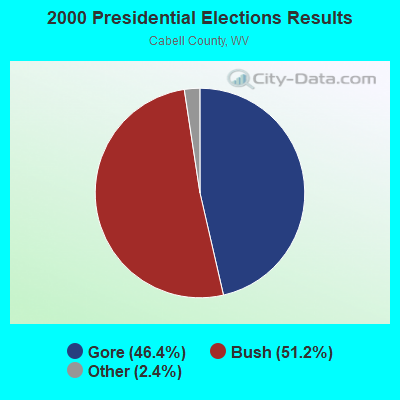
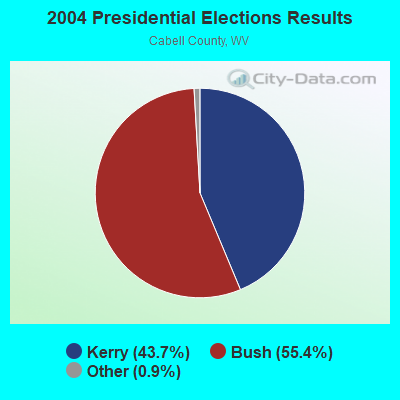
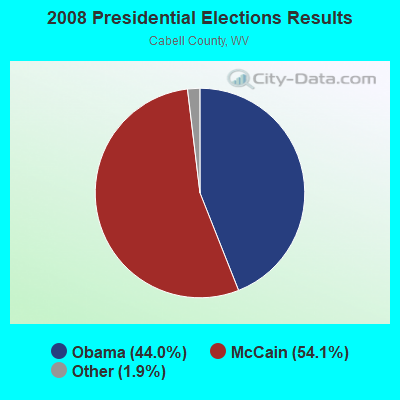
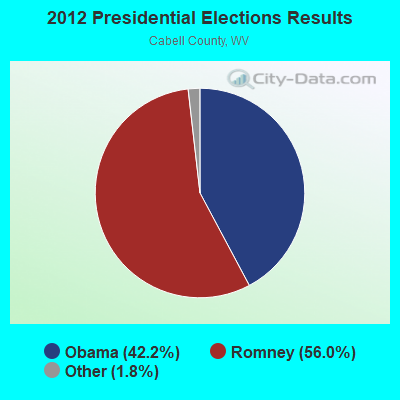
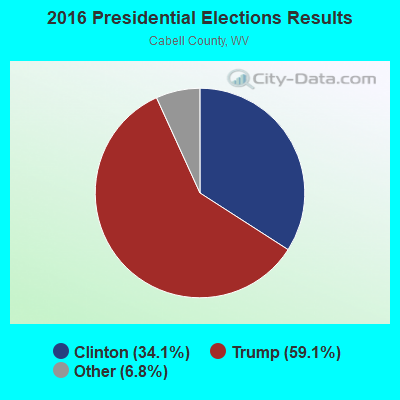
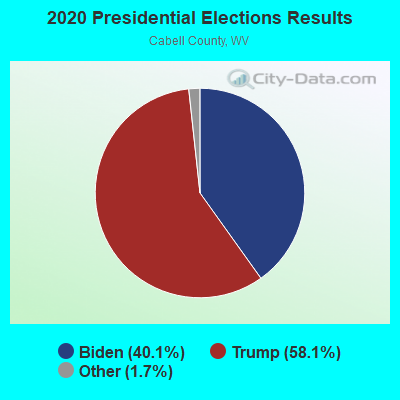
 According to the data from the years 2004 - 2018 the average number of fires per year is 442. The highest number of reported fires - 601 took place in 2007, and the least - 88 in 2004. The data has an increasing trend.
 When looking into fire subcategories, the most reports belonged to: Structure Fires (41.9%), and Outside Fires (39.5%).