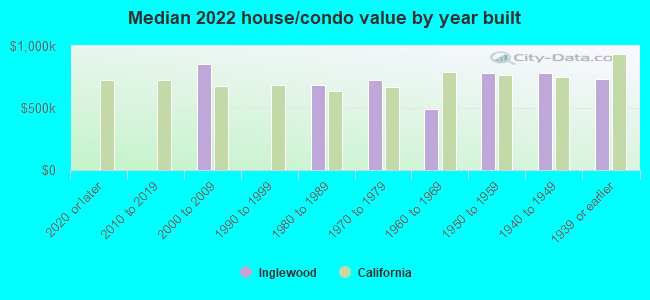
Inglewood, CA (California) Houses and Residents
| Inglewood: | $738,200 |
| California: | $715,900 |
Mean price in 2022:
Detached houses: $676,652
Here: $676,652 State: $988,808 Townhouses or other attached units: $488,028
Here: $488,028 State: $838,546 In 2-unit structures: $630,076
Here: $630,076 State: $1,138,100 In 3-to-4-unit structures: $836,244
Here: $836,244 State: $824,253 In 5-or-more-unit structures: $410,273
Here: $410,273 State: $730,996
Total population: 111,905 (All urban)
Houses: 38,279 (36,901 occupied: 12,487 owner occupied, 24,414 renter occupied)
| % of renters here: | 66% |
| State: | 44% |
Housing density: 4,190 houses/condos per square mile
Median price asked for vacant for-sale houses and condos in 2022: $549,383.
Median contract rent in 2022: $1,583 (lower quartile is $1,228, upper quartile is $1,890)
Median rent asked for vacant for-rent units in 2022: $2,650
Median gross rent in Inglewood, CA in 2022: $1,694
Housing units in Inglewood with a mortgage: 8,686 (926 second mortgage, 58 home equity loan, 773 both second mortgage and home equity loan)
Houses without a mortgage: 27
Median household income for houses/condos with a mortgage: $122,121
Median household income for apartments without a mortgage: $61,348
Median monthly housing costs: $1,693
Compare current foreclosures in Inglewood, CA:
| Photo | Address | Area | Beds / Baths | Price | Details |
|---|---|---|---|---|---|

|
#1
W 110th St
Inglewood, CA 90303
|
3,481 sq. feet
|
4 baths 6 beds |
show details | |

|
#2
W 107th St
Inglewood, CA 90304
|
873 sq. feet
|
1 baths 2 beds |
show details | |

|
#3
W 104th St
Inglewood, CA 90304
|
787 sq. feet
|
1 baths 2 beds |
show details | |

|
#4
S 5th Ave
Inglewood, CA 90303
|
2,010 sq. feet
|
3 baths 4 beds |
show details | |

|
#5
S 5th Ave
Inglewood, CA 90305
|
1,574 sq. feet
|
2 baths 4 beds |
show details | |

|
#6
W 76th St
Inglewood, CA 90305
|
1,668 sq. feet
|
2 baths 3 beds |
show details | |

|
#7
W 83rd St
Inglewood, CA 90305
|
1,374 sq. feet
|
2 baths 3 beds |
show details | |

|
#8
W 82nd St
Inglewood, CA 90305
|
1,803 sq. feet
|
2 baths 3 beds |
show details | |

|
#9
W Hardy St
Inglewood, CA 90301
|
1,470 sq. feet
|
2 baths 4 beds |
show details | |

|
#10
Lennox Blvd Apt 1
Inglewood, CA 90304
|
1,221 sq. feet
|
2 baths 3 beds |
show details |
| Photo | Address | Area | Beds / Baths | Price | Details |
|---|---|---|---|---|---|

|
#11
Penridge Pl
Inglewood, CA 90305
|
1,437 sq. feet
|
3 baths 3 beds |
show details | |

|
#12
W Spruce Ave
Inglewood, CA 90301
|
2,004 sq. feet
|
3 baths 4 beds |
show details | |

|
#13
S La Cienega Blvd Apt 29
Inglewood, CA 90302
|
1,084 sq. feet
|
2 baths 2 beds |
show details | |

|
#14
Stepney St
Inglewood, CA 90302
|
1,184 sq. feet
|
2 baths 3 beds |
show details | |

|
#15
W 97th St
Inglewood, CA 90301
|
1,349 sq. feet
|
2 baths 3 beds |
show details | |

|
#16
Larch St Apt 8
Inglewood, CA 90301
|
635 sq. feet
|
1 baths 2 beds |
show details | |

|
#17
W 74th Pl
Inglewood, CA 90305
|
1,556 sq. feet
|
2 baths 3 beds |
show details | |

|
#18
W Medici Ln
Inglewood, CA 90305
|
1,846 sq. feet
|
3 baths 3 beds |
show details | |

|
#19
S Fir Ave
Inglewood, CA 90301
|
1,400 sq. feet
|
2 baths 3 beds |
show details | |

|
#20
W 82nd Pl
Inglewood, CA 90305
|
1,004 sq. feet
|
1 baths 2 beds |
show details |
| Photo | Address | Area | Beds / Baths | Price | Details |
|---|---|---|---|---|---|

|
#21
Kincaid Ave
Inglewood, CA 90302
|
1,911 sq. feet
|
2 baths 3 beds |
show details | |

|
#22
S Oak St
Inglewood, CA 90301
|
778 sq. feet
|
1 baths 2 beds |
show details | |

|
#23
S 8th Ave
Inglewood, CA 90305
|
1,654 sq. feet
|
2 baths 3 beds |
show details | |

|
#24
S Oak St
Inglewood, CA 90301
|
963 sq. feet
|
2 baths 3 beds |
show details | |

|
#25
W 107th St
Inglewood, CA 90304
|
990 sq. feet
|
2 baths 3 beds |
show details | |

|
#26
W 64th Pl
Inglewood, CA 90302
|
1,361 sq. feet
|
2 baths 3 beds |
show details | |

|
#27
Enterprise Ave Apt 4
Inglewood, CA 90302
|
1,157 sq. feet
|
3 baths 2 beds |
show details | |

|
#28
S 8th Ave
Inglewood, CA 90305
|
1,156 sq. feet
|
1 baths 2 beds |
show details | |

|
#29
E 66th St
Inglewood, CA 90302
|
1,392 sq. feet
|
2 baths 4 beds |
show details | |

|
#30
S 5th Ave
Inglewood, CA 90305
|
1,546 sq. feet
|
2 baths 3 beds |
show details |
| Photo | Address | Area | Beds / Baths | Price | Details |
|---|---|---|---|---|---|

|
#31
Evergreen St Unit 309
Inglewood, CA 90302
|
1,040 sq. feet
|
2 baths 2 beds |
show details | |

|
#32
W 64th St
Inglewood, CA 90302
|
1,736 sq. feet
|
3 baths 6 beds |
show details | |

|
#33
S 5th Ave
Inglewood, CA 90305
|
1,546 sq. feet
|
2 baths 3 beds |
show details | |

|
#34
W 79th St
Inglewood, CA 90305
|
1,780 sq. feet
|
2 baths 3 beds |
show details | |

|
#35
E Fairview Blvd # 3
Inglewood, CA 90302
|
1,057 sq. feet
|
2 baths 5 beds |
show details | |

|
#36
1/2 W 108th St
Inglewood, CA 90303
|
1,602 sq. feet
|
2 baths 4 beds |
show details | |

|
#37
S Burl Ave
Inglewood, CA 90304
|
880 sq. feet
|
1 baths 1 beds |
show details | |

|
#38
Firmona Ave
Inglewood, CA 90304
|
950 sq. feet
|
2 baths 5 beds |
show details | |

|
#39
S Ash Ave
Inglewood, CA 90301
|
1,008 sq. feet
|
1 baths 2 beds |
show details | |

|
#40
Mansel Ave
Inglewood, CA 90304
|
2,359 sq. feet
|
3 baths 5 beds |
show details |
| Photo | Address | Area | Beds / Baths | Price | Details |
|---|---|---|---|---|---|

|
#41
Rosewood Ave
Inglewood, CA 90301
|
2,336 sq. feet
|
3 baths 3 beds |
show details | |

|
#42
Crenshaw Blvd
Inglewood, CA 90305
|
4,038 sq. feet
|
4 baths 8 beds |
show details | |

|
#43
S 1st Ave
Inglewood, CA 90303
|
1,610 sq. feet
|
2 baths 3 beds |
show details | |

|
#44
S 4th Ave
Inglewood, CA 90303
|
1,631 sq. feet
|
2 baths 4 beds |
show details | |

|
#45
S 5th Ave
Inglewood, CA 90305
|
1,574 sq. feet
|
2 baths 4 beds |
show details | |

|
#46
Doty Ave
Inglewood, CA 90303
|
960 sq. feet
|
1 baths 3 beds |
show details | |

|
#47
Doty Ave
Inglewood, CA 90303
|
680 sq. feet
|
1 baths 1 beds |
show details | |

|
#48
E Tamarack Ave
Inglewood, CA 90301
|
1,107 sq. feet
|
2 baths 3 beds |
show details | |

|
#49
N Flower St
Inglewood, CA 90301
|
1,343 sq. feet
|
2 baths 3 beds |
show details | |

|
Check over 1 million property listings on Foreclosure.com!
|
browse all offers | |||

Latest news about housing in Inglewood, CA collected exclusively by city-data.com from local newspapers, TV, and radio stations


Median year apartment built: 1965
Household type by relationship:
Households: 103,628- Male householders: 18,474 (4,423 living alone), Female householders: 18,427 (6,655 living alone)
13,316 spouses (12,969 opposite-sex spouses), 2,100 unmarried partners, (1,845 opposite-sex unmarried partners), 32,307 children (31,183 natural, 349 adopted, 775 stepchildren), 3,312 grandchildren, 2,709 brothers or sisters, 4,671 parents, 268 foster children, 3,449 other relatives, 3,505 non-relatives
- In group quarters: 1,090
Size of family households: 7,065 2-persons, 7,254 3-persons, 4,657 4-persons, 2,131 5-persons, 1,851 6-persons, 936 7-or-more-persons.
Size of nonfamily households: 11,078 1-person, 1,591 2-persons, 202 3-persons, 51 4-persons, 85 7-or-more-persons.
9,995 married couples with children.
6,525 single-parent households (2,410 men, 4,115 women).
50.7% of residents of Inglewood speak English at home.
43.7% of residents speak Spanish at home (53% speak English very well, 22% speak English well, 19% speak English not well, 6% don't speak English at all).
2.2% of residents speak other Indo-European language at home (66% speak English very well, 28% speak English well, 5% speak English not well, 1% don't speak English at all).
1.4% of residents speak Asian or Pacific Island language at home (68% speak English very well, 21% speak English well, 10% speak English not well, 1% don't speak English at all).
2.2% of residents speak other language at home (67% speak English very well, 23% speak English well, 8% speak English not well, 2% don't speak English at all).
Foreign born population: 32,958 (31.8%)
(50.9% of them are naturalized citizens)
| Here: | 5.8 |
| State: | 6.0 |
| Here: | 3.9 |
| State: | 3.9 |
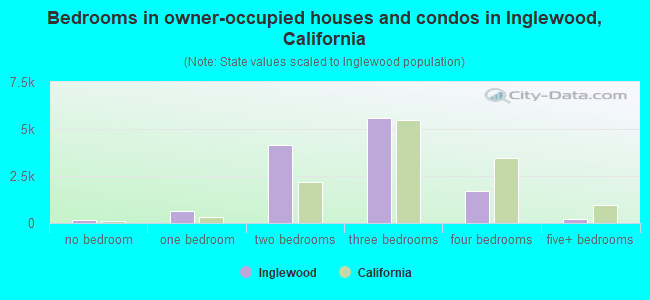
- Bedrooms in owner-occupied houses and condos in Inglewood, California
- 148no bedroom
- 6601 bedroom
- 4,1552 bedrooms
- 5,5873 bedrooms
- 1,7204 bedrooms
- 2175+ bedrooms
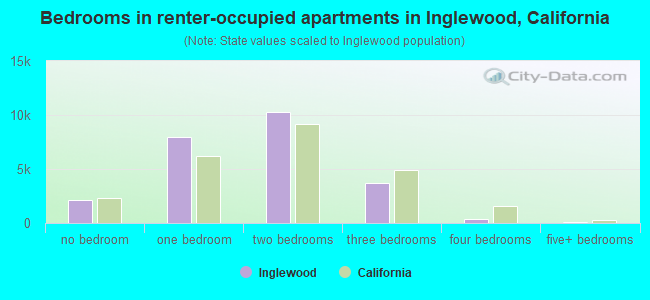
- Bedrooms in renter-occupied apartments in Inglewood, California
- 2,115no bedroom
- 7,9781 bedroom
- 10,2402 bedrooms
- 3,6743 bedrooms
- 3344 bedrooms
- 735+ bedrooms
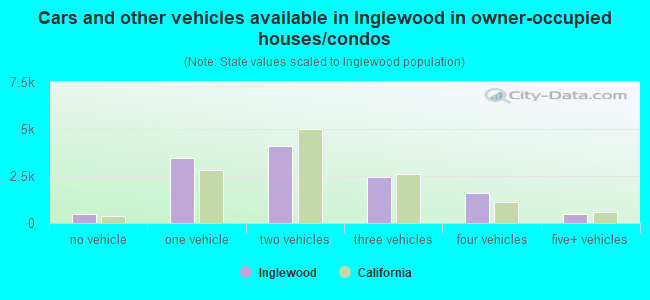
- Cars and other vehicles available in Inglewood in owner-occupied houses/condos
- 467no vehicle
- 3,4351 vehicle
- 4,0702 vehicles
- 2,4653 vehicles
- 1,5764 vehicles
- 4745+ vehicles
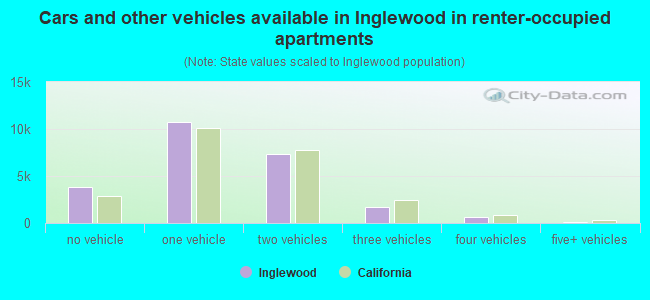
- Cars and other vehicles available in Inglewood in renter-occupied apartments
- 3,828no vehicle
- 10,7651 vehicle
- 7,3542 vehicles
- 1,6583 vehicles
- 6834 vehicles
- 1265+ vehicles
- Rooms in owner-occupied houses in Inglewood, California
- 1481 room
- 1882 rooms
- 9953 rooms
- 1,7384 rooms
- 2,5775 rooms
- 2,0306 rooms
- 2,4067 rooms
- 1,6038 rooms
- 8029+ rooms
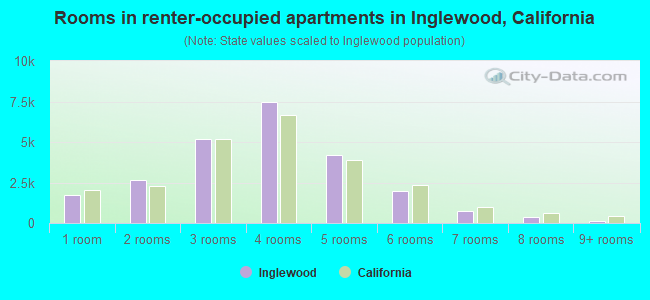
- Rooms in renter-occupied apartments in Inglewood, California
- 1,7211 room
- 2,6512 rooms
- 5,2053 rooms
- 7,4504 rooms
- 4,2255 rooms
- 1,9516 rooms
- 7147 rooms
- 3738 rooms
- 1249+ rooms
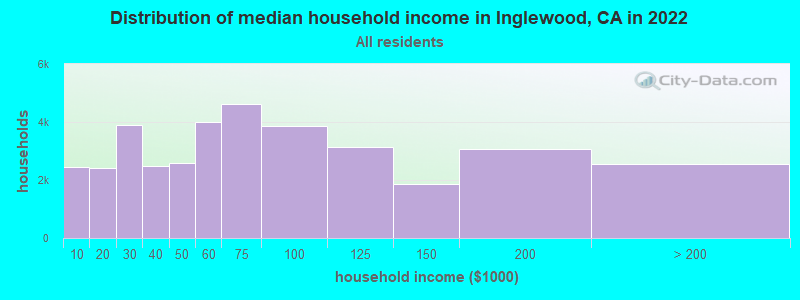
Inglewood, CA household income distribution

- 2,452Less than $10,000
- 2,404$10,000 to $19,999
- 3,884$20,000 to $29,999
- 2,480$30,000 to $39,999
- 2,595$40,000 to $49,999
- 3,987$50,000 to $59,999
- 4,614$60,000 to $74,999
- 3,853$75,000 to $99,999
- 3,141$100,000 to $124,999
- 1,873$125,000 to $149,999
- 3,080$150,000 to $199,999
- 2,538$200,000 or more
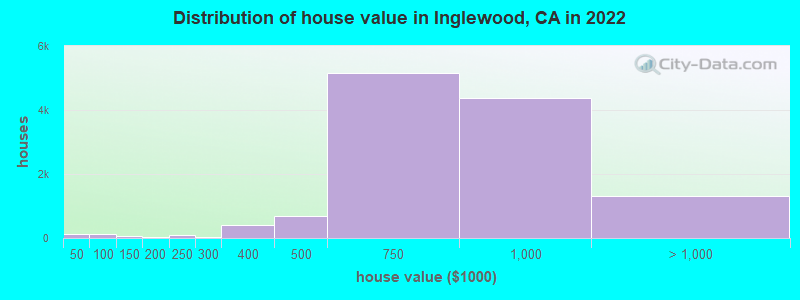
Home value of owner - occupied houses in 2022 in Inglewood, CA
-
- 84Less than $10,000
- 7$10,000 to $14,999
- 11$30,000 to $34,999
- 15$35,000 to $39,999
- 22$50,000 to $59,999
- 39$60,000 to $69,999
- 29$70,000 to $79,999
- 19$80,000 to $89,999
- 46$100,000 to $124,999
- 20$175,000 to $199,999
- 80$200,000 to $249,999
- 38$250,000 to $299,999
- 408$300,000 to $399,999
- 685$400,000 to $499,999
- 5,152$500,000 to $749,999
- 4,361$750,000 to $999,999
- 1,030$1,000,000 to $1,499,999
- 77$1,500,000 to $1,999,999
- 200$2,000,000 or more
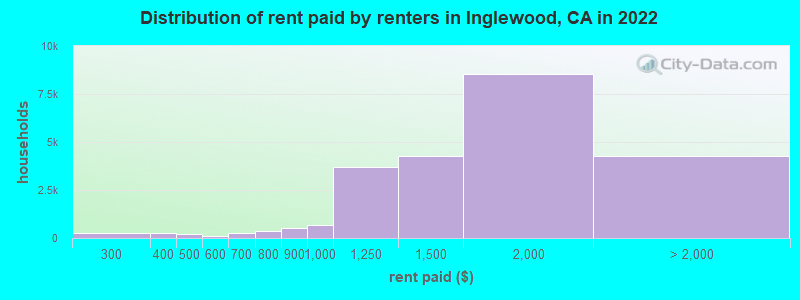
Rent paid by renters in 2022 in Inglewood, CA
-
- 34Less than $100
- 8$100 to $149
- 88$200 to $249
- 179$250 to $299
- 229$300 to $349
- 14$350 to $399
- 133$400 to $449
- 80$450 to $499
- 41$500 to $549
- 86$550 to $599
- 52$600 to $649
- 194$650 to $699
- 195$700 to $749
- 183$750 to $799
- 514$800 to $899
- 697$900 to $999
- 3,689$1,000 to $1,249
- 4,258$1,250 to $1,499
- 8,561$1,500 to $1,999
- 2,632$2,000 to $2,499
- 811$2,500 to $2,999
- 196$3,000 to $3,499
- 121$3,500 or more
- 531No cash rent
Percentage of workers working in this county: 96.0%
Number of people working at home: 4,894 (9.7% of all workers)
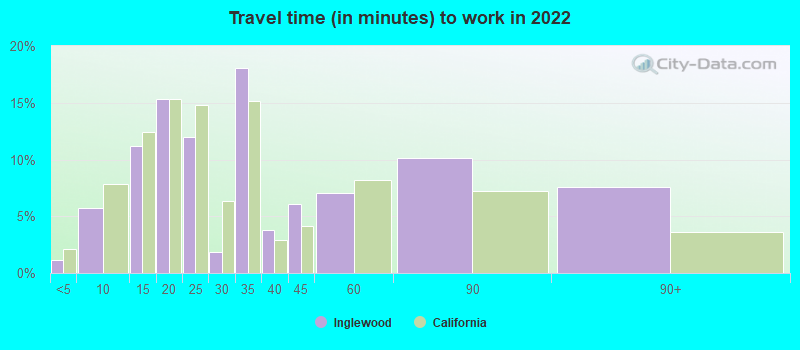
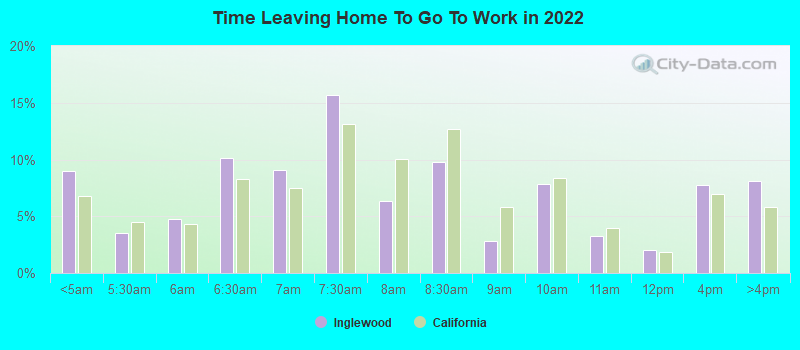
Travel time to work (commute)
- Less than 5 minutes: 606
- 5 to 9 minutes: 2,288
- 10 to 14 minutes: 6,283
- 15 to 19 minutes: 6,936
- 20 to 24 minutes: 5,627
- 25 to 29 minutes: 2,912
- 30 to 34 minutes: 7,311
- 35 to 39 minutes: 702
- 40 to 44 minutes: 2,419
- 45 to 59 minutes: 6,149
- 60 to 89 minutes: 3,669
- 90 or more minutes: 831
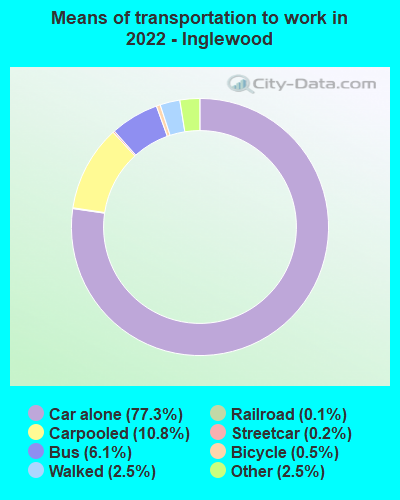
Means of transportation to work:
- Drove a car alone: 20,917 (63.1%)
- Carpooled: 3,219 (9.7%)
- Bus: 1,501 (4.5%)
- Subway or elevated rail: 47 (0.1%)
- Long-distance train or commuter rail: 9 (0.0%)
- Light rail, streetcar or trolley: 18 (0.1%)
- Taxi: 725 (2.2%)
- Bicycle: 140 (0.4%)
- Walked: 738 (2.2%)
- Worked at home: 5,934 (17.9%)
- Unemployment by race in 2022
- Unemployment rate for White non-Hispanic residents
- 8.7%Males
- 8.0%Females
- Unemployment rate for Black residents
- 13.0%Males
- 7.7%Females
- Unemployment rate for American Indian and Alaska Native residents
- 1.4%Males
- 13.9%Females
- Unemployment rate for Asian residents
- 4.0%Males
- 4.5%Females
- Unemployment rate for other race residents
- 6.3%Males
- 6.6%Females
- Unemployment rate for two or more race residents
- 1.8%Males
- 2.2%Females
- Unemployment rate for Hispanic or Latino residents
- 6.3%Males
- 5.5%Females
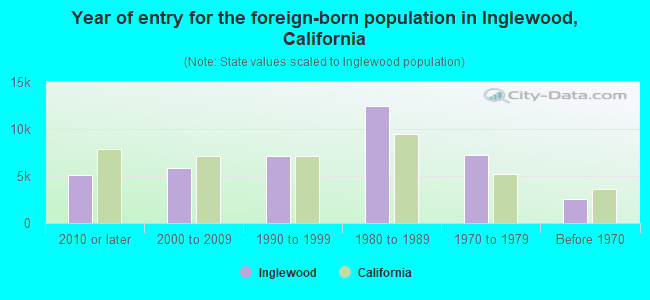
- Year of entry for the foreign-born population in Inglewood, California
- 5,0752010 or later
- 5,8992000 to 2009
- 7,1061990 to 1999
- 12,4881980 to 1989
- 7,2551970 to 1979
- 2,584Before 1970
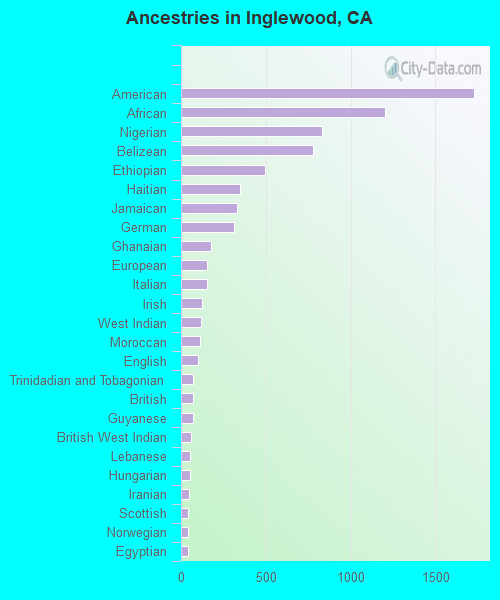
First ancestries reported:
- American: 1,730 (2.4%)
- African: 1,201 (1.7%)
- Nigerian: 833 (1.2%)
- Belizean: 779 (1.1%)
- Ethiopian: 497 (0.7%)
- Haitian: 347 (0.5%)
- Jamaican: 330 (0.5%)
- German: 314 (0.4%)
- Ghanaian: 175 (0.2%)
- European: 156 (0.2%)
- Italian: 152 (0.2%)
- Irish: 125 (0.2%)
- West Indian: 116 (0.2%)
- Moroccan: 110 (0.2%)
- English: 102 (0.1%)
- Trinidadian and Tobagonian: 70 (0.10%)
- British: 69 (0.10%)
- Guyanese: 68 (0.10%)
- British West Indian: 60 (0.08%)
- Lebanese: 56 (0.08%)
- Hungarian: 55 (0.08%)
- Iranian: 48 (0.07%)
- Scottish: 42 (0.06%)
- Norwegian: 40 (0.06%)
- Egyptian: 39 (0.06%)
- French: 38 (0.05%)
- Canadian: 37 (0.05%)
- Brazilian: 35 (0.05%)
- Russian: 29 (0.04%)
- Kenyan: 28 (0.04%)
- Eastern European: 23 (0.03%)
- Polish: 23 (0.03%)
- Croatian: 22 (0.03%)
- Basque: 21 (0.03%)
- Czechoslovakian: 21 (0.03%)
- Swedish: 19 (0.03%)
- Armenian: 19 (0.03%)
- Ugandan: 16 (0.02%)
- Portuguese: 12 (0.02%)
- Turkish: 8 (0.01%)
- Ukrainian: 8 (0.01%)
- Scotch-Irish: 6 (0.01%)
- Czech: 5 (0.01%)
- Israeli: 5 (0.01%)
- Alsatian: 4 (0.01%)
Most common places of birth for foreign-born residents (%):
| Inglewood: | 51.0% (15,491) |
| California: | 37.2% (3,881,193) |
| Inglewood: | 10.3% (3,121) |
| California: | 4.2% (440,287) |
| Inglewood: | 10.1% (3,081) |
| California: | 2.8% (290,436) |
| Inglewood: | 4.1% (1,234) |
| California: | 0.3% (35,557) |
| Inglewood: | 2.9% (886) |
| California: | 0.2% (15,693) |
| Inglewood: | 2.3% (695) |
| California: | 0.1% (5,330) |
| Inglewood: | 1.6% (485) |
| California: | 0.2% (24,635) |
Place of birth for U.S.-born residents:
- This state: 55,720
- Other state: 13,348
- Northeast: 1,371
- Midwest: 3,397
- South: 6,384
- West: 2,196
91.9% of Inglewood residents lived in the same house 1 years ago.
Out of people who lived in different houses, 44.5% lived in this county.
Out of people who lived in different counties, 56.1% lived in California.
| Inglewood: | 91.9% |
| State average: | 88.9% |
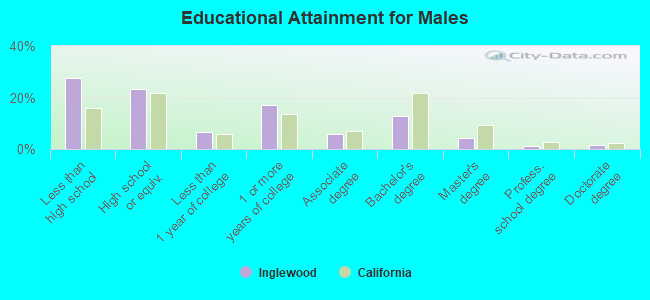
Education attainment for males 25 years and older:
- No schooling: 1,845
- Nursery to 4th grade: 1,900
- 5th and 6th grade: 1,466
- 7th and 8th grade: 167
- 9th grade: 1,026
- 10th grade: 712
- 11th grade: 902
- 12th grade, no diploma: 2,012
- High school graduate (or equivalency): 8,356
- Less than 1 year of college: 2,404
- Some college more than 1 year, no degree: 6,116
- Associate degree: 2,092
- Bachelor's degree: 4,694
- Master's degree: 1,479
- Professional school degree: 455
- Doctorate degree: 511
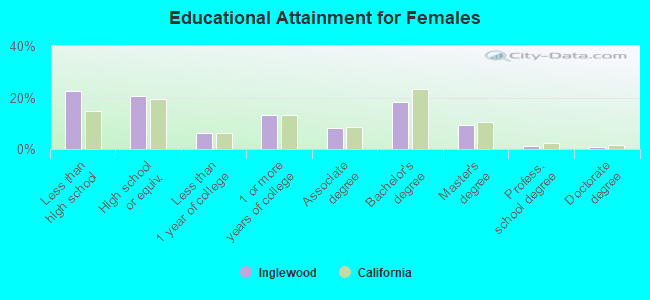
Education attainment for females 25 years and older:
- No schooling: 1,325
- Nursery to 4th grade: 1,056
- 5th and 6th grade: 2,514
- 7th and 8th grade: 511
- 9th grade: 1,065
- 10th grade: 144
- 11th grade: 751
- 12th grade, no diploma: 1,220
- High school graduate (or equivalency): 7,830
- Less than 1 year of college: 2,350
- Some college more than 1 year, no degree: 5,052
- Associate degree: 3,103
- Bachelor's degree: 6,934
- Master's degree: 3,541
- Professional school degree: 385
- Doctorate degree: 262
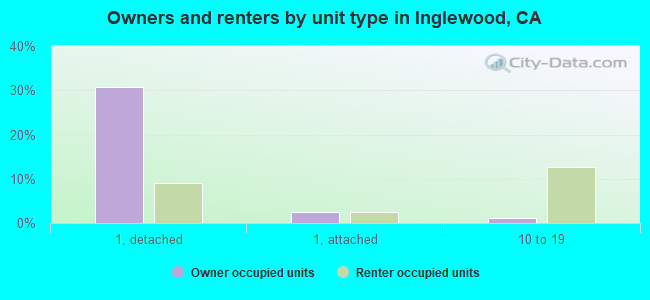
Housing units in structures:
- One, detached: 13,446
- One, attached: 3,241
- Two: 1,370
- 3 or 4: 3,409
- 5 to 9: 7,151
- 10 to 19: 5,504
- 20 to 49: 2,496
- 50 or more: 1,486
- Mobile homes: 176
Housing units lacking complete kitchen facilities in 2022: 2.9%
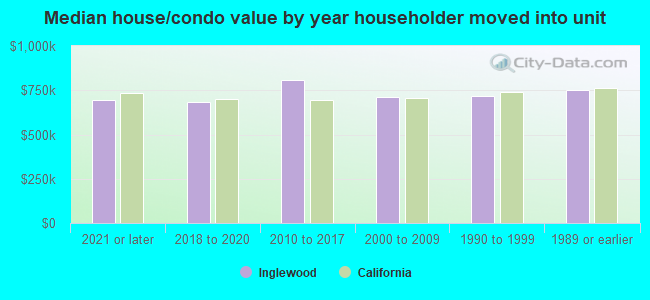
House/condo owner moved in on average 21 years ago
Renter moved in on average 6 years ago
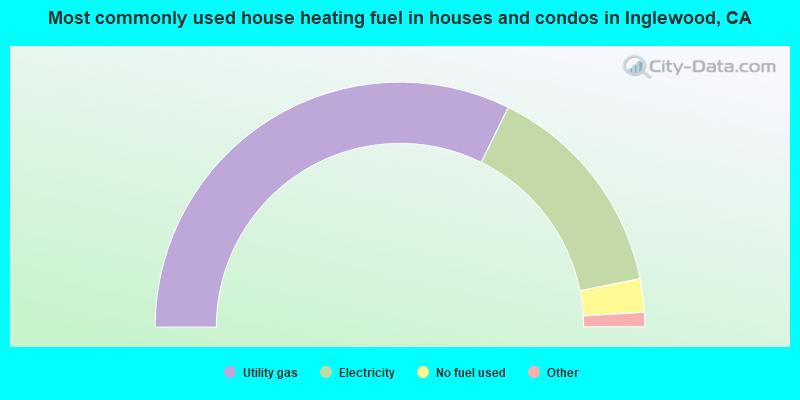
- 64.6%Utility gas
- 29.1%Electricity
- 4.4%No fuel used
- 0.9%Bottled, tank, or LP gas
- 0.6%Solar energy
- 0.3%Fuel oil, kerosene, etc.
- 0.1%Coal or coke
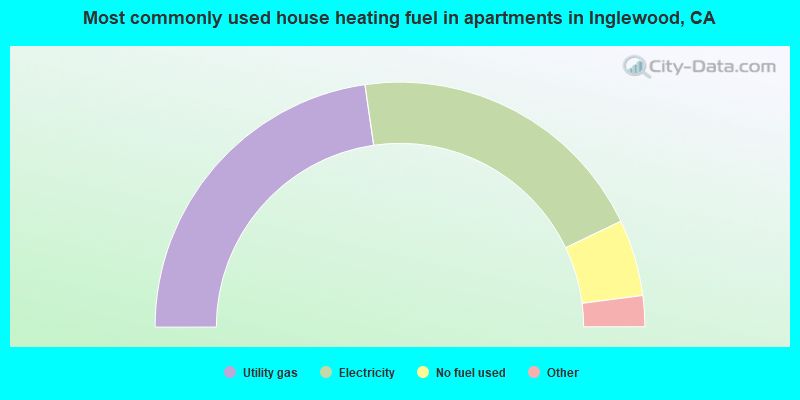
- 45.5%Utility gas
- 40.4%Electricity
- 10.1%No fuel used
- 2.5%Bottled, tank, or LP gas
- 1.0%Other fuel
- 0.3%Fuel oil, kerosene, etc.
- 0.2%Solar energy
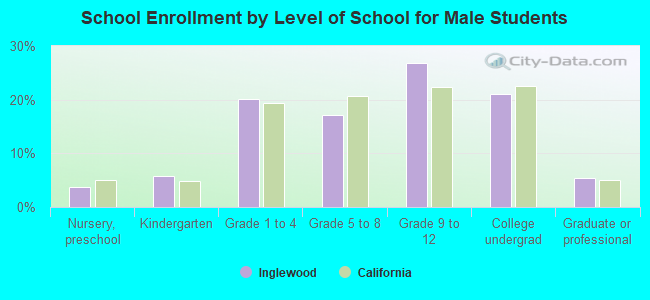
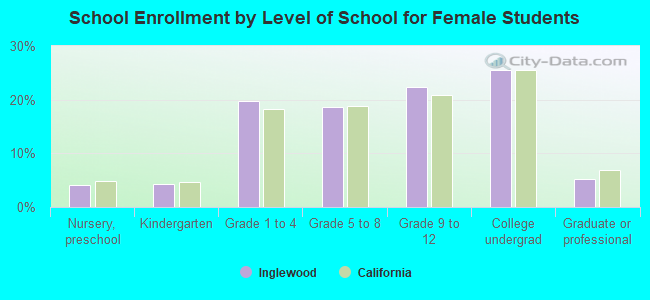
Private vs. public school enrollment:
| Here: | 7.0% |
| California: | 10.5% |
| Here: | 10.0% |
| California: | 8.5% |
| Here: | 15.8% |
| California: | 15.9% |