Housing density: 2,572 houses/condos per square mile
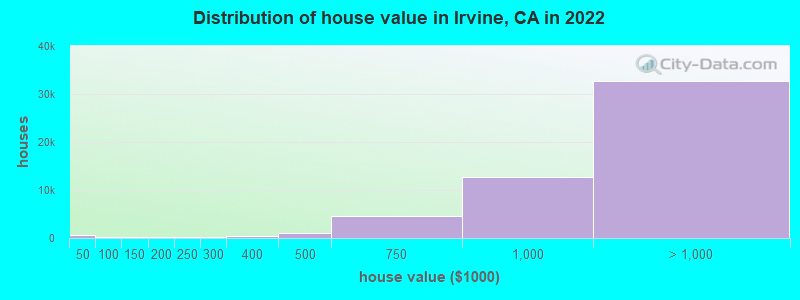
Median price asked for vacant for-sale houses and condos in 2022: $257,854.
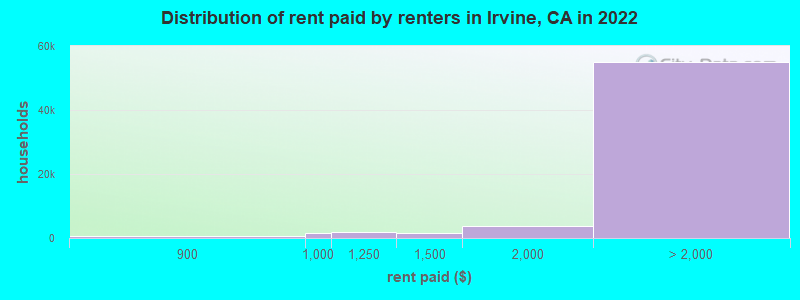
Median contract rent in 2022: over $2,000 (lower quartile is over $2,000, upper quartile is over $2,000)
Median rent asked for vacant for-rent units in 2022: $2,917
Median gross rent in Irvine, CA in 2022: over $2,000
Housing units in Irvine with a mortgage: 31,416 (3,154 second mortgage, 147 home equity loan, 2,334 both second mortgage and home equity loan) Houses without a mortgage: 376
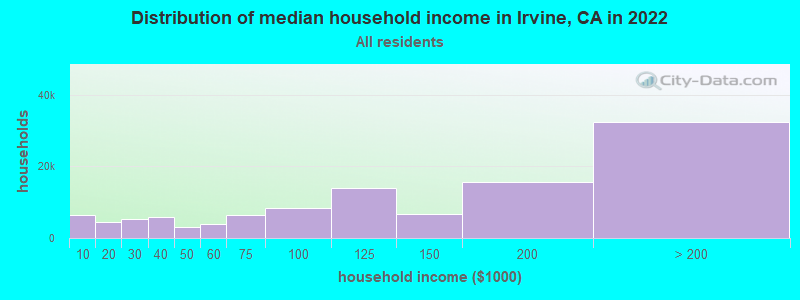
Median household income for houses/condos with a mortgage: $196,357
Median household income for apartments without a mortgage: $122,384
56,336 married couples with children.
13,992 single-parent households (2,300 men, 11,692 women).
47.0% of residents of Irvine speak English at home.
7.8% of residents speak Spanish at home (83% speak English very well, 12% speak English well, 4% speak English not well, 1% don't speak English at all).
12.4% of residents speak other Indo-European language at home (76% speak English very well, 16% speak English well, 6% speak English not well, 2% don't speak English at all).
29.2% of residents speak Asian or Pacific Island language at home (62% speak English very well, 23% speak English well, 12% speak English not well, 3% don't speak English at all).
3.7% of residents speak other language at home (66% speak English very well, 21% speak English well, 12% speak English not well, 1% don't speak English at all).
Foreign born population: 124,134 (39.6%)
(52.7% of them are naturalized citizens)
Percentage of workers working in this county: 91.7% Number of people working at home: 44,608 (28.6% of all workers)
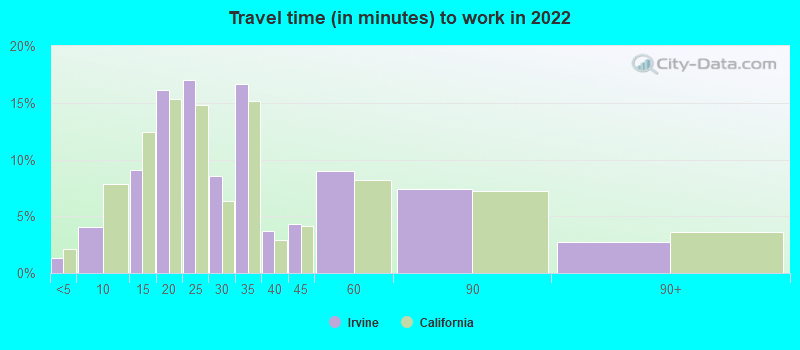
Travel time to work (commute)
Less than 5 minutes: 2,120
5 to 9 minutes: 7,192
10 to 14 minutes: 15,674
15 to 19 minutes: 25,150
20 to 24 minutes: 19,042
25 to 29 minutes: 8,084
30 to 34 minutes: 15,666
35 to 39 minutes: 1,359
40 to 44 minutes: 3,143
45 to 59 minutes: 5,399
60 to 89 minutes: 6,671
90 or more minutes: 1,825
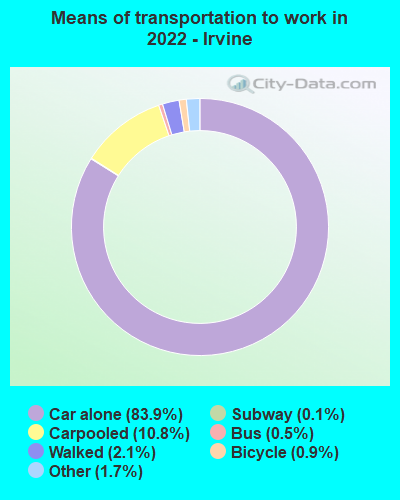
Means of transportation to work:
Drove a car alone: 183,321 (69.7%)
Carpooled: 23,709 (9.0%)
Bus: 1,080 (0.4%)
Subway or elevated rail: 45 (0.0%)
Long-distance train or commuter rail: 240 (0.1%)
Taxi: 3,652 (1.4%)
Bicycle: 1,986 (0.8%)
Walked: 4,535 (1.7%)
Worked at home: 44,608 (16.9%)
Unemployment by race in 2022
Unemployment rate for White non-Hispanic residents
2.8%Males
6.3%Females
Unemployment rate for Black residents
6.7%Males
7.0%Females
Unemployment rate for American Indian and Alaska Native residents
3.0%Males
3.2%Females
Unemployment rate for Asian residents
4.4%Males
3.1%Females
Unemployment rate for other race residents
1.6%Males
6.7%Females
Unemployment rate for two or more race residents
9.0%Males
9.7%Females
Unemployment rate for Hispanic or Latino residents
7.2%Males
8.6%Females
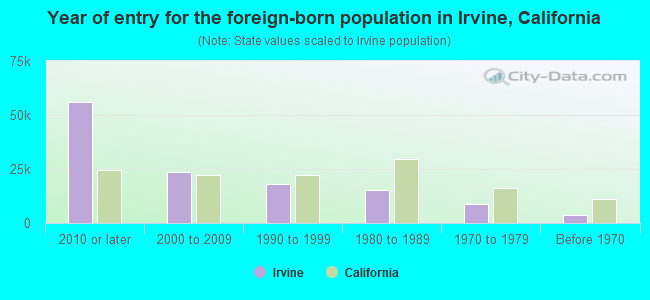
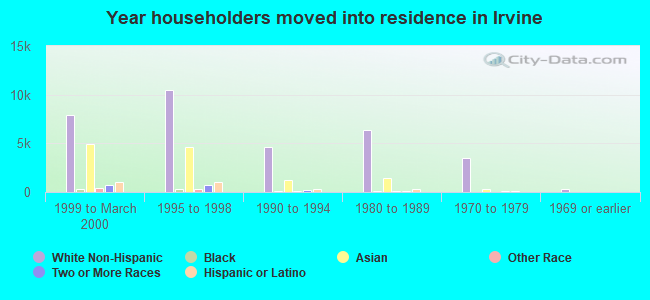
Year of entry for the foreign-born population in Irvine, California
56,2322010 or later
23,7602000 to 2009
18,1041990 to 1999
15,4911980 to 1989
8,9721970 to 1979
3,630Before 1970
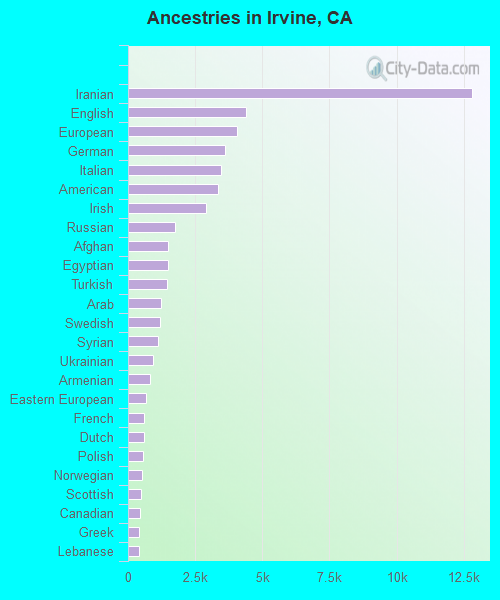
First ancestries reported:
Iranian: 12,803 (6.5%)
English: 4,392 (2.2%)
European: 4,044 (2.1%)
German: 3,623 (1.9%)
Italian: 3,461 (1.8%)
American: 3,352 (1.7%)
Irish: 2,915 (1.5%)
Russian: 1,732 (0.9%)
Afghan: 1,490 (0.8%)
Egyptian: 1,483 (0.8%)
Turkish: 1,466 (0.7%)
Arab: 1,245 (0.6%)
Swedish: 1,196 (0.6%)
Syrian: 1,106 (0.6%)
Ukrainian: 923 (0.5%)
Armenian: 802 (0.4%)
Eastern European: 670 (0.3%)
French: 603 (0.3%)
Dutch: 580 (0.3%)
Polish: 542 (0.3%)
Norwegian: 534 (0.3%)
Scottish: 477 (0.2%)
Canadian: 459 (0.2%)
Greek: 418 (0.2%)
Lebanese: 411 (0.2%)
Palestinian: 410 (0.2%)
Brazilian: 392 (0.2%)
Iraqi: 359 (0.2%)
Romanian: 342 (0.2%)
Northern European: 310 (0.2%)
Moroccan: 300 (0.2%)
Portuguese: 276 (0.1%)
South African: 260 (0.1%)
Nigerian: 252 (0.1%)
Jordanian: 233 (0.1%)
Israeli: 231 (0.1%)
British: 212 (0.1%)
Hungarian: 211 (0.1%)
Scandinavian: 171 (0.09%)
French Canadian: 169 (0.09%)
Albanian: 166 (0.08%)
Guyanese: 140 (0.07%)
Danish: 136 (0.07%)
Scotch-Irish: 134 (0.07%)
Swiss: 121 (0.06%)
Icelander: 119 (0.06%)
Ethiopian: 115 (0.06%)
Yugoslavian: 104 (0.05%)
Croatian: 97 (0.05%)
Lithuanian: 76 (0.04%)
Serbian: 72 (0.04%)
Finnish: 63 (0.03%)
Assyrian: 61 (0.03%)
Bulgarian: 60 (0.03%)
African: 60 (0.03%)
Welsh: 57 (0.03%)
Austrian: 56 (0.03%)
Czech: 41 (0.02%)
Australian: 39 (0.02%)
Slovak: 39 (0.02%)
Latvian: 31 (0.02%)
Jamaican: 30 (0.02%)
German Russian: 23 (0.01%)
Macedonian: 22 (0.01%)
Basque: 19 (0.01%)
Trinidadian and Tobagonian: 17 (0.01%)
Slavic: 14 (0.01%)
Belgian: 14 (0.01%)
Czechoslovakian: 13 (0.01%)
Kenyan: 10 (0.01%)
Celtic: 10 (0.01%)
Most common places of birth for foreign-born residents (%):
China, excluding Hong Kong and Taiwan
Irvine:
20.2% (24,697)
California:
6.6% (684,672)
India
Irvine:
11.7% (14,387)
California:
5.2% (539,184)
Korea
Irvine:
10.8% (13,204)
California:
3.0% (315,248)
Iran
Irvine:
10.2% (12,504)
California:
2.0% (206,004)
Vietnam
Irvine:
5.6% (6,887)
California:
4.9% (512,335)
Taiwan
Irvine:
5.0% (6,122)
California:
1.7% (176,274)
Philippines
Irvine:
4.1% (5,056)
California:
7.8% (818,297)
Japan
Irvine:
3.5% (4,253)
California:
1.0% (103,575)
Mexico
Irvine:
3.1% (3,775)
California:
37.2% (3,881,193)
Syria
Irvine:
2.0% (2,397)
California:
0.3% (30,949)
Canada
Irvine:
1.8% (2,203)
California:
1.2% (127,477)
Place of birth for U.S.-born residents:
This state: 133,958
Other state: 50,773
Northeast: 12,306
Midwest: 14,831
South: 12,463
West: 11,173
78.2% of Irvine residents lived in the same house 1 years ago. Out of people who lived in different houses, 31.6% lived in this county. Out of people who lived in different counties, 60.7% lived in California.
Irvine:
78.2%
State average:
88.9%
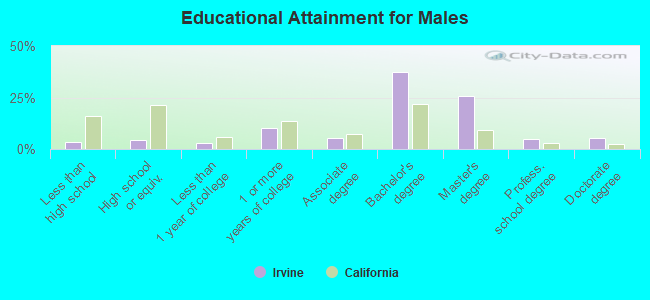
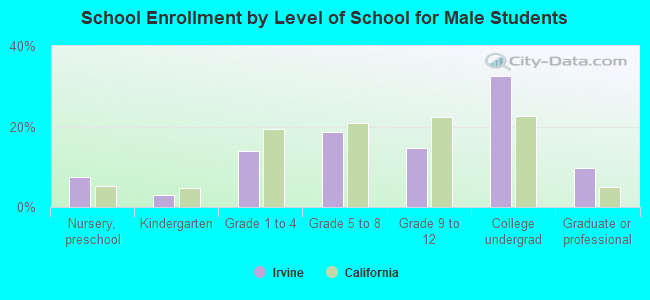
Education attainment for males 25 years and older:
No schooling: 1,194
Nursery to 4th grade: 289
5th and 6th grade: 122
7th and 8th grade: 45
9th grade: 693
10th grade: 60
11th grade: 495
12th grade, no diploma: 449
High school graduate (or equivalency): 4,279
Less than 1 year of college: 2,794
Some college more than 1 year, no degree: 9,620
Associate degree: 5,063
Bachelor's degree: 35,778
Master's degree: 24,628
Professional school degree: 4,840
Doctorate degree: 5,333
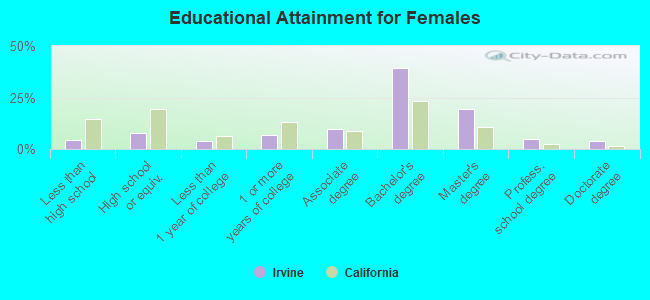
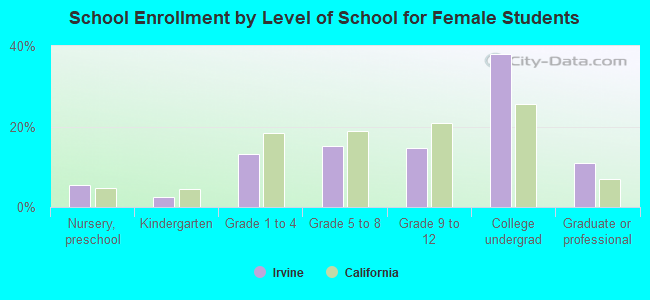
Education attainment for females 25 years and older:
No schooling: 2,155
Nursery to 4th grade: 81
5th and 6th grade: 298
7th and 8th grade: 619
9th grade: 413
10th grade: 95
11th grade: 173
12th grade, no diploma: 786
High school graduate (or equivalency): 8,040
Less than 1 year of college: 3,857
Some college more than 1 year, no degree: 7,288
Associate degree: 10,025
Bachelor's degree: 40,968
Master's degree: 19,965
Professional school degree: 4,888
Doctorate degree: 4,021
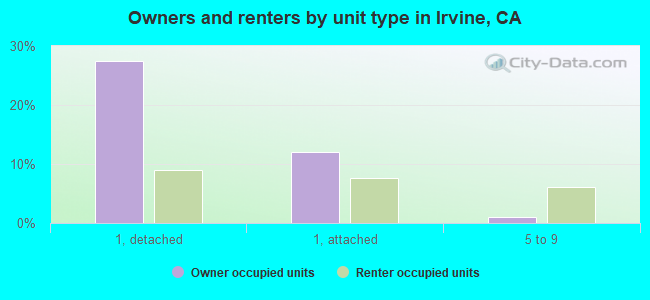
Housing units in structures:
One, detached: 42,512
One, attached: 23,651
Two: 1,530
3 or 4: 5,268
5 to 9: 7,550
10 to 19: 5,466
20 to 49: 6,042
50 or more: 25,889
Mobile homes: 851
Median worth of mobile homes: $217,700
Housing units lacking complete plumbing facilities in 2022: 0.1%
Housing units lacking complete kitchen facilities in 2022: 1.0%