Housing density: 567 houses/condos per square mile
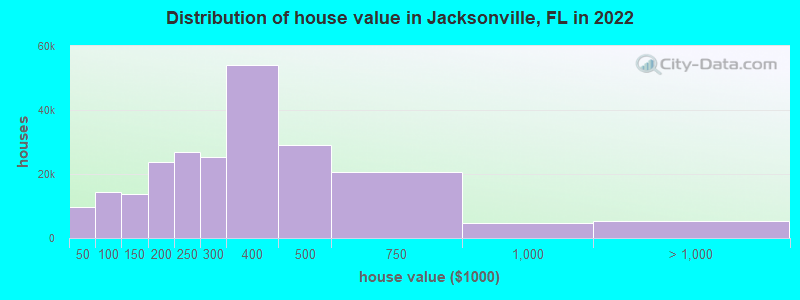
Median price asked for vacant for-sale houses and condos in 2022: $239,400.
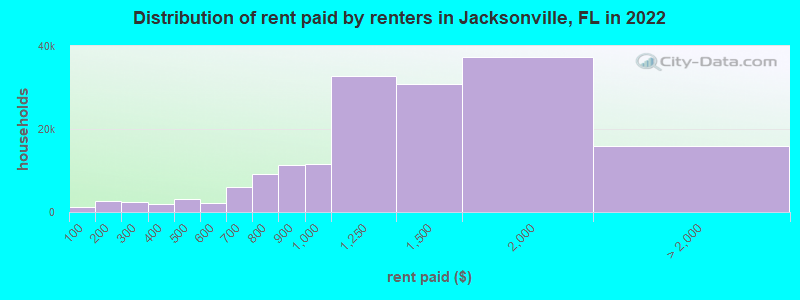
Median contract rent in 2022: $1,230 (lower quartile is $907, upper quartile is $1,600)
Median rent asked for vacant for-rent units in 2022: $1,659
Median gross rent in Jacksonville, FL in 2022: $1,406
Housing units in Jacksonville with a mortgage: 148,669 (10,981 second mortgage, 582 home equity loan, 8,042 both second mortgage and home equity loan) Houses without a mortgage: 2,753
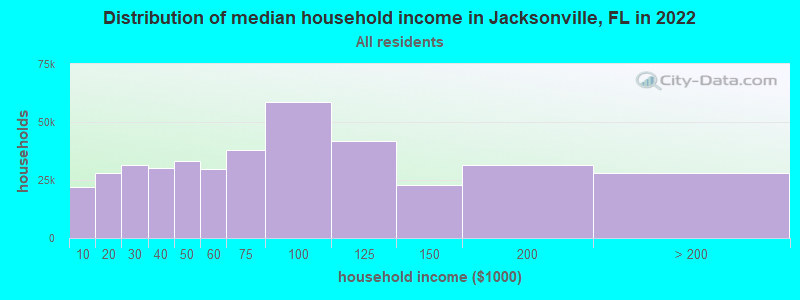
Median household income for houses/condos with a mortgage: $96,041
Median household income for apartments without a mortgage: $64,406
109,221 married couples with children.
78,115 single-parent households (14,313 men, 63,802 women).
82.5% of residents of Jacksonville speak English at home.
8.2% of residents speak Spanish at home (57% speak English very well, 19% speak English well, 18% speak English not well, 6% don't speak English at all).
4.7% of residents speak other Indo-European language at home (72% speak English very well, 19% speak English well, 9% speak English not well, 1% don't speak English at all).
3.1% of residents speak Asian or Pacific Island language at home (57% speak English very well, 28% speak English well, 13% speak English not well, 2% don't speak English at all).
1.5% of residents speak other language at home (64% speak English very well, 28% speak English well, 5% speak English not well, 3% don't speak English at all).
Foreign born population: 122,263 (12.6%)
(56.7% of them are naturalized citizens)
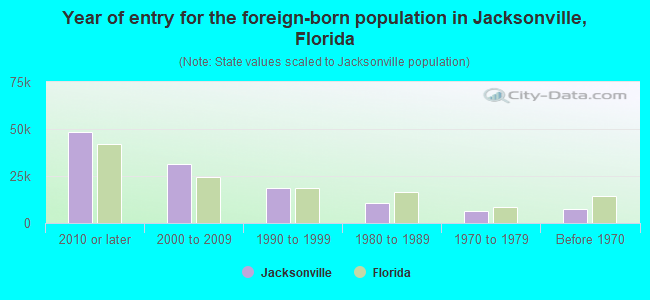
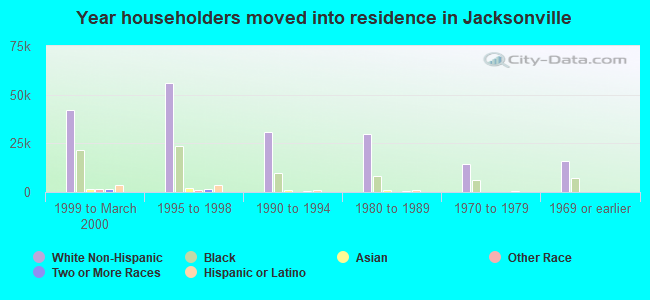
Year of entry for the foreign-born population in Jacksonville, Florida
48,6542010 or later
31,6322000 to 2009
18,5861990 to 1999
10,8911980 to 1989
6,5651970 to 1979
7,375Before 1970
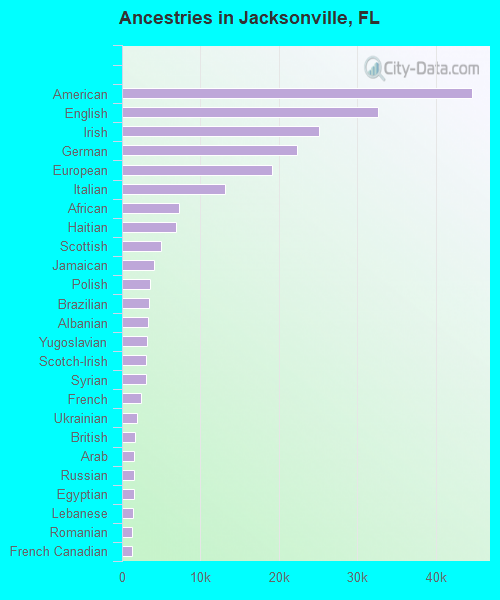
First ancestries reported:
American: 44,585 (8.2%)
English: 32,695 (6.0%)
Irish: 25,129 (4.6%)
German: 22,326 (4.1%)
European: 19,195 (3.5%)
Italian: 13,161 (2.4%)
African: 7,270 (1.3%)
Haitian: 6,893 (1.3%)
Scottish: 4,925 (0.9%)
Jamaican: 4,038 (0.7%)
Polish: 3,554 (0.7%)
Brazilian: 3,455 (0.6%)
Albanian: 3,254 (0.6%)
Yugoslavian: 3,206 (0.6%)
Scotch-Irish: 3,089 (0.6%)
Syrian: 3,081 (0.6%)
French: 2,412 (0.4%)
Ukrainian: 1,954 (0.4%)
British: 1,596 (0.3%)
Arab: 1,546 (0.3%)
Russian: 1,517 (0.3%)
Egyptian: 1,502 (0.3%)
Lebanese: 1,341 (0.2%)
Romanian: 1,294 (0.2%)
French Canadian: 1,249 (0.2%)
Norwegian: 1,228 (0.2%)
Dutch: 1,226 (0.2%)
Nigerian: 1,226 (0.2%)
Iraqi: 1,210 (0.2%)
Greek: 1,209 (0.2%)
Swedish: 1,199 (0.2%)
Portuguese: 903 (0.2%)
Eastern European: 890 (0.2%)
Scandinavian: 874 (0.2%)
Afghan: 770 (0.1%)
Canadian: 684 (0.1%)
Iranian: 674 (0.1%)
Hungarian: 665 (0.1%)
Serbian: 648 (0.1%)
Welsh: 638 (0.1%)
Trinidadian and Tobagonian: 620 (0.1%)
Turkish: 544 (0.10%)
Guyanese: 540 (0.10%)
Ethiopian: 527 (0.10%)
West Indian: 509 (0.09%)
Bulgarian: 446 (0.08%)
Sudanese: 430 (0.08%)
Northern European: 407 (0.07%)
Czech: 395 (0.07%)
Slavic: 385 (0.07%)
Danish: 302 (0.06%)
Bahamian: 299 (0.05%)
Cape Verdean: 294 (0.05%)
Croatian: 290 (0.05%)
Moroccan: 285 (0.05%)
Palestinian: 263 (0.05%)
Czechoslovakian: 250 (0.05%)
Austrian: 243 (0.04%)
Swiss: 228 (0.04%)
Jordanian: 224 (0.04%)
British West Indian: 216 (0.04%)
Finnish: 208 (0.04%)
Slovak: 200 (0.04%)
Cajun: 191 (0.04%)
South African: 188 (0.03%)
Lithuanian: 183 (0.03%)
Barbadian: 181 (0.03%)
New Zealander: 161 (0.03%)
Ghanaian: 157 (0.03%)
Belizean: 131 (0.02%)
Australian: 129 (0.02%)
Kenyan: 92 (0.02%)
Armenian: 82 (0.02%)
Macedonian: 78 (0.01%)
Sierra Leonean: 70 (0.01%)
Cypriot: 69 (0.01%)
Liberian: 69 (0.01%)
U.S. Virgin Islander: 52 (0.01%)
Estonian: 49 (0.01%)
Celtic: 43 (0.01%)
Belgian: 41 (0.01%)
Israeli: 40 (0.01%)
Basque: 38 (0.01%)
Icelander: 32 (0.01%)
Latvian: 29 (0.01%)
Most common places of birth for foreign-born residents (%):
Philippines
Jacksonville:
11.2% (13,505)
Florida:
1.8% (84,403)
India
Jacksonville:
7.2% (8,717)
Florida:
2.1% (94,349)
Cuba
Jacksonville:
5.7% (6,812)
Florida:
22.0% (1,006,576)
Haiti
Jacksonville:
5.3% (6,438)
Florida:
7.5% (342,375)
Venezuela
Jacksonville:
5.2% (6,288)
Florida:
5.7% (262,042)
Mexico
Jacksonville:
4.3% (5,143)
Florida:
5.6% (257,152)
Jamaica
Jacksonville:
3.5% (4,263)
Florida:
5.0% (227,319)
Brazil
Jacksonville:
3.3% (4,007)
Florida:
2.7% (122,906)
Colombia
Jacksonville:
3.0% (3,573)
Florida:
6.5% (298,669)
Vietnam
Jacksonville:
2.8% (3,371)
Florida:
1.3% (60,604)
Bosnia and Herzegovina
Jacksonville:
2.4% (2,865)
Florida:
0.2% (8,695)
Honduras
Jacksonville:
2.2% (2,620)
Florida:
2.3% (107,160)
Guatemala
Jacksonville:
1.9% (2,345)
Florida:
2.1% (97,632)
Syria
Jacksonville:
1.9% (2,302)
Florida:
0.2% (7,299)
Ukraine
Jacksonville:
1.7% (2,080)
Florida:
0.5% (21,886)
Dominican Republic
Jacksonville:
1.7% (2,063)
Florida:
3.0% (137,727)
Albania
Jacksonville:
1.7% (2,006)
Florida:
0.2% (9,779)
China, excluding Hong Kong and Taiwan
Jacksonville:
1.6% (1,985)
Florida:
1.2% (56,071)
Place of birth for U.S.-born residents:
This state: 457,883
Other state: 362,250
Northeast: 94,403
Midwest: 71,918
South: 158,079
West: 37,850
83.8% of Jacksonville residents lived in the same house 1 years ago. Out of people who lived in different houses, 36.2% lived in this county. Out of people who lived in different counties, 47.5% lived in Florida.
Jacksonville:
83.8%
State average:
86.3%
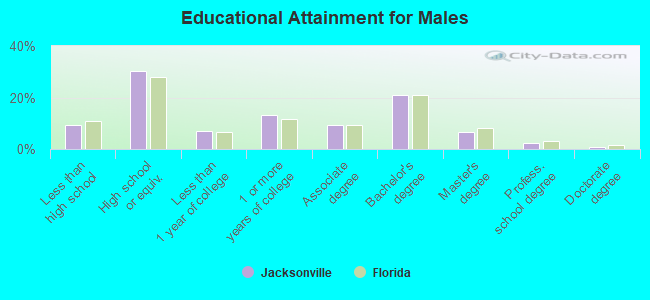
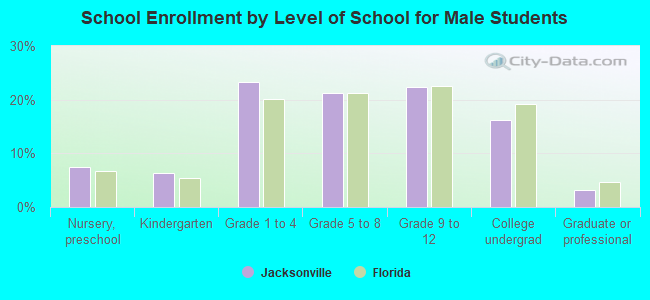
Education attainment for males 25 years and older:
No schooling: 4,209
Nursery to 4th grade: 1,689
5th and 6th grade: 1,684
7th and 8th grade: 2,221
9th grade: 3,896
10th grade: 4,160
11th grade: 4,225
12th grade, no diploma: 6,819
High school graduate (or equivalency): 96,049
Less than 1 year of college: 22,532
Some college more than 1 year, no degree: 41,759
Associate degree: 29,208
Bachelor's degree: 65,732
Master's degree: 21,312
Professional school degree: 7,736
Doctorate degree: 2,865
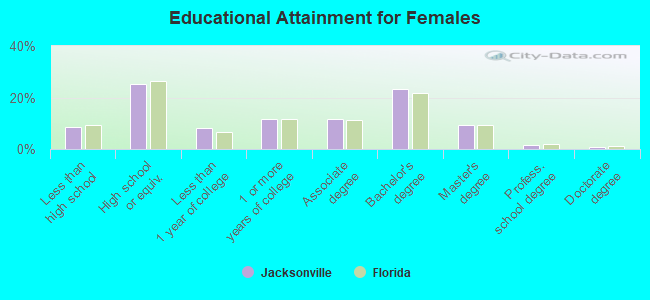
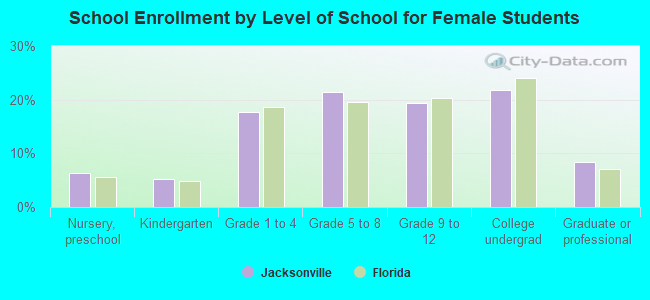
Education attainment for females 25 years and older:
No schooling: 4,740
Nursery to 4th grade: 1,026
5th and 6th grade: 2,115
7th and 8th grade: 2,252
9th grade: 3,159
10th grade: 4,764
11th grade: 5,953
12th grade, no diploma: 5,516
High school graduate (or equivalency): 87,676
Less than 1 year of college: 28,465
Some college more than 1 year, no degree: 40,627
Associate degree: 41,016
Bachelor's degree: 80,812
Master's degree: 32,034
Professional school degree: 5,674
Doctorate degree: 3,334
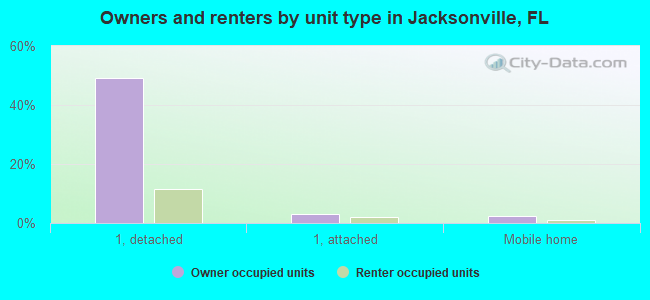
Housing units in structures:
One, detached: 256,939
One, attached: 21,625
Two: 8,728
3 or 4: 22,109
5 to 9: 26,135
10 to 19: 28,187
20 to 49: 21,302
50 or more: 28,805
Mobile homes: 15,264
Boats, RVs, vans, etc.: 298
Median worth of mobile homes: $77,400
Housing units lacking complete plumbing facilities in 2022: 1.3%
Housing units lacking complete kitchen facilities in 2022: 1.6%
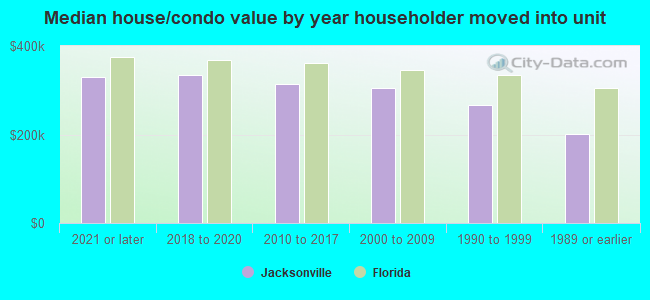
House/condo owner moved in on average 10 years ago