Lambertville, MI (Michigan) Houses and Residents
| Lambertville: | $227,218 |
| Michigan: | $224,400 |
Total population: 9,953 (Urban population: 9,202, Rural population: 0)
Houses: 4,207 (4,142 occupied: 3,856 owner occupied, 287 renter occupied)
| % of renters here: | 7% |
| State: | 27% |
Housing density: 692 houses/condos per square mile
Median price asked for vacant for-sale houses and condos in 2022 in this county: $19,257.
Median contract rent in 2022: $915 (lower quartile is $740, upper quartile is $1,213)
Median rent asked for vacant for-rent units in 2022: $2,772
Median gross rent in Lambertville, MI in 2022: $1,084
Housing units in Lambertville with a mortgage: 2,108 (256 second mortgage, 15 home equity loan, 213 both second mortgage and home equity loan)
Houses without a mortgage: 133
Median household income for houses/condos with a mortgage: $113,660
Median household income for apartments without a mortgage: $90,987
Median monthly housing costs: $1,026
Compare current foreclosures near Lambertville, MI:
| Photo | Address | Area | Beds / Baths | Price | Details |
|---|---|---|---|---|---|

|
#1
Woodmont Dr
Lambertville, MI 48144
|
2,188 sq. feet
|
1 baths 3 beds |
show details | |

|
#2
Carronade Dr
Perrysburg, OH 43551
|
1,918 sq. feet
|
3 baths 4 beds |
$374,900
|
show details |

|
#3
Bricker Ave
Toledo, OH 43608
|
1,611 sq. feet
|
1 baths 3 beds |
$37,500
|
show details |

|
#4
Elm St
Rossford, OH 43460
|
1,416 sq. feet
|
1 baths 4 beds |
$169,900
|
show details |

|
#5
Hazeldell Dr
Temperance, MI 48182
|
1,199 sq. feet
|
1 baths 3 beds |
$220,000
|
show details |

|
#6
Leybourn Ave
Toledo, OH 43612
|
1,126 sq. feet
|
1 baths 3 beds |
$47,900
|
show details |

|
#7
Duncan Rd
Toledo, OH 43613
|
820 sq. feet
|
1 baths 2 beds |
$34,900
|
show details |

|
#8
Nottingham Ter
Toledo, OH 43610
|
2,073 sq. feet
|
1 baths 4 beds |
$47,500
|
show details |

|
#9
Birckhead Pl
Toledo, OH 43608
|
2,753 sq. feet
|
1 baths 3 beds |
$84,900
|
show details |

|
#10
Edgevale Dr
Lambertville, MI 48144
|
- sq. feet
|
- baths - beds |
show details |
| Photo | Address | Area | Beds / Baths | Price | Details |
|---|---|---|---|---|---|

|
#11
Kensington Rd
Lambertville, MI 48144
|
- sq. feet
|
- baths - beds |
show details | |

|
#12
S Valley Cir
Lambertville, MI 48144
|
- sq. feet
|
- baths - beds |
show details | |

|
#13
Northcreek Woods
Lambertville, MI 48144
|
- sq. feet
|
- baths - beds |
show details | |

|
#14
Burkenhead Pl
Lambertville, MI 48144
|
- sq. feet
|
- baths - beds |
show details | |

|
#15
Michelle Ln
Lambertville, MI 48144
|
- sq. feet
|
- baths - beds |
show details | |

|
#16
Linda Ln
Lambertville, MI 48144
|
- sq. feet
|
- baths - beds |
show details | |

|
#17
Burger St
Toledo, OH 43605
|
860 sq. feet
|
1 baths 2 beds |
$19,900
|
show details |

|
#18
Pratt St
Toledo, OH 43605
|
857 sq. feet
|
1 baths 3 beds |
$4,900
|
show details |

|
#19
Springtime Dr
Oregon, OH 43616
|
1,280 sq. feet
|
1 baths 3 beds |
show details | |

|
#20
Asbury Dr
Toledo, OH 43612
|
1,364 sq. feet
|
1 baths 5 beds |
show details |
| Photo | Address | Area | Beds / Baths | Price | Details |
|---|---|---|---|---|---|

|
#21
Walnut St
Rossford, OH 43460
|
- sq. feet
|
1 baths 2 beds |
show details | |

|
#22
Vinal St
Toledo, OH 43605
|
1,030 sq. feet
|
1 baths 2 beds |
show details | |

|
#23
Berdan Ave
Toledo, OH 43613
|
1,352 sq. feet
|
1 baths 3 beds |
show details | |

|
#24
Venice Dr
Northwood, OH 43619
|
1,788 sq. feet
|
2 baths 4 beds |
show details | |

|
#25
Copland Blvd
Toledo, OH 43614
|
2,936 sq. feet
|
2 baths 3 beds |
show details | |

|
#26
Wood St
Petersburg, MI 49270
|
1,668 sq. feet
|
1 baths 3 beds |
show details | |

|
#27
Wallingford Dr
Toledo, OH 43612
|
1,224 sq. feet
|
1 baths 3 beds |
show details | |

|
#28
Gould Rd
Toledo, OH 43612
|
748 sq. feet
|
1 baths 2 beds |
show details | |

|
#29
S Main St
Walbridge, OH 43465
|
1,118 sq. feet
|
1 baths 3 beds |
show details | |

|
#30
S Main St
Walbridge, OH 43465
|
1,782 sq. feet
|
1 baths 3 beds |
show details |
| Photo | Address | Area | Beds / Baths | Price | Details |
|---|---|---|---|---|---|

|
#31
E Adrian St
Blissfield, MI 49228
|
2,401 sq. feet
|
1 baths 4 beds |
show details | |

|
#32
Oak St
Dundee, MI 48131
|
2,052 sq. feet
|
2 baths 4 beds |
show details | |

|
#33
Wildwood Blvd
Toledo, OH 43614
|
1,078 sq. feet
|
1 baths 2 beds |
show details | |

|
#34
Secor Rd
Toledo, OH 43607
|
882 sq. feet
|
1 baths 2 beds |
show details | |

|
#35
Glenbrook Dr
Toledo, OH 43614
|
1,180 sq. feet
|
1 baths 3 beds |
show details | |

|
#36
Claxton St
Toledo, OH 43615
|
1,234 sq. feet
|
1 baths 3 beds |
show details | |

|
#37
Cuba St
Toledo, OH 43615
|
1,363 sq. feet
|
1 baths 3 beds |
show details | |

|
#38
Parkside Blvd
Toledo, OH 43607
|
1,554 sq. feet
|
1 baths 3 beds |
show details | |

|
#39
118th St
Toledo, OH 43611
|
1,279 sq. feet
|
1 baths 4 beds |
show details | |

|
#40
Lakeside Ave
Toledo, OH 43611
|
1,320 sq. feet
|
1 baths 2 beds |
show details |
| Photo | Address | Area | Beds / Baths | Price | Details |
|---|---|---|---|---|---|

|
#41
293rd St
Toledo, OH 43611
|
1,716 sq. feet
|
1 baths 3 beds |
show details | |

|
#42
Bonaparte Dr
Toledo, OH 43615
|
1,152 sq. feet
|
1 baths 3 beds |
show details | |

|
#43
San Jose Dr
Toledo, OH 43615
|
1,504 sq. feet
|
1 baths 3 beds |
show details | |

|
#44
Palmer St
Toledo, OH 43608
|
- sq. feet
|
- baths - beds |
$2,968
|
show details |

|
#45
Austin Bluffs Ct
Toledo, OH 43615
|
2,100 sq. feet
|
2 baths 4 beds |
show details | |

|
#46
Pope Run Ln
Sylvania, OH 43560
|
3,121 sq. feet
|
2 baths 5 beds |
show details | |

|
#47
Hampton Ave
Toledo, OH 43609
|
988 sq. feet
|
1 baths 2 beds |
show details | |

|
#48
Licking St
Toledo, OH 43605
|
- sq. feet
|
- baths - beds |
$7,900
|
show details |

|
#49
E Monroe St
Dundee, MI 48131
|
1,236 sq. feet
|
1 baths 3 beds |
show details | |

|
Check over 1 million property listings on Foreclosure.com!
|
browse all offers | |||

Latest news about housing in Lambertville, MI collected exclusively by city-data.com from local newspapers, TV, and radio stations

 | Possible move from Texas to Saginaw area (52 replies) |
| 2/3 of Michigan Counties add Residents; Wayne County population loss slows to a crawl (33 replies) |
| Moving From Nashville to Flint/Grand Blanc for J.O.B (11 replies) |
| Article: Study shows people are moving to....Michigan? (63 replies) |
| Empty Unfinished House on 23 south of Ann Arbor (5 replies) |
| Areas to avoid in SE michigan? (109 replies) |
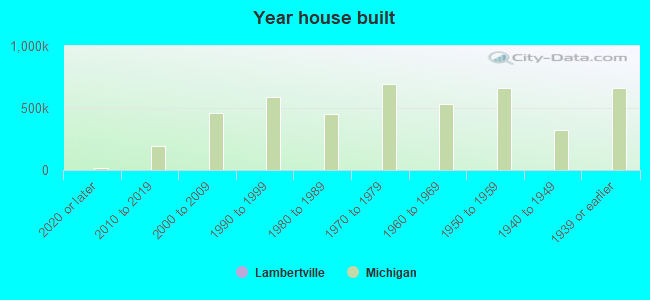
Median year apartment built: 1965
Household type by relationship:
Households: 9,895- Male householders: 2,286 (501 living alone), Female householders: 1,831 (518 living alone)
2,536 spouses (2,536 opposite-sex spouses), 102 unmarried partners, (102 opposite-sex unmarried partners), 2,882 children (2,529 natural, 100 adopted, 252 stepchildren), 92 grandchildren, 21 brothers or sisters, 41 parents, 0 foster children, 26 other relatives, 69 non-relatives
- In group quarters: 6
Size of family households: 1,493 2-persons, 621 3-persons, 538 4-persons, 283 5-persons, 9 6-persons.
Size of nonfamily households: 1,034 1-person, 120 2-persons, 3 3-persons.
1,666 married couples with children.
423 single-parent households (54 men, 369 women).
96.3% of residents of Lambertville speak English at home.
1.3% of residents speak Spanish at home (100% speak English very well).
0.2% of residents speak other Indo-European language at home (100% speak English very well).
0.9% of residents speak Asian or Pacific Island language at home (77% speak English very well, 23% speak English well).
1.4% of residents speak other language at home (48% speak English very well, 52% speak English well).
Foreign born population: 321 (3.2%)
(102.2% of them are naturalized citizens)
| Here: | 7.4 |
| State: | 6.5 |
| Here: | 5.0 |
| State: | 4.3 |
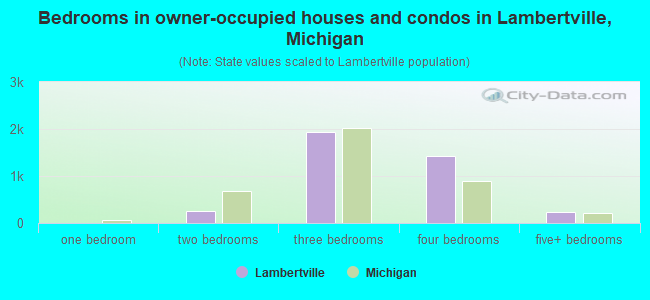
- Bedrooms in owner-occupied houses and condos in Lambertville, Michigan
- 15no bedroom
- 01 bedroom
- 2452 bedrooms
- 1,9423 bedrooms
- 1,4234 bedrooms
- 2325+ bedrooms
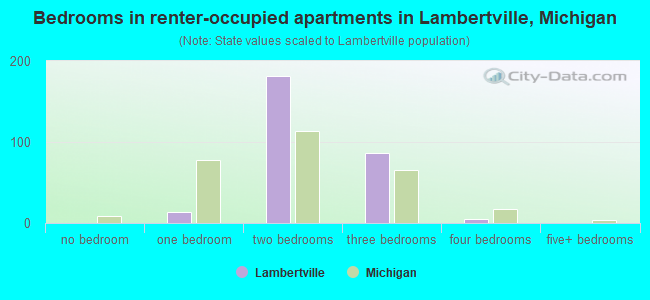
- Bedrooms in renter-occupied apartments in Lambertville, Michigan
- 0no bedroom
- 141 bedroom
- 1812 bedrooms
- 873 bedrooms
- 54 bedrooms
- 05+ bedrooms
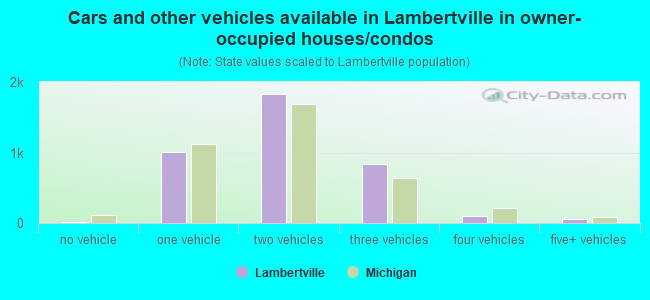
- Cars and other vehicles available in Lambertville in owner-occupied houses/condos
- 11no vehicle
- 1,0131 vehicle
- 1,8232 vehicles
- 8413 vehicles
- 1054 vehicles
- 625+ vehicles
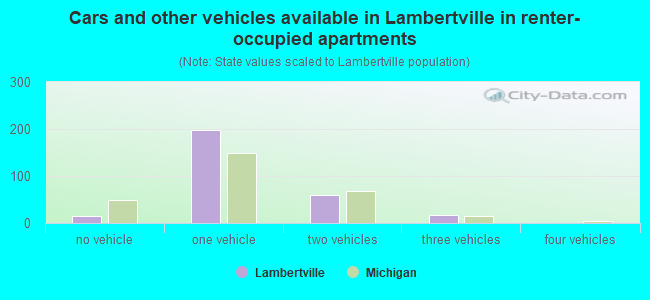
- Cars and other vehicles available in Lambertville in renter-occupied apartments
- 14no vehicle
- 1971 vehicle
- 602 vehicles
- 163 vehicles
- 04 vehicles
- 05+ vehicles
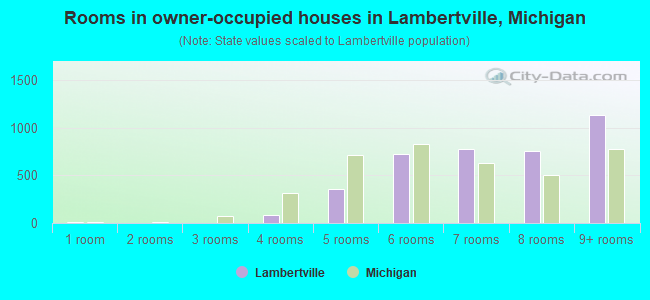
- Rooms in owner-occupied houses in Lambertville, Michigan
- 151 room
- 02 rooms
- 03 rooms
- 844 rooms
- 3595 rooms
- 7286 rooms
- 7767 rooms
- 7578 rooms
- 1,1379+ rooms
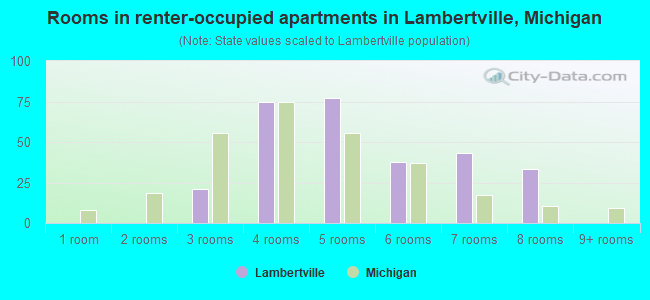
- Rooms in renter-occupied apartments in Lambertville, Michigan
- 01 room
- 02 rooms
- 213 rooms
- 754 rooms
- 775 rooms
- 376 rooms
- 437 rooms
- 338 rooms
- 09+ rooms
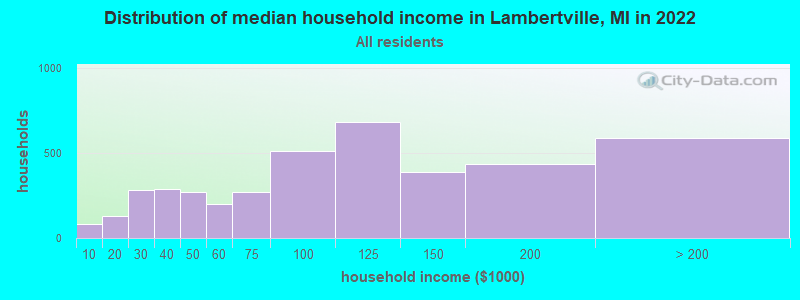
Lambertville, MI household income distribution

- 82Less than $10,000
- 132$10,000 to $19,999
- 280$20,000 to $29,999
- 289$30,000 to $39,999
- 272$40,000 to $49,999
- 202$50,000 to $59,999
- 271$60,000 to $74,999
- 512$75,000 to $99,999
- 681$100,000 to $124,999
- 387$125,000 to $149,999
- 432$150,000 to $199,999
- 587$200,000 or more
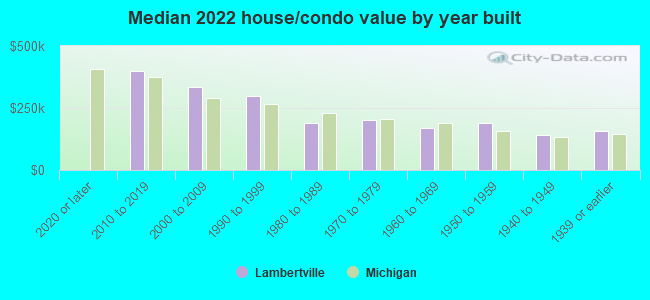
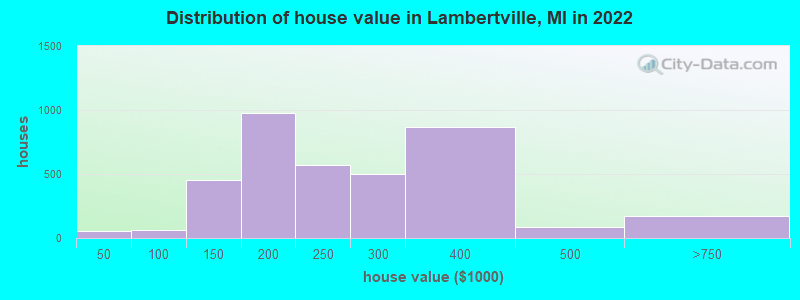
Home value of owner - occupied houses in 2022 in Lambertville, MI
-
- 19$10,000 to $14,999
- 15$25,000 to $29,999
- 16$35,000 to $39,999
- 22$50,000 to $59,999
- 30$80,000 to $89,999
- 6$90,000 to $99,999
- 214$100,000 to $124,999
- 238$125,000 to $149,999
- 527$150,000 to $174,999
- 448$175,000 to $199,999
- 566$200,000 to $249,999
- 496$250,000 to $299,999
- 868$300,000 to $399,999
- 85$400,000 to $499,999
- 168$500,000 to $749,999
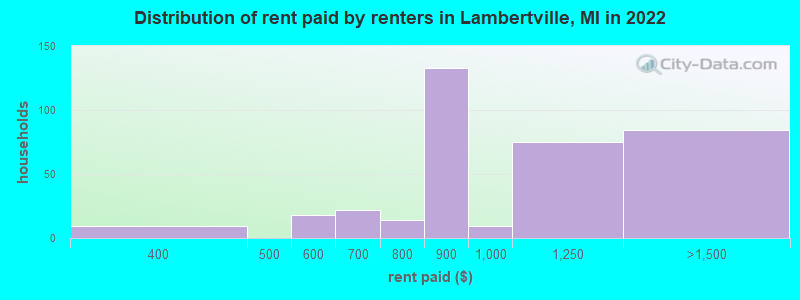
Rent paid by renters in 2022 in Lambertville, MI
-
- 8$300 to $349
- 18$550 to $599
- 21$600 to $649
- 13$700 to $749
- 132$800 to $899
- 8$900 to $999
- 74$1,000 to $1,249
- 83$1,250 to $1,499
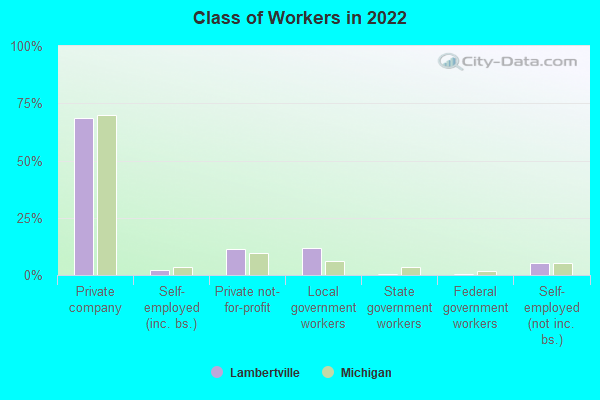
Percentage of workers working in this county: 35.5%
Number of people working at home: 575 (11.3% of all workers)
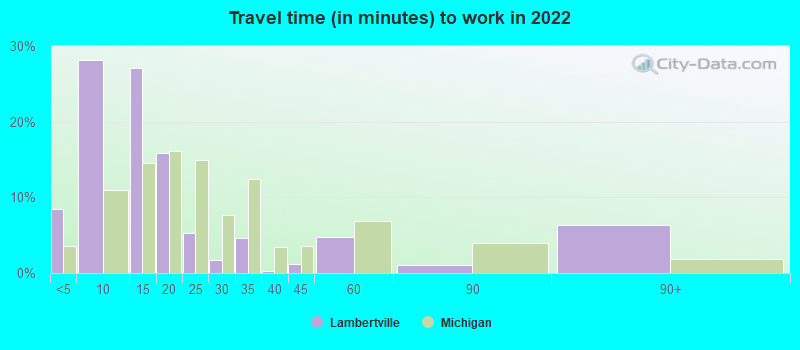
Travel time to work (commute)
- Less than 5 minutes: 278
- 5 to 9 minutes: 283
- 10 to 14 minutes: 506
- 15 to 19 minutes: 558
- 20 to 24 minutes: 1,139
- 25 to 29 minutes: 354
- 30 to 34 minutes: 673
- 35 to 39 minutes: 48
- 40 to 44 minutes: 152
- 45 to 59 minutes: 257
- 60 to 89 minutes: 147
- 90 or more minutes: 70
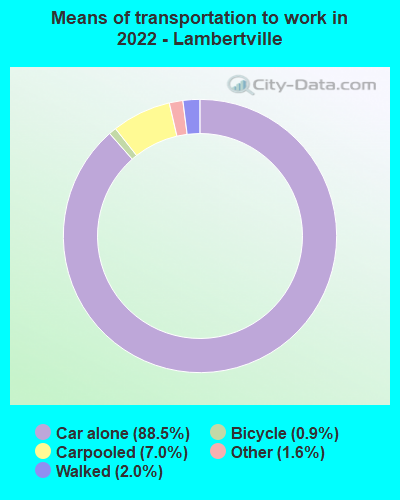
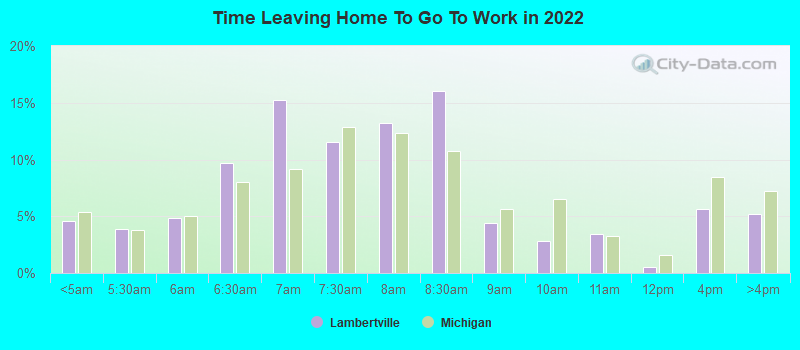
Means of transportation to work:
- Drove a car alone: 1,703 (69.9%)
- Carpooled: 135 (5.5%)
- Taxi: 38 (1.6%)
- Bicycle: 19 (0.8%)
- Walked: 39 (1.6%)
- Worked at home: 575 (23.6%)
- Unemployment by race in 2022
- Unemployment rate for White non-Hispanic residents
- 0.8%Males
- 4.2%Females
- Unemployment rate for two or more race residents
- 16.4%Females
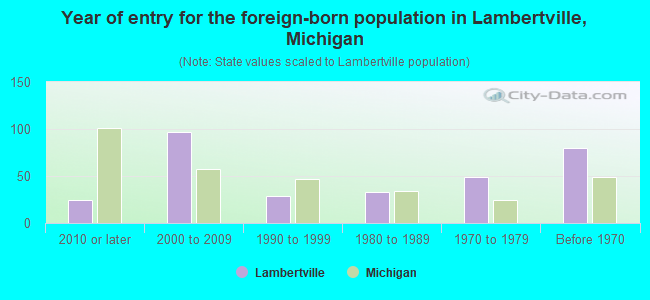
- Year of entry for the foreign-born population in Lambertville, Michigan
- 252010 or later
- 972000 to 2009
- 291990 to 1999
- 331980 to 1989
- 491970 to 1979
- 80Before 1970
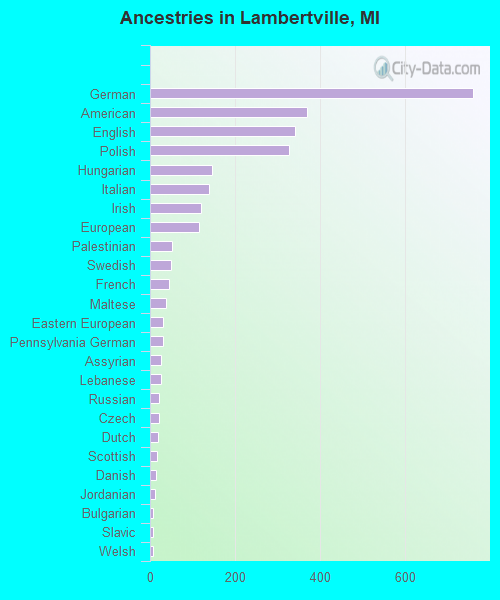
First ancestries reported:
- German: 759 (23.7%)
- American: 369 (11.5%)
- English: 342 (10.7%)
- Polish: 326 (10.2%)
- Hungarian: 146 (4.6%)
- Italian: 138 (4.3%)
- Irish: 121 (3.8%)
- European: 116 (3.6%)
- Palestinian: 51 (1.6%)
- Swedish: 50 (1.6%)
- French: 44 (1.4%)
- Maltese: 37 (1.2%)
- Eastern European: 31 (1.0%)
- Pennsylvania German: 30 (0.9%)
- Assyrian: 26 (0.8%)
- Lebanese: 25 (0.8%)
- Russian: 22 (0.7%)
- Czech: 20 (0.6%)
- Dutch: 18 (0.6%)
- Scottish: 17 (0.5%)
- Danish: 13 (0.4%)
- Jordanian: 11 (0.3%)
- Bulgarian: 8 (0.3%)
- Slavic: 8 (0.3%)
- Welsh: 8 (0.3%)
- French Canadian: 7 (0.2%)
Most common places of birth for foreign-born residents (%):
| Lambertville: | 22.5% (80) |
| Michigan: | 1.0% (7,097) |
| Lambertville: | 12.4% (44) |
| Michigan: | 2.8% (19,112) |
| Lambertville: | 10.1% (36) |
| Michigan: | 0.3% (2,076) |
| Lambertville: | 9.9% (35) |
| Michigan: | 2.3% (16,126) |
| Lambertville: | 9.6% (34) |
| Michigan: | 3.0% (20,884) |
| Lambertville: | 9.3% (33) |
| Michigan: | 0.1% (975) |
| Lambertville: | 9.0% (32) |
| Michigan: | 8.1% (55,954) |
| Lambertville: | 7.0% (25) |
| Michigan: | 0.2% (1,437) |
| Lambertville: | 5.9% (21) |
| Michigan: | 0.7% (4,939) |
| Lambertville: | 2.5% (9) |
| Michigan: | 3.7% (25,634) |
Place of birth for U.S.-born residents:
- This state: 2,188
- Other state: 7,338
- Northeast: 150
- Midwest: 6,622
- South: 358
- West: 306
92.2% of Lambertville residents lived in the same house 1 years ago.
Out of people who lived in different houses, 37.2% lived in this county.
Out of people who lived in different counties, 27.8% lived in Michigan.
| Lambertville: | 92.2% |
| State average: | 88.4% |
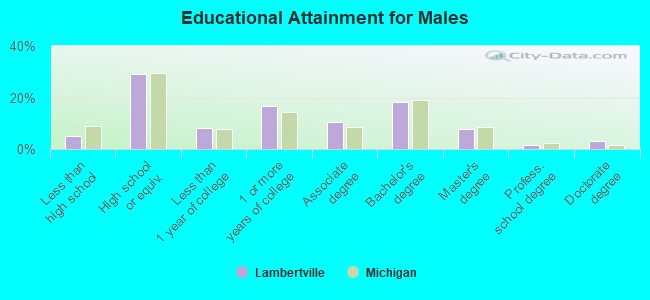
Education attainment for males 25 years and older:
- No schooling: 38
- Nursery to 4th grade: 0
- 5th and 6th grade: 0
- 7th and 8th grade: 13
- 9th grade: 0
- 10th grade: 60
- 11th grade: 30
- 12th grade, no diploma: 35
- High school graduate (or equivalency): 1,044
- Less than 1 year of college: 289
- Some college more than 1 year, no degree: 599
- Associate degree: 379
- Bachelor's degree: 660
- Master's degree: 281
- Professional school degree: 61
- Doctorate degree: 107
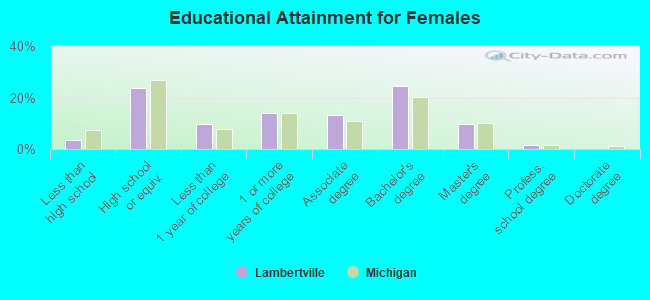
Education attainment for females 25 years and older:
- No schooling: 15
- Nursery to 4th grade: 0
- 5th and 6th grade: 0
- 7th and 8th grade: 0
- 9th grade: 8
- 10th grade: 25
- 11th grade: 69
- 12th grade, no diploma: 17
- High school graduate (or equivalency): 870
- Less than 1 year of college: 355
- Some college more than 1 year, no degree: 511
- Associate degree: 493
- Bachelor's degree: 905
- Master's degree: 364
- Professional school degree: 62
- Doctorate degree: 0

Housing units in structures:
- One, detached: 3,868
- One, attached: 172
- Two: 119
- 50 or more: 38
- Mobile homes: 8
Housing units lacking complete kitchen facilities in 2022: 0.5%
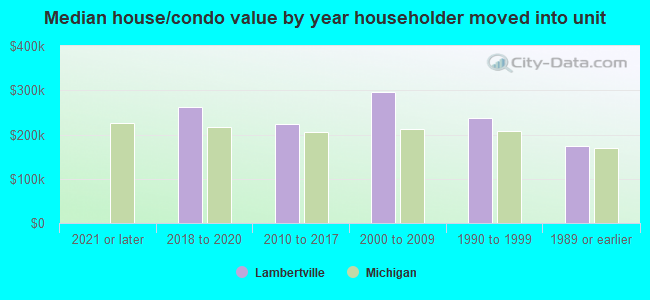
House/condo owner moved in on average 12 years ago
Renter moved in on average 5 years ago
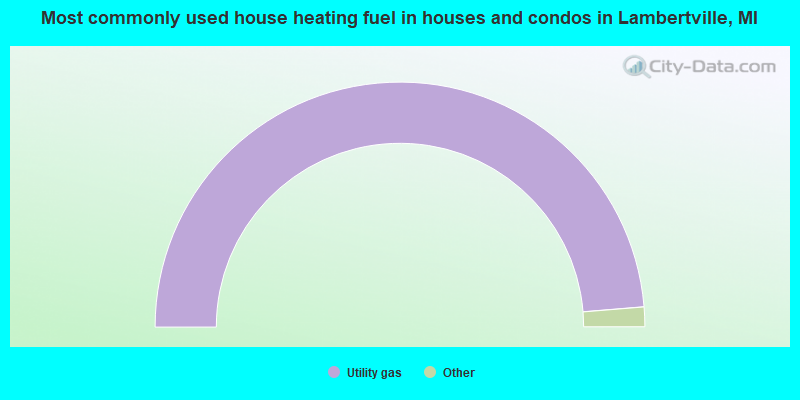
- 97.5%Utility gas
- 1.7%Electricity
- 0.9%Bottled, tank, or LP gas
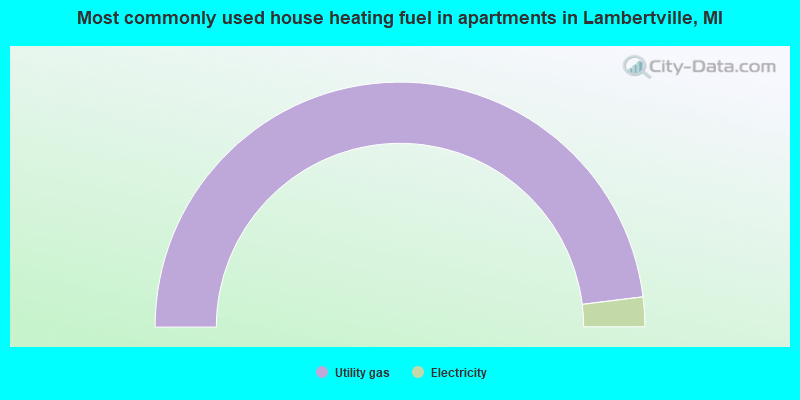
- 96.1%Utility gas
- 3.9%Electricity
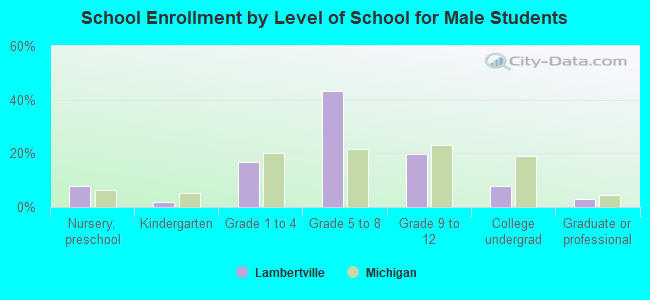
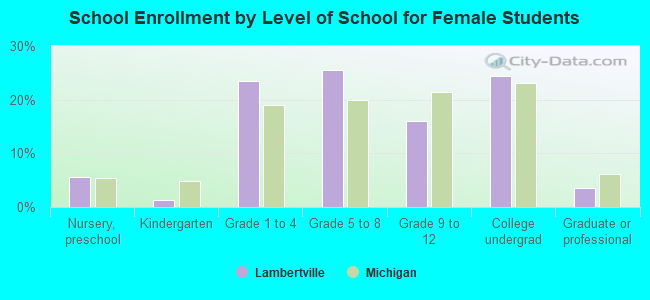
Private vs. public school enrollment:
| Here: | 1.9% |
| Michigan: | 12.4% |
| Here: | 8.4% |
| Michigan: | 9.8% |
| Here: | 20.2% |
| Michigan: | 14.9% |