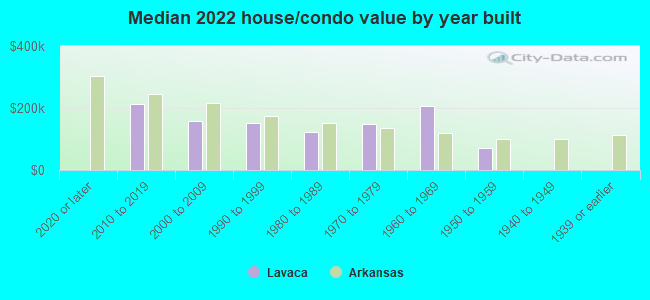
Lavaca, AR (Arkansas) Houses and Residents
| Lavaca: | $158,781 |
| Arkansas: | $179,800 |
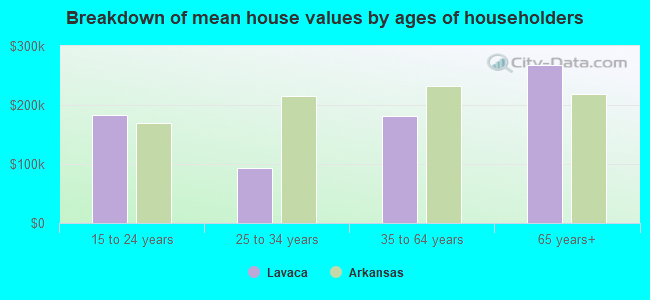
Mean price in 2022:
Detached houses: $179,243
Here: $179,243 State: $243,881 Townhouses or other attached units: $268,355
Here: $268,355 State: $244,376 Mobile homes: $181,222
Here: $181,222 State: $79,566
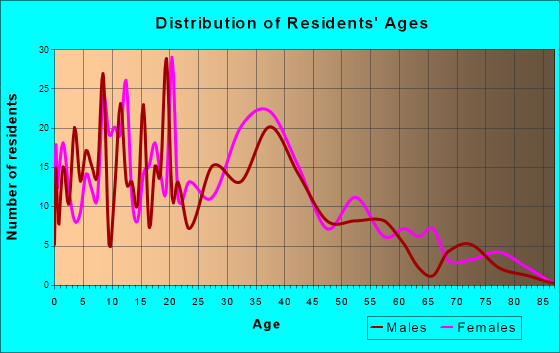
Total population: 2,380 (Urban population: 0, Rural population: 1,851 (5 farm, 1,846 nonfarm))
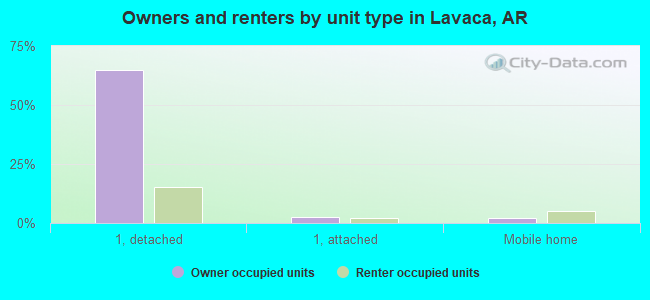
Houses: 982 (850 occupied: 702 owner occupied, 142 renter occupied)
| % of renters here: | 17% |
| State: | 34% |
Housing density: 457 houses/condos per square mile
Median price asked for vacant for-sale houses and condos in 2022: $235,883.
Median contract rent in 2022: $603 (lower quartile is $576, upper quartile is $689)
Median rent asked for vacant for-rent units in 2022: $1,008
Median gross rent in Lavaca, AR in 2022: $772
Housing units in Lavaca with a mortgage: 472 (1 second mortgage, 0 home equity loan, 2 both second mortgage and home equity loan)
Houses without a mortgage: 0
Median household income for houses/condos with a mortgage: $88,814
Median household income for apartments without a mortgage: $71,037
Median monthly housing costs: $761
Compare current foreclosures near Lavaca, AR:
| Photo | Address | Area | Beds / Baths | Price | Details |
|---|---|---|---|---|---|

|
#1
Horne St
Lavaca, AR 72941
|
672 sq. feet
|
1 baths - beds |
show details | |

|
#2
Cedarlakes Cir
Lavaca, AR 72941
|
1,740 sq. feet
|
2 baths - beds |
show details | |

|
#3
Cedarlakes Cir
Lavaca, AR 72941
|
1,644 sq. feet
|
2 baths - beds |
show details | |

|
#4
Ohio Ln
Lavaca, AR 72941
|
1,161 sq. feet
|
1 baths - beds |
show details | |

|
#5
Cardinal Ln
Lavaca, AR 72941
|
1,287 sq. feet
|
1 baths - beds |
show details | |

|
#6
Alice Ln
Lavaca, AR 72941
|
1,215 sq. feet
|
1 baths - beds |
show details | |

|
#7
Kim Cir
Lavaca, AR 72941
|
1,188 sq. feet
|
1 baths - beds |
show details | |

|
#8
Kelly Cir
Lavaca, AR 72941
|
1,894 sq. feet
|
2 baths - beds |
show details | |

|
#9
Carter St
Lavaca, AR 72941
|
1,342 sq. feet
|
2 baths - beds |
show details | |

|
#10
E Tate Ln
Lavaca, AR 72941
|
- sq. feet
|
- baths - beds |
show details |
| Photo | Address | Area | Beds / Baths | Price | Details |
|---|---|---|---|---|---|

|
#11
Hanson Dr
Lavaca, AR 72941
|
- sq. feet
|
- baths - beds |
show details | |

|
#12
Highway 96 SE
Lavaca, AR 72941
|
- sq. feet
|
- baths - beds |
show details | |

|
#13
Mckibben St
Van Buren, AR 72956
|
1,524 sq. feet
|
2 baths 3 beds |
$39,900
|
show details |

|
#14
N 39th St
Fort Smith, AR 72904
|
843 sq. feet
|
1 baths 2 beds |
$119,900
|
show details |

|
#15
Enid St
Fort Smith, AR 72903
|
2,309 sq. feet
|
2 baths 4 beds |
show details | |

|
#16
Hidden Valley Way
Greenwood, AR 72936
|
- sq. feet
|
2 baths 4 beds |
show details | |

|
#17
Georgia Ridge Dr
Mulberry, AR 72947
|
1,260 sq. feet
|
2 baths 3 beds |
show details | |

|
#18
N 16th St
Fort Smith, AR 72901
|
1,826 sq. feet
|
2 baths 3 beds |
show details | |

|
#19
N Ulmer St
Greenwood, AR 72936
|
- sq. feet
|
2 baths 4 beds |
show details | |

|
#20
Azure Hills Dr
Van Buren, AR 72956
|
2,832 sq. feet
|
4 baths 5 beds |
show details |
| Photo | Address | Area | Beds / Baths | Price | Details |
|---|---|---|---|---|---|

|
#21
N 20th St
Van Buren, AR 72956
|
- sq. feet
|
1 baths 2 beds |
show details | |

|
#22
N Highway 71
Alma, AR 72921
|
1,784 sq. feet
|
3 baths - beds |
show details | |

|
#23
Colony Ln
Fort Smith, AR 72908
|
1,400 sq. feet
|
1 baths - beds |
show details | |

|
#24
S 29th St
Fort Smith, AR 72901
|
1,260 sq. feet
|
1 baths - beds |
show details | |

|
#25
Dugan Mill Cir
Fort Smith, AR 72908
|
1,333 sq. feet
|
2 baths - beds |
show details | |

|
#26
Pecan Ln
Greenwood, AR 72936
|
1,568 sq. feet
|
2 baths - beds |
show details | |

|
#27
Lynn Dr
Arkoma, OK 74901
|
1,560 sq. feet
|
2 baths 3 beds |
show details | |

|
#28
Lecta Ave
Fort Smith, AR 72901
|
- sq. feet
|
3 baths 4 beds |
show details | |

|
#29
S 22nd St
Fort Smith, AR 72901
|
- sq. feet
|
1 baths 2 beds |
show details | |

|
#30
Plum St
Fort Smith, AR 72904
|
868 sq. feet
|
1 baths - beds |
show details |
| Photo | Address | Area | Beds / Baths | Price | Details |
|---|---|---|---|---|---|

|
#31
S 30th St
Fort Smith, AR 72901
|
1,324 sq. feet
|
1 baths - beds |
show details | |

|
#32
S Maple St
Ratcliff, AR 72951
|
2,484 sq. feet
|
2 baths - beds |
show details | |

|
#33
Enid St
Fort Smith, AR 72901
|
2,668 sq. feet
|
2 baths - beds |
show details | |

|
#34
Old Greenwood Rd
Fort Smith, AR 72901
|
1,110 sq. feet
|
1 baths - beds |
show details | |

|
#35
Edinburgh Dr
Fort Smith, AR 72908
|
1,976 sq. feet
|
2 baths - beds |
show details | |

|
#36
N 34th St
Fort Smith, AR 72903
|
1,626 sq. feet
|
1 baths - beds |
show details | |

|
#37
Ionia St
Fort Smith, AR 72901
|
1,816 sq. feet
|
2 baths - beds |
show details | |

|
#38
Victory Cir
Fort Smith, AR 72904
|
951 sq. feet
|
1 baths - beds |
show details | |

|
#39
Virginia Ave
Fort Smith, AR 72904
|
1,002 sq. feet
|
1 baths - beds |
show details | |

|
#40
Aubrie Cir
Van Buren, AR 72956
|
1,512 sq. feet
|
2 baths - beds |
show details |
| Photo | Address | Area | Beds / Baths | Price | Details |
|---|---|---|---|---|---|

|
#41
S Q St
Fort Smith, AR 72901
|
1,520 sq. feet
|
1 baths - beds |
show details | |

|
#42
N Highway 71
Alma, AR 72921
|
1,784 sq. feet
|
3 baths - beds |
show details | |

|
#43
N 33rd St
Fort Smith, AR 72904
|
1,092 sq. feet
|
1 baths - beds |
show details | |

|
#44
Sherwood St
Van Buren, AR 72956
|
1,366 sq. feet
|
2 baths - beds |
show details | |

|
#45
Utica St
Fort Smith, AR 72901
|
1,150 sq. feet
|
1 baths - beds |
show details | |

|
#46
Memphis St
Fort Smith, AR 72901
|
1,161 sq. feet
|
1 baths - beds |
show details | |

|
#47
Ionia St
Fort Smith, AR 72901
|
1,496 sq. feet
|
3 baths - beds |
show details | |

|
#48
Bear Hollow Rd
Fort Smith, AR 72916
|
2,307 sq. feet
|
2 baths - beds |
show details | |

|
#49
Cartwright St
Van Buren, AR 72956
|
1,404 sq. feet
|
1 baths - beds |
show details | |

|
Check over 1 million property listings on Foreclosure.com!
|
browse all offers | |||

Latest news about housing in Lavaca, AR collected exclusively by city-data.com from local newspapers, TV, and radio stations

 | Relocate to Arkansas (53 replies) |
| Thinking of a move to Arkansas (30 replies) |
| Moving to Ft. Smith Area from southern NC (25 replies) |
| Calling All Arkansas Dog Lovers! (5 replies) |
Median year apartment built: 1991
Household type by relationship:
Households: 2,483- Male householders: 407 (32 living alone), Female householders: 439 (60 living alone)
650 spouses (650 opposite-sex spouses), 38 unmarried partners, (38 opposite-sex unmarried partners), 789 children (697 natural, 46 adopted, 45 stepchildren), 83 grandchildren, 3 brothers or sisters, 25 parents, 0 foster children, 0 other relatives, 46 non-relatives
Size of family households: 284 2-persons, 265 3-persons, 63 4-persons, 87 5-persons, 11 6-persons, 7 7-or-more-persons.
Size of nonfamily households: 99 1-person, 16 2-persons, 11 4-persons.
715 married couples with children.
57 single-parent households (43 men, 14 women).
98.8% of residents of Lavaca speak English at home.
0.5% of residents speak Spanish at home (36% speak English very well, 64% speak English not well).
Foreign born population: 10 (0.4%)
(70.0% of them are naturalized citizens)
| Here: | 5.4 |
| State: | 6.1 |
| Here: | 4.7 |
| State: | 4.3 |
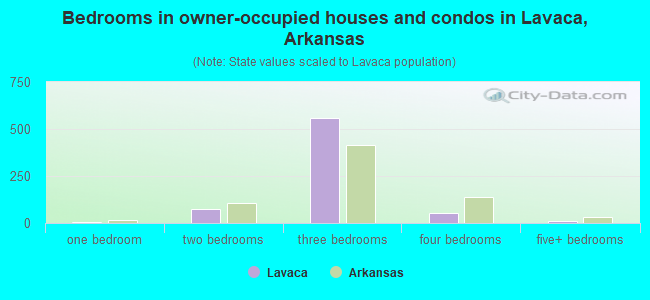
- Bedrooms in owner-occupied houses and condos in Lavaca, Arkansas
- 0no bedroom
- 31 bedroom
- 762 bedrooms
- 5613 bedrooms
- 514 bedrooms
- 115+ bedrooms
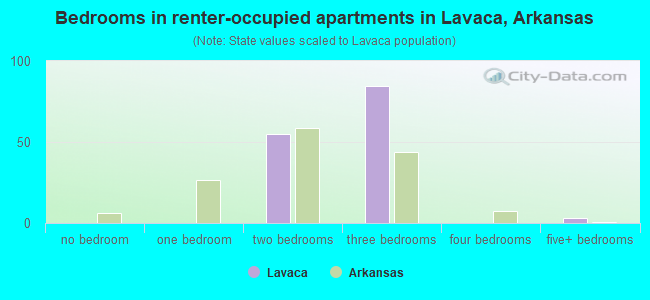
- Bedrooms in renter-occupied apartments in Lavaca, Arkansas
- 0no bedroom
- 01 bedroom
- 552 bedrooms
- 843 bedrooms
- 04 bedrooms
- 35+ bedrooms
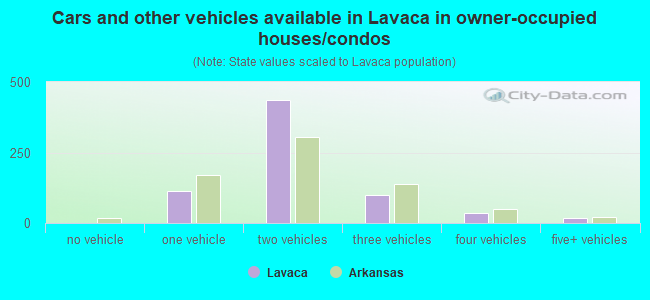
- Cars and other vehicles available in Lavaca in owner-occupied houses/condos
- 0no vehicle
- 1141 vehicle
- 4372 vehicles
- 983 vehicles
- 344 vehicles
- 195+ vehicles
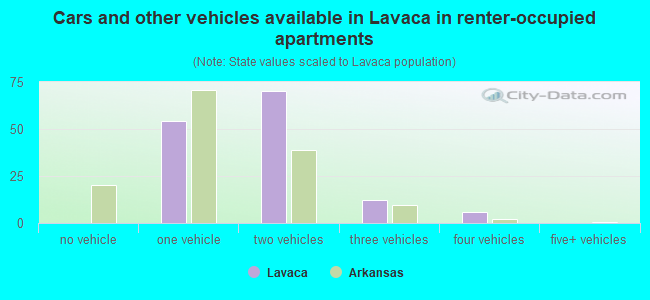
- Cars and other vehicles available in Lavaca in renter-occupied apartments
- 0no vehicle
- 541 vehicle
- 702 vehicles
- 123 vehicles
- 64 vehicles
- 05+ vehicles
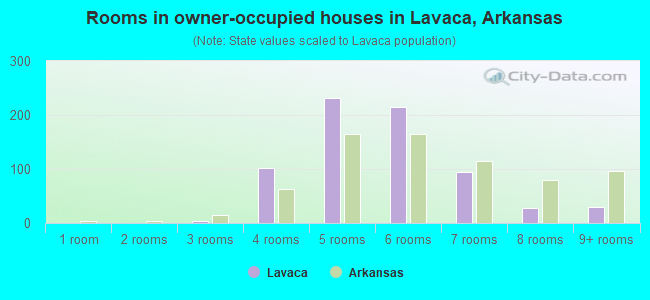
- Rooms in owner-occupied houses in Lavaca, Arkansas
- 01 room
- 02 rooms
- 33 rooms
- 1024 rooms
- 2325 rooms
- 2146 rooms
- 947 rooms
- 278 rooms
- 309+ rooms
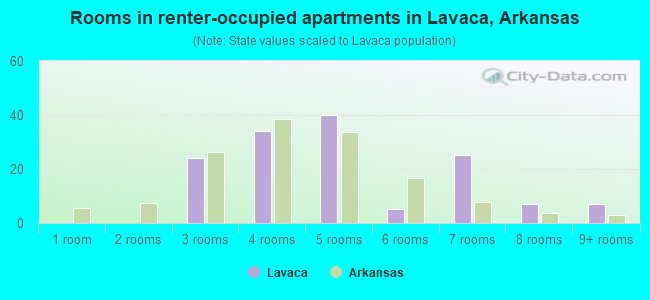
- Rooms in renter-occupied apartments in Lavaca, Arkansas
- 01 room
- 02 rooms
- 243 rooms
- 344 rooms
- 405 rooms
- 56 rooms
- 257 rooms
- 78 rooms
- 79+ rooms
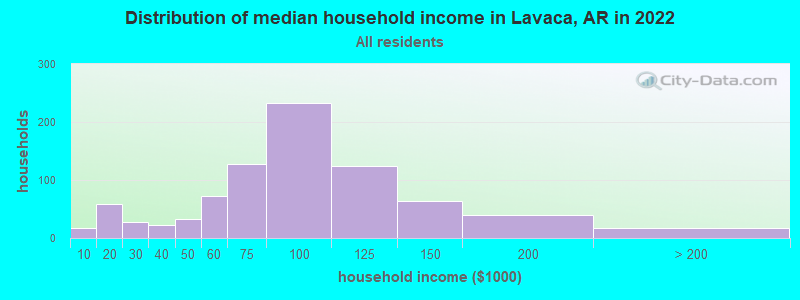
Lavaca, AR household income distribution

- 17Less than $10,000
- 58$10,000 to $19,999
- 28$20,000 to $29,999
- 23$30,000 to $39,999
- 33$40,000 to $49,999
- 72$50,000 to $59,999
- 127$60,000 to $74,999
- 233$75,000 to $99,999
- 124$100,000 to $124,999
- 64$125,000 to $149,999
- 40$150,000 to $199,999
- 17$200,000 or more
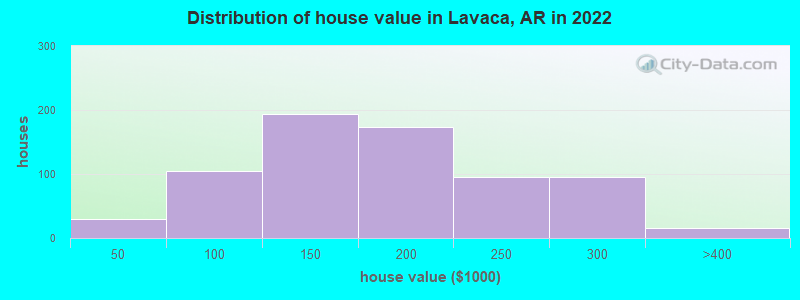
Home value of owner - occupied houses in 2022 in Lavaca, AR
-
- 22Less than $10,000
- 4$10,000 to $14,999
- 3$35,000 to $39,999
- 7$50,000 to $59,999
- 20$60,000 to $69,999
- 8$70,000 to $79,999
- 66$80,000 to $89,999
- 1$90,000 to $99,999
- 88$100,000 to $124,999
- 105$125,000 to $149,999
- 75$150,000 to $174,999
- 98$175,000 to $199,999
- 95$200,000 to $249,999
- 96$250,000 to $299,999
- 14$300,000 to $399,999
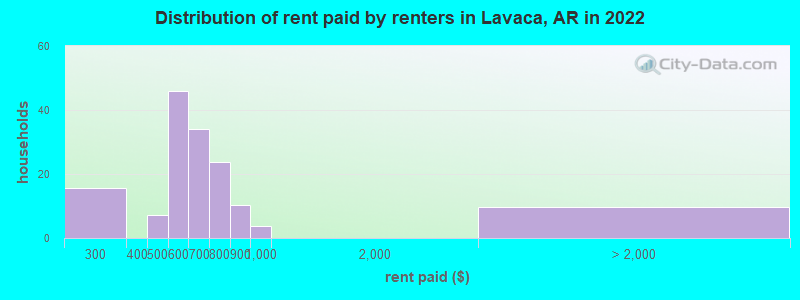
Rent paid by renters in 2022 in Lavaca, AR
-
- 10$200 to $249
- 4$250 to $299
- 7$450 to $499
- 45$550 to $599
- 34$600 to $649
- 23$700 to $749
- 10$800 to $899
- 3$900 to $999
- 9No cash rent
Percentage of workers working in this county: 85.4%
Number of people working at home: 78 (5.6% of all workers)
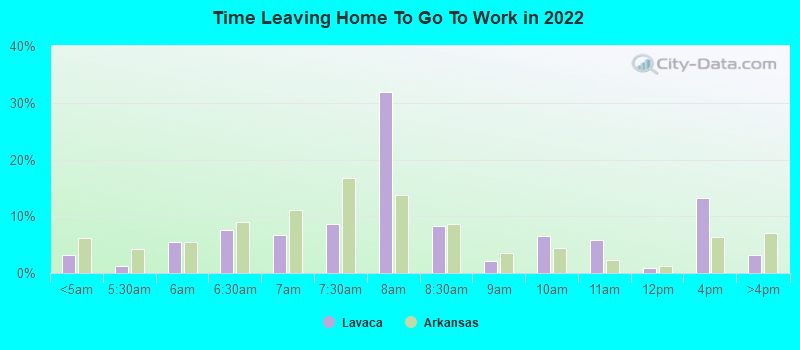
Travel time to work (commute)
- Less than 5 minutes: 59
- 5 to 9 minutes: 103
- 10 to 14 minutes: 63
- 15 to 19 minutes: 211
- 20 to 24 minutes: 335
- 25 to 29 minutes: 141
- 30 to 34 minutes: 153
- 35 to 39 minutes: 47
- 40 to 44 minutes: 27
- 45 to 59 minutes: 0
- 60 to 89 minutes: 31
- 90 or more minutes: 16
Means of transportation to work:
- Drove a car alone: 798 (86.0%)
- Carpooled: 101 (10.9%)
- Walked: 4 (0.4%)
- Other means: 16 (1.7%)
- Worked at home: 9 (1.0%)
- Unemployment by race in 2022
- Unemployment rate for White non-Hispanic residents
- 1.0%Males
- 1.2%Females
- Unemployment rate for two or more race residents
- 23.1%Males
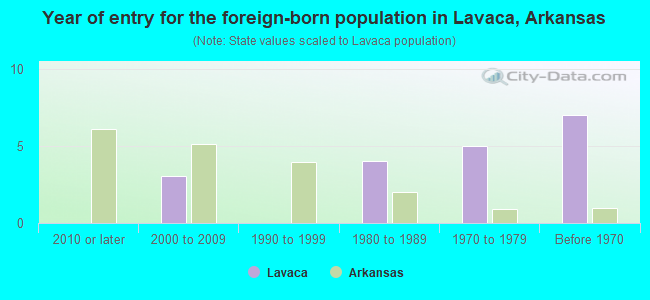
- Year of entry for the foreign-born population in Lavaca, Arkansas
- 02010 or later
- 32000 to 2009
- 01990 to 1999
- 41980 to 1989
- 51970 to 1979
- 7Before 1970
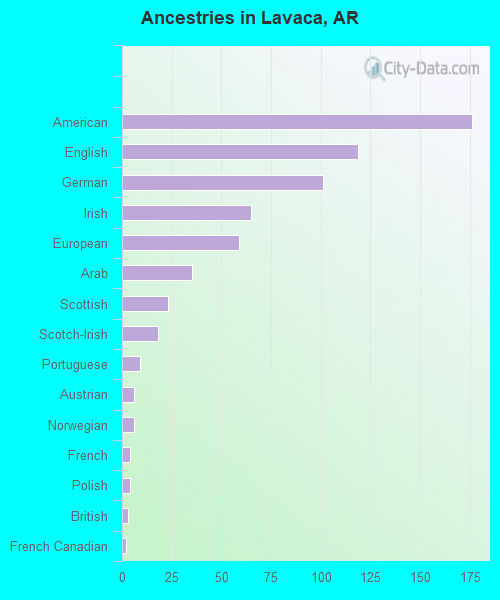
First ancestries reported:
- American: 176 (13.1%)
- English: 119 (8.9%)
- German: 101 (7.5%)
- Irish: 65 (4.8%)
- European: 59 (4.4%)
- Arab: 35 (2.6%)
- Scottish: 23 (1.7%)
- Scotch-Irish: 18 (1.3%)
- Portuguese: 9 (0.7%)
- Austrian: 6 (0.4%)
- Norwegian: 6 (0.4%)
- French: 4 (0.3%)
- Polish: 4 (0.3%)
- British: 3 (0.2%)
- French Canadian: 2 (0.1%)
Most common places of birth for foreign-born residents (%):
| Lavaca: | 63.6% (7) |
| Arkansas: | 1.8% (2,721) |
| Lavaca: | 18.2% (2) |
| Arkansas: | 40.2% (61,075) |
Place of birth for U.S.-born residents:
- This state: 1,810
- Other state: 643
- Northeast: 45
- Midwest: 165
- South: 283
- West: 140
88.1% of Lavaca residents lived in the same house 1 years ago.
Out of people who lived in different houses, 32.1% lived in this county.
Out of people who lived in different counties, 52.0% lived in Arkansas.
| Lavaca: | 88.1% |
| State average: | 87.0% |
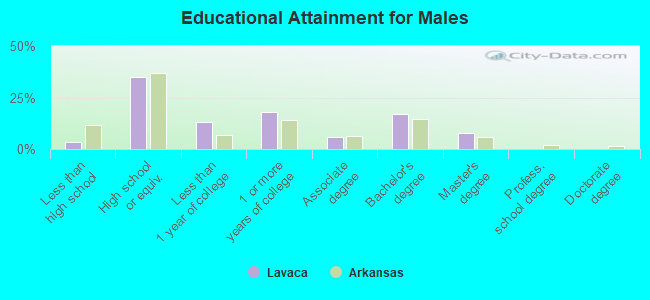
Education attainment for males 25 years and older:
- No schooling: 0
- Nursery to 4th grade: 0
- 5th and 6th grade: 0
- 7th and 8th grade: 4
- 9th grade: 0
- 10th grade: 0
- 11th grade: 0
- 12th grade, no diploma: 20
- High school graduate (or equivalency): 235
- Less than 1 year of college: 88
- Some college more than 1 year, no degree: 122
- Associate degree: 39
- Bachelor's degree: 114
- Master's degree: 53
- Professional school degree: 0
- Doctorate degree: 0
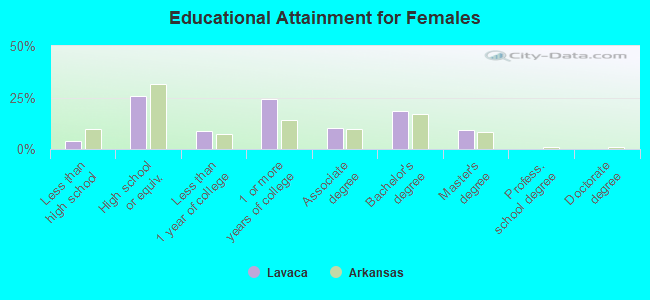
Education attainment for females 25 years and older:
- No schooling: 6
- Nursery to 4th grade: 0
- 5th and 6th grade: 0
- 7th and 8th grade: 0
- 9th grade: 0
- 10th grade: 2
- 11th grade: 15
- 12th grade, no diploma: 8
- High school graduate (or equivalency): 201
- Less than 1 year of college: 68
- Some college more than 1 year, no degree: 192
- Associate degree: 81
- Bachelor's degree: 144
- Master's degree: 71
- Professional school degree: 0
- Doctorate degree: 0
Housing units in structures:
- One, detached: 775
- One, attached: 13
- Two: 18
- 3 or 4: 40
- 10 to 19: 5
- Mobile homes: 130
Median worth of mobile homes: $120,203
Housing units lacking complete kitchen facilities in 2022: 0.4%
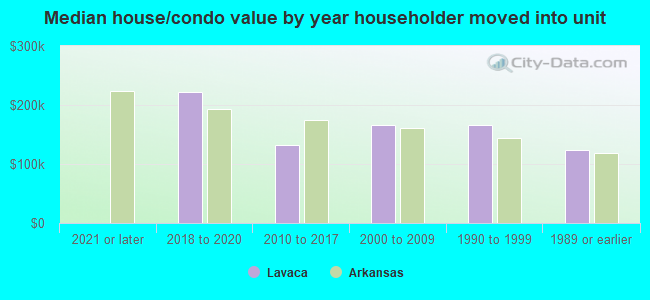
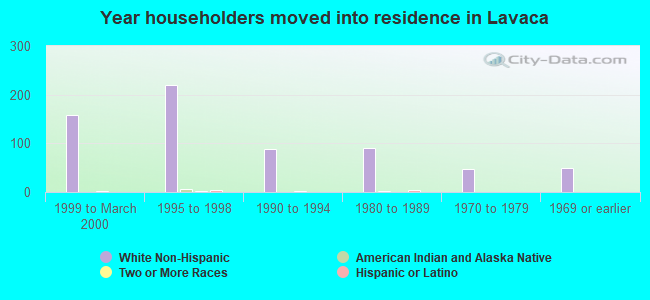
House/condo owner moved in on average 5 years ago
Renter moved in on average 5 years ago
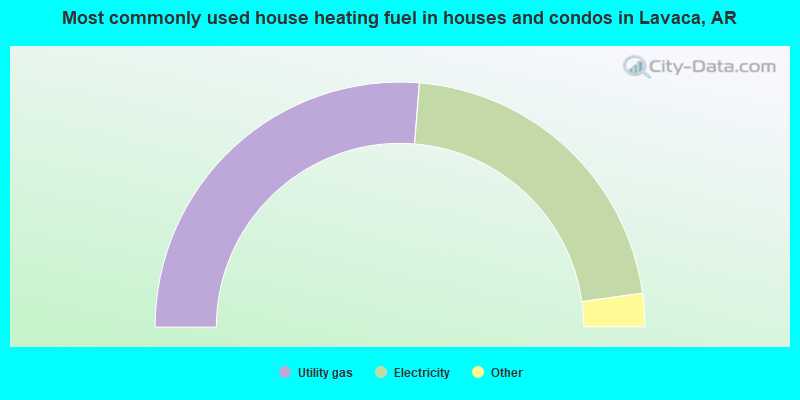
- 52.6%Utility gas
- 43.1%Electricity
- 1.9%Bottled, tank, or LP gas
- 1.4%Wood
- 1.0%Other fuel
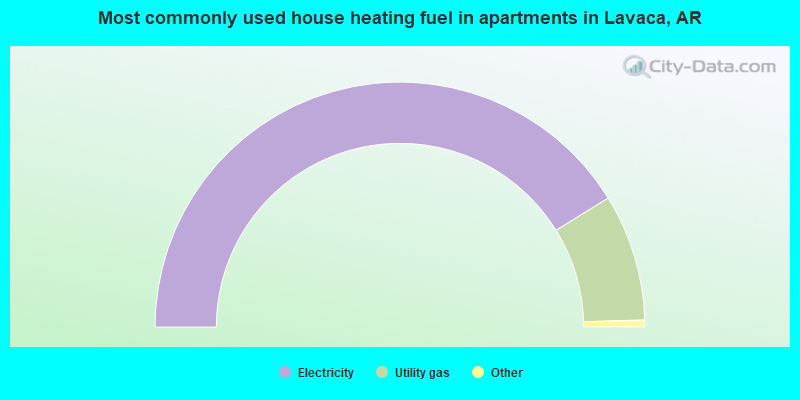
- 83.1%Electricity
- 16.9%Utility gas
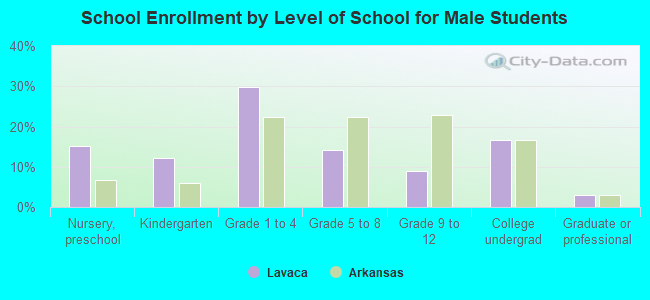
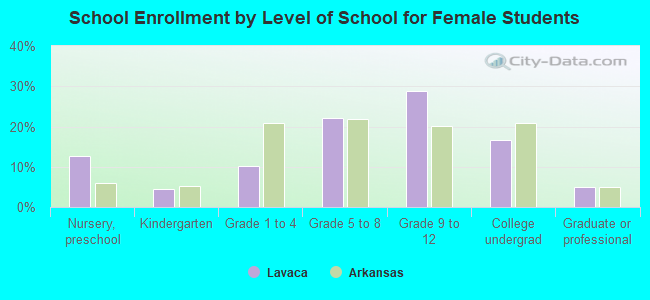
Private vs. public school enrollment:
| Here: | 0.0% |
| Arkansas: | 10.5% |
| Here: | 9.1% |
| Arkansas: | 8.7% |
| Here: | 3.1% |
| Arkansas: | 19.4% |