Lenwood, CA (California) Houses and Residents
| Lenwood: | $117,808 |
| California: | $715,900 |
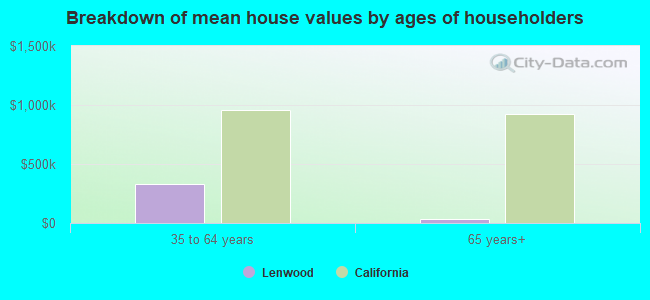
Mean price in 2022:
Detached houses: $185,518
Here: $185,518 State: $988,808 Townhouses or other attached units: $602,186
Here: $602,186 State: $838,546
Total population: 3,543 (Urban population: 2,728 (all inside urban clusters), Rural population: 398 (all nonfarm))
Houses: 1,346 (1,255 occupied: 650 owner occupied, 616 renter occupied)
| % of renters here: | 49% |
| State: | 44% |
Housing density: 546 houses/condos per square mile
Median price asked for vacant for-sale houses and condos in 2022 in this county: $446,573.
Median contract rent in 2022: $979 (lower quartile is $695, upper quartile is $1,291)
Median rent asked for vacant for-rent units in 2022: $1,148
Median gross rent in Lenwood, CA in 2022: $1,282
Housing units in Lenwood with a mortgage: 156 (48 second mortgage, 0 home equity loan, 0 both second mortgage and home equity loan)
Houses without a mortgage: 0
Median monthly housing costs: $866
Compare current foreclosures near Lenwood, CA:
| Photo | Address | Area | Beds / Baths | Price | Details |
|---|---|---|---|---|---|

|
#1
Mirage Dr
Barstow, CA 92311
|
1,277 sq. feet
|
2 baths 3 beds |
$279,900
|
show details |

|
#2
Cedar Rd
Barstow, CA 92311
|
2,274 sq. feet
|
1 baths 4 beds |
show details | |

|
#3
Daggett Yermo Road
Daggett, CA 92327
|
1,200 sq. feet
|
1 baths 3 beds |
show details | |

|
#4
Victor Ave
Barstow, CA 92311
|
1,114 sq. feet
|
1 baths 3 beds |
show details | |

|
#5
Address
Hinkley, CA 92347
|
- sq. feet
|
- baths - beds |
$1
|
show details |

|
#6
Orchid St
Barstow, CA 92311
|
1,088 sq. feet
|
1 baths 3 beds |
show details | |

|
#7
W Buena Vista St
Barstow, CA 92311
|
1,418 sq. feet
|
1 baths 3 beds |
show details | |

|
#8
Blue Water Rd
Helendale, CA 92342
|
2,354 sq. feet
|
2 baths 3 beds |
show details | |

|
#9
E Fredricks St
Barstow, CA 92311
|
908 sq. feet
|
1 baths 1 beds |
show details | |

|
#10
Mesa Dr
Barstow, CA 92311
|
875 sq. feet
|
1 baths 3 beds |
show details |
| Photo | Address | Area | Beds / Baths | Price | Details |
|---|---|---|---|---|---|

|
#11
Lighthouse Lane
Helendale, CA 92342
|
- sq. feet
|
2 baths 3 beds |
show details | |

|
#12
Kelly Dr
Barstow, CA 92311
|
1,196 sq. feet
|
2 baths 4 beds |
show details | |

|
#13
Pinto Rd
Helendale, CA 92342
|
2,938 sq. feet
|
3 baths 4 beds |
show details | |

|
#14
Leona St
Barstow, CA 92311
|
1,092 sq. feet
|
1 baths 3 beds |
show details | |

|
#15
Mesa Dr
Barstow, CA 92311
|
875 sq. feet
|
1 baths 3 beds |
show details | |

|
#16
Palermo St
Barstow, CA 92311
|
1,114 sq. feet
|
2 baths 3 beds |
show details | |

|
#17
Fenmore Dr
Barstow, CA 92311
|
1,168 sq. feet
|
2 baths 3 beds |
show details | |

|
#18
Address
Helendale, CA 92342
|
- sq. feet
|
- baths - beds |
$9,950
|
show details |

|
#19
Palo Verde Dr
Barstow, CA 92311
|
1,630 sq. feet
|
2 baths 3 beds |
show details | |

|
#20
Wisteria Ave
Barstow, CA 92311
|
1,902 sq. feet
|
2 baths 4 beds |
show details |
| Photo | Address | Area | Beds / Baths | Price | Details |
|---|---|---|---|---|---|

|
#21
Neuman Rd
Barstow, CA 92311
|
804 sq. feet
|
1 baths 2 beds |
show details | |

|
#22
Cinnabar Rd
Barstow, CA 92311
|
1,466 sq. feet
|
2 baths 3 beds |
show details | |

|
#23
W Main St Spc 95
Barstow, CA 92311
|
1,152 sq. feet
|
2 baths 2 beds |
show details | |

|
#24
Nautical Ln, # C1373
Helendale, CA 92342
|
- sq. feet
|
- baths - beds |
show details | |

|
#25
Edgewater Ln
Helendale, CA 92342
|
- sq. feet
|
- baths - beds |
show details | |

|
#26
Cool Glen Dr
Helendale, CA 92342
|
- sq. feet
|
- baths - beds |
show details | |

|
#27
Bejoal St
Barstow, CA 92311
|
- sq. feet
|
- baths - beds |
show details | |

|
#28
Jellico St
Yermo, CA 92398
|
- sq. feet
|
- baths - beds |
show details | |

|
#29
Borrego Dr Apt 2
Barstow, CA 92311
|
- sq. feet
|
- baths - beds |
show details | |

|
#30
E Virginia Way
Barstow, CA 92311
|
- sq. feet
|
- baths - beds |
show details |
| Photo | Address | Area | Beds / Baths | Price | Details |
|---|---|---|---|---|---|

|
#31
Berkeley Dr
Barstow, CA 92311
|
- sq. feet
|
- baths - beds |
show details | |

|
#32
W Main 91
Barstow, CA 92311
|
- sq. feet
|
- baths - beds |
show details | |

|
#33
Galleon Ln
Helendale, CA 92342
|
- sq. feet
|
- baths - beds |
show details | |

|
Check over 1 million property listings on Foreclosure.com!
|
browse all offers | |||

Latest news about housing in Lenwood, CA collected exclusively by city-data.com from local newspapers, TV, and radio stations


Median year apartment built: 1973
Household type by relationship:
Households: 4,040- Male householders: 480 (81 living alone), Female householders: 766 (174 living alone)
579 spouses (579 opposite-sex spouses), 83 unmarried partners, (83 opposite-sex unmarried partners), 1,780 children (1,439 natural, 333 adopted, 7 stepchildren), 92 grandchildren, 16 brothers or sisters, 65 parents, 0 foster children, 86 other relatives, 88 non-relatives
Size of family households: 117 2-persons, 354 3-persons, 323 4-persons, 80 5-persons, 28 6-persons, 88 7-or-more-persons.
Size of nonfamily households: 252 1-person, 9 2-persons.
532 married couples with children.
724 single-parent households (184 men, 540 women).
67.5% of residents of Lenwood speak English at home.
29.2% of residents speak Spanish at home (81% speak English very well, 19% speak English well).
2.2% of residents speak other Indo-European language at home (24% speak English very well, 10% speak English well, 65% speak English not well).
0.3% of residents speak Asian or Pacific Island language at home (100% speak English very well).
Foreign born population: 245 (6.1%)
(62.9% of them are naturalized citizens)
| Here: | 6.6 |
| State: | 6.0 |
| Here: | 4.9 |
| State: | 3.9 |
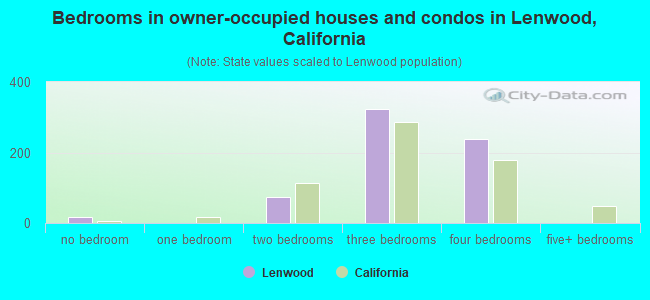
- Bedrooms in owner-occupied houses and condos in Lenwood, California
- 16no bedroom
- 01 bedroom
- 742 bedrooms
- 3233 bedrooms
- 2384 bedrooms
- 05+ bedrooms
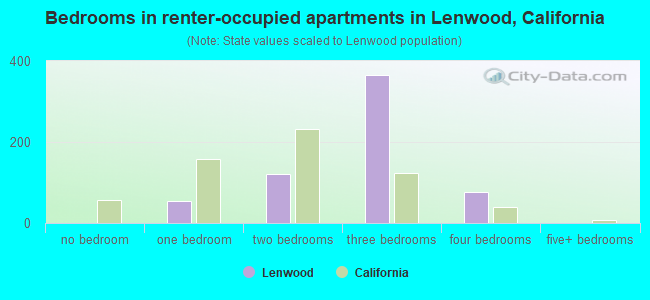
- Bedrooms in renter-occupied apartments in Lenwood, California
- 0no bedroom
- 541 bedroom
- 1212 bedrooms
- 3663 bedrooms
- 764 bedrooms
- 05+ bedrooms
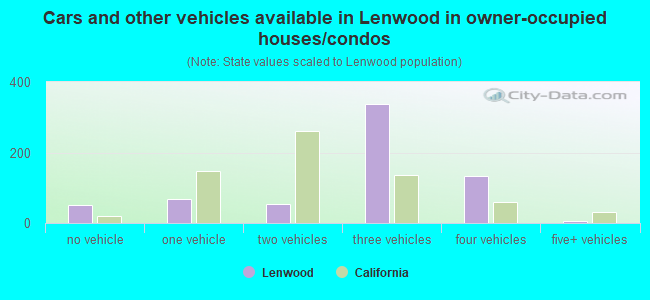
- Cars and other vehicles available in Lenwood in owner-occupied houses/condos
- 51no vehicle
- 681 vehicle
- 542 vehicles
- 3373 vehicles
- 1334 vehicles
- 75+ vehicles
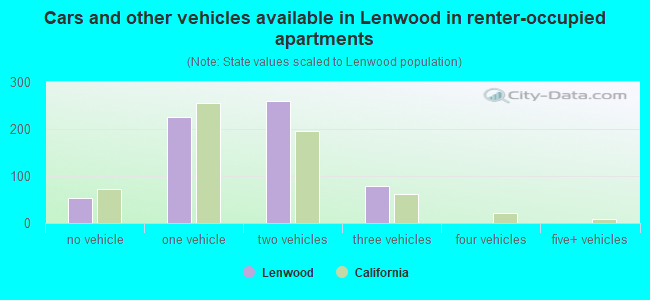
- Cars and other vehicles available in Lenwood in renter-occupied apartments
- 53no vehicle
- 2251 vehicle
- 2592 vehicles
- 793 vehicles
- 04 vehicles
- 05+ vehicles
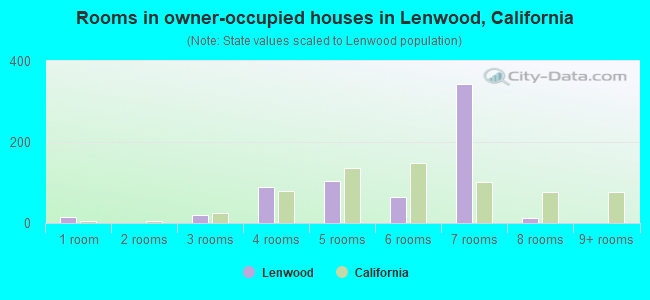
- Rooms in owner-occupied houses in Lenwood, California
- 161 room
- 02 rooms
- 193 rooms
- 884 rooms
- 1045 rooms
- 656 rooms
- 3447 rooms
- 138 rooms
- 09+ rooms
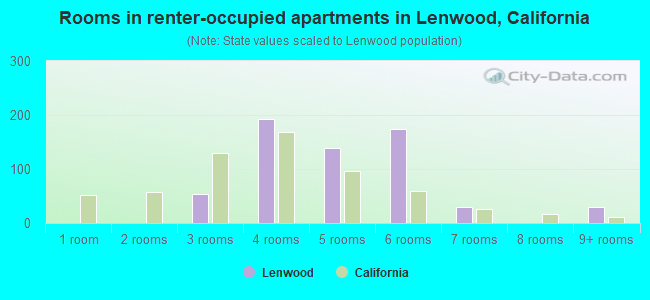
- Rooms in renter-occupied apartments in Lenwood, California
- 01 room
- 02 rooms
- 543 rooms
- 1924 rooms
- 1385 rooms
- 1746 rooms
- 297 rooms
- 08 rooms
- 309+ rooms
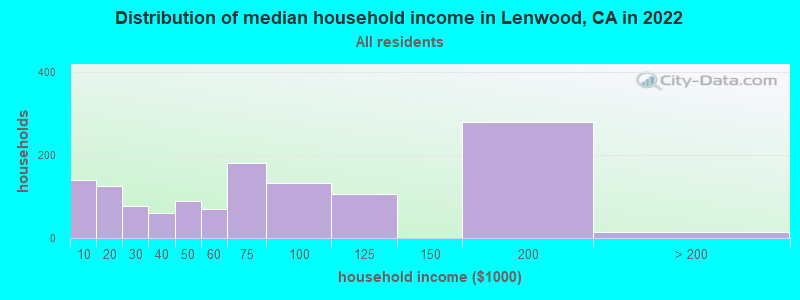
Lenwood, CA household income distribution

- 140Less than $10,000
- 126$10,000 to $19,999
- 78$20,000 to $29,999
- 59$30,000 to $39,999
- 89$40,000 to $49,999
- 69$50,000 to $59,999
- 180$60,000 to $74,999
- 133$75,000 to $99,999
- 105$100,000 to $124,999
- 279$150,000 to $199,999
- 14$200,000 or more
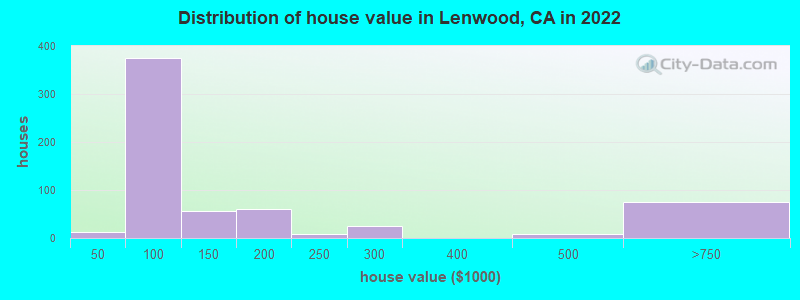
Home value of owner - occupied houses in 2022 in Lenwood, CA
-
- 11$20,000 to $24,999
- 6$50,000 to $59,999
- 6$60,000 to $69,999
- 40$70,000 to $79,999
- 274$80,000 to $89,999
- 45$90,000 to $99,999
- 40$100,000 to $124,999
- 16$125,000 to $149,999
- 59$150,000 to $174,999
- 8$200,000 to $249,999
- 25$250,000 to $299,999
- 8$400,000 to $499,999
- 73$500,000 to $749,999
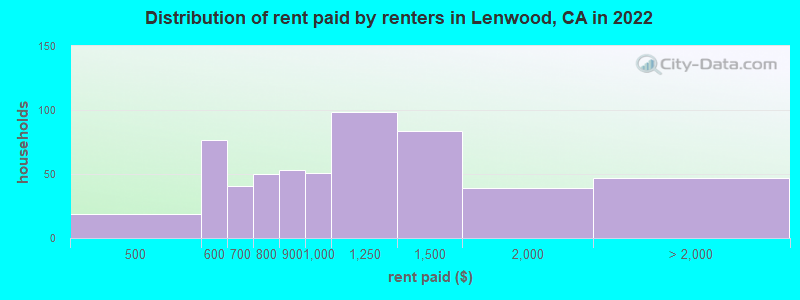
Rent paid by renters in 2022 in Lenwood, CA
-
- 18$400 to $449
- 51$500 to $549
- 24$550 to $599
- 14$600 to $649
- 26$650 to $699
- 27$700 to $749
- 22$750 to $799
- 53$800 to $899
- 50$900 to $999
- 98$1,000 to $1,249
- 83$1,250 to $1,499
- 39$1,500 to $1,999
- 47No cash rent
Percentage of workers working in this county: 82.6%
Number of people working at home: 66 (4.4% of all workers)
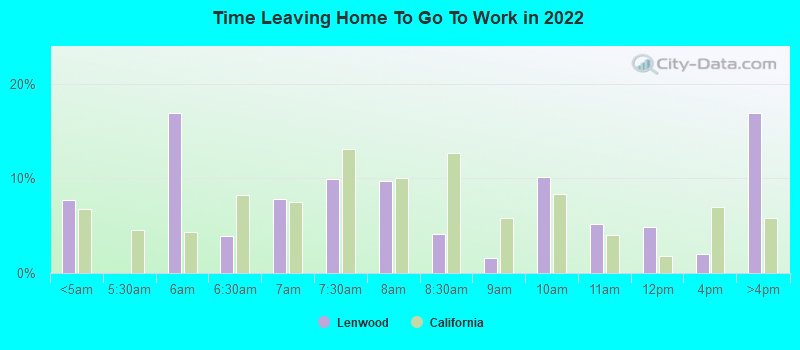
Travel time to work (commute)
- Less than 5 minutes: 0
- 5 to 9 minutes: 77
- 10 to 14 minutes: 291
- 15 to 19 minutes: 467
- 20 to 24 minutes: 0
- 25 to 29 minutes: 0
- 30 to 34 minutes: 252
- 35 to 39 minutes: 0
- 40 to 44 minutes: 18
- 45 to 59 minutes: 194
- 60 to 89 minutes: 51
- 90 or more minutes: 52
Means of transportation to work:
- Drove a car alone: 901 (76.9%)
- Carpooled: 218 (18.6%)
- Bus or trolley bus: 26 (2.2%)
- Walked: 12 (1.0%)
- Worked at home: 15 (1.3%)
- Unemployment by race in 2022
- Unemployment rate for Black residents
- 67.8%Males
- Unemployment rate for two or more race residents
- 54.1%Males
- 30.9%Females
- Unemployment rate for Hispanic or Latino residents
- 1.3%Males
- 5.3%Females
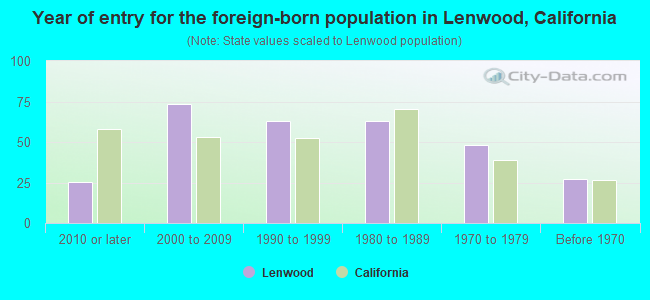
- Year of entry for the foreign-born population in Lenwood, California
- 262010 or later
- 732000 to 2009
- 631990 to 1999
- 631980 to 1989
- 481970 to 1979
- 27Before 1970
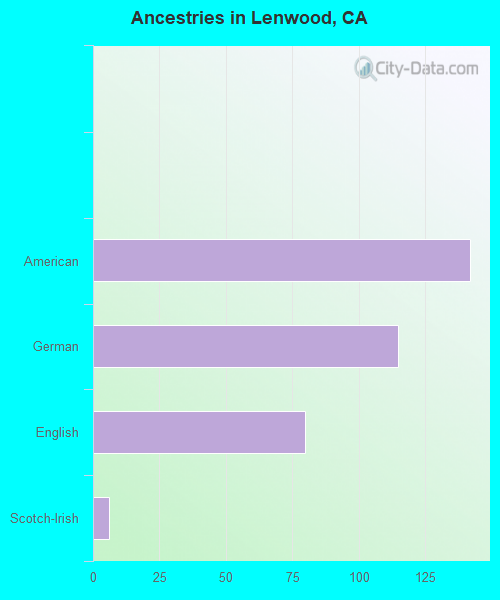
First ancestries reported:
- American: 142 (5.1%)
- German: 115 (4.2%)
- English: 80 (2.9%)
- Scotch-Irish: 6 (0.2%)
Most common places of birth for foreign-born residents (%):
| Lenwood: | 84.0% (200) |
| California: | 37.2% (3,881,193) |
| Lenwood: | 10.5% (25) |
| California: | 0.2% (18,366) |
| Lenwood: | 5.9% (14) |
| California: | 0.7% (73,304) |
Place of birth for U.S.-born residents:
- This state: 2,875
- Other state: 605
- Northeast: 0
- Midwest: 64
- South: 260
- West: 248
96.5% of Lenwood residents lived in the same house 1 years ago.
Out of people who lived in different houses, 28.7% lived in this county.
Out of people who lived in different counties, 100.0% lived in California.
| Lenwood: | 96.5% |
| State average: | 88.9% |
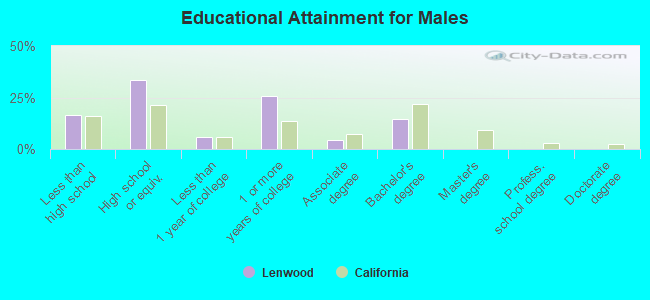
Education attainment for males 25 years and older:
- No schooling: 0
- Nursery to 4th grade: 22
- 5th and 6th grade: 0
- 7th and 8th grade: 16
- 9th grade: 0
- 10th grade: 7
- 11th grade: 61
- 12th grade, no diploma: 69
- High school graduate (or equivalency): 351
- Less than 1 year of college: 59
- Some college more than 1 year, no degree: 268
- Associate degree: 45
- Bachelor's degree: 152
- Master's degree: 0
- Professional school degree: 0
- Doctorate degree: 0
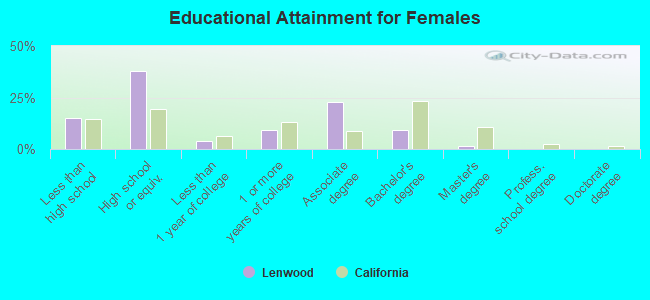
Education attainment for females 25 years and older:
- No schooling: 21
- Nursery to 4th grade: 35
- 5th and 6th grade: 0
- 7th and 8th grade: 22
- 9th grade: 0
- 10th grade: 97
- 11th grade: 9
- 12th grade, no diploma: 14
- High school graduate (or equivalency): 494
- Less than 1 year of college: 48
- Some college more than 1 year, no degree: 123
- Associate degree: 300
- Bachelor's degree: 122
- Master's degree: 17
- Professional school degree: 0
- Doctorate degree: 0


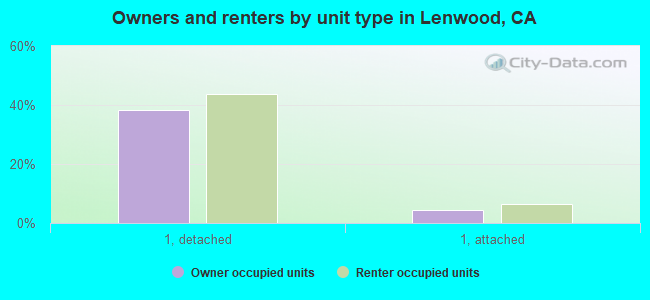
Housing units in structures:
- One, detached: 1,149
- One, attached: 41
- Two: 102
- 3 or 4: 46
- Mobile homes: 6
Housing units lacking complete kitchen facilities in 2022: 3.8%
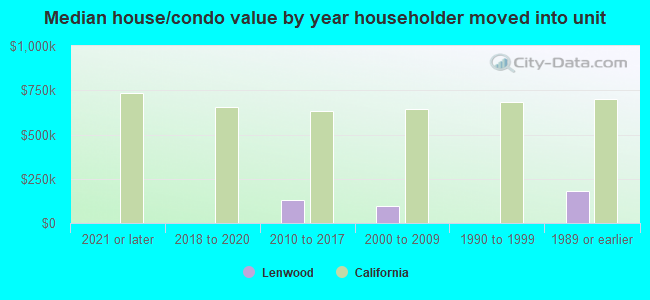
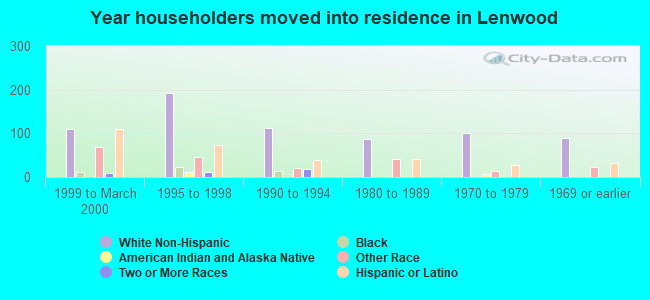
House/condo owner moved in on average 21 years ago
Renter moved in on average 6 years ago
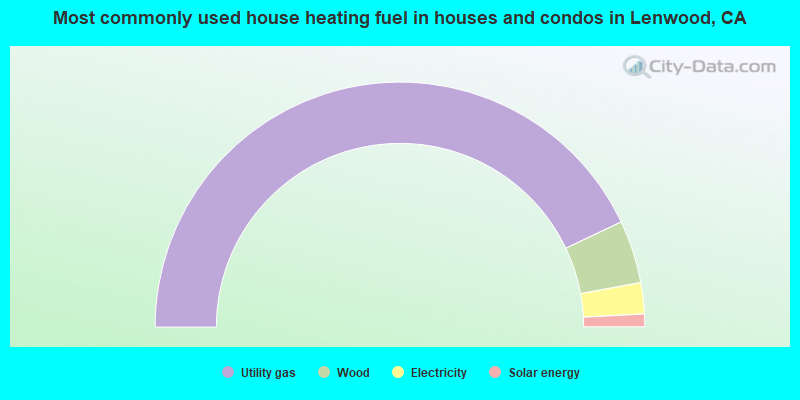
- 85.9%Utility gas
- 8.3%Wood
- 4.1%Electricity
- 1.7%Solar energy
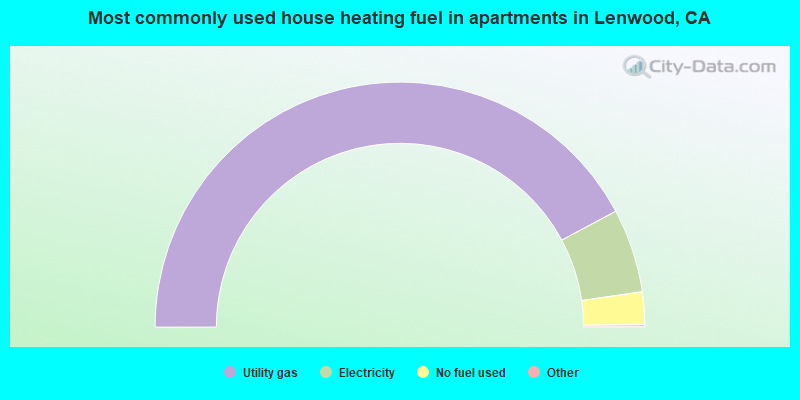
- 84.6%Utility gas
- 11.1%Electricity
- 4.3%No fuel used
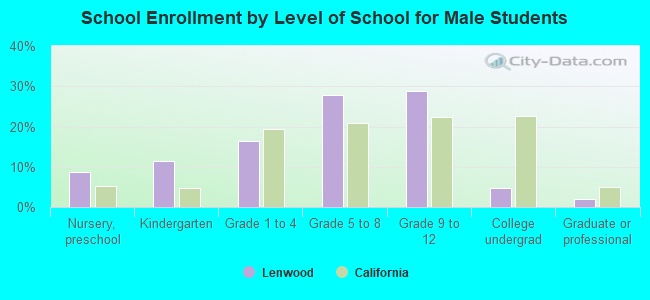
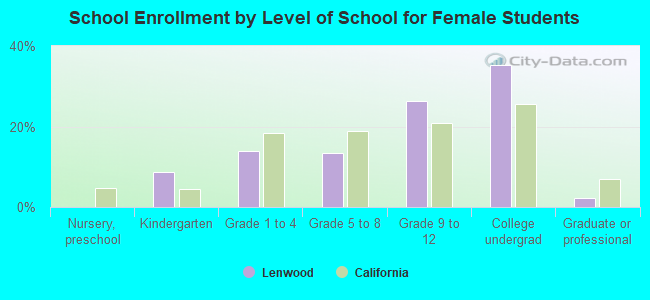
Private vs. public school enrollment:
| Here: | 0.0% |
| California: | 10.5% |
| Here: | 0.0% |
| California: | 8.5% |
| Here: | 22.5% |
| California: | 15.9% |