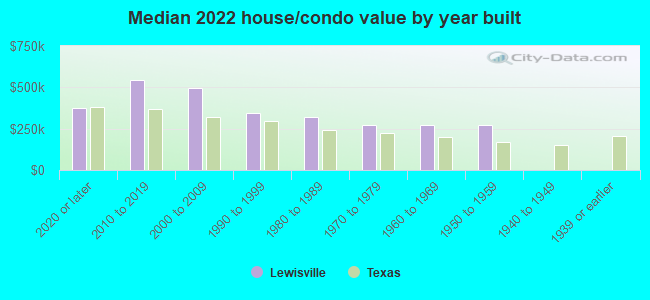
Lewisville, TX (Texas) Houses and Residents
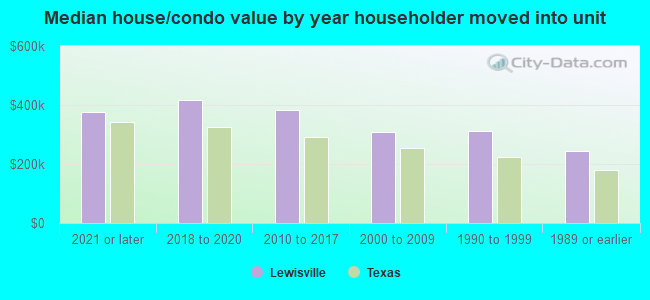
| Lewisville: | $358,700 |
| Texas: | $275,400 |
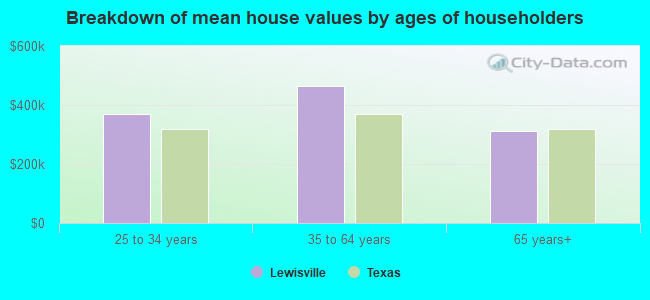
Mean price in 2022:
Detached houses: $439,563
Here: $439,563 State: $369,058 Townhouses or other attached units: $372,703
Here: $372,703 State: $327,631 In 5-or-more-unit structures: $337,043
Here: $337,043 State: $413,944 Mobile homes: $67,685
Here: $67,685 State: $124,413
Total population: 102,889 (Urban population: 77,143, Rural population: 371 (all nonfarm))
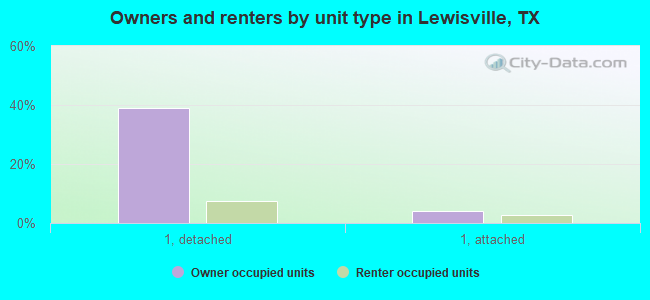
Houses: 56,287 (53,915 occupied: 23,958 owner occupied, 29,957 renter occupied)
| % of renters here: | 56% |
| State: | 38% |
Housing density: 1,530 houses/condos per square mile
Median price asked for vacant for-sale houses and condos in 2022: $230,994.
Median contract rent in 2022: $1,440 (lower quartile is $1,182, upper quartile is $1,782)
Median rent asked for vacant for-rent units in 2022: $1,397
Median gross rent in Lewisville, TX in 2022: $1,580
Housing units in Lewisville with a mortgage: 16,165 (932 second mortgage, 114 home equity loan, 688 both second mortgage and home equity loan)
Houses without a mortgage: 240
Median household income for houses/condos with a mortgage: $124,428
Median household income for apartments without a mortgage: $108,791
Median monthly housing costs: $1,664
Compare current foreclosures in Lewisville, TX:
| Photo | Address | Area | Beds / Baths | Price | Details |
|---|---|---|---|---|---|

|
#1
Chinaberry Dr
Lewisville, TX 75077
|
1,647 sq. feet
|
2 baths 3 beds |
show details | |

|
#2
Madison Cir
Lewisville, TX 75067
|
2,011 sq. feet
|
2 baths 3 beds |
show details | |

|
#3
Sienna Trl
Lewisville, TX 75067
|
1,849 sq. feet
|
2 baths 3 beds |
show details | |

|
#4
Willowridge Cir
Lewisville, TX 75067
|
2,292 sq. feet
|
2 baths 4 beds |
show details | |

|
#5
Sam Dennis Dr
Lewisville, TX 75077
|
2,654 sq. feet
|
2 baths 4 beds |
show details | |

|
#6
Big Bend Dr
Lewisville, TX 75077
|
1,598 sq. feet
|
2 baths 3 beds |
show details | |

|
#7
Iris Ln
Lewisville, TX 75067
|
1,524 sq. feet
|
2 baths 3 beds |
show details | |

|
#8
Idlewild Ct
Lewisville, TX 75077
|
3,748 sq. feet
|
3 baths 5 beds |
show details | |

|
#9
Logan Dr
Lewisville, TX 75077
|
4,069 sq. feet
|
3 baths 5 beds |
show details | |

|
#10
Waterford Dr
Lewisville, TX 75077
|
1,965 sq. feet
|
2 baths 3 beds |
show details |
| Photo | Address | Area | Beds / Baths | Price | Details |
|---|---|---|---|---|---|

|
#11
Deer Run
Lewisville, TX 75067
|
3,002 sq. feet
|
2 baths 3 beds |
show details | |

|
#12
Desiree Ln
Lewisville, TX 75077
|
2,565 sq. feet
|
2 baths 3 beds |
show details | |

|
#13
Dogwood Trl
Lewisville, TX 75067
|
1,844 sq. feet
|
2 baths 3 beds |
show details | |

|
#14
Valley Oaks Dr
Lewisville, TX 75067
|
1,936 sq. feet
|
2 baths 4 beds |
show details | |

|
#15
Jasmine Dr
Lewisville, TX 75077
|
1,625 sq. feet
|
2 baths 3 beds |
show details | |

|
#16
Christopher Ln
Lewisville, TX 75077
|
2,452 sq. feet
|
2 baths 4 beds |
show details | |

|
#17
Hamilton St
Lewisville, TX 75067
|
1,765 sq. feet
|
2 baths 2 beds |
show details | |

|
#18
Tucson Dr
Lewisville, TX 75077
|
1,934 sq. feet
|
2 baths 3 beds |
show details | |

|
#19
Stover Dr
Lewisville, TX 75067
|
2,550 sq. feet
|
2 baths 3 beds |
show details | |

|
#20
Mimosa Ln
Lewisville, TX 75077
|
1,500 sq. feet
|
2 baths 3 beds |
show details |
| Photo | Address | Area | Beds / Baths | Price | Details |
|---|---|---|---|---|---|

|
#21
Vista Trail Dr
Lewisville, TX 75067
|
2,727 sq. feet
|
2 baths 5 beds |
show details | |

|
#22
Colby Dr
Lewisville, TX 75067
|
1,801 sq. feet
|
2 baths 3 beds |
show details | |

|
#23
Merriman Dr
Lewisville, TX 75077
|
2,253 sq. feet
|
2 baths 3 beds |
show details | |

|
#24
Applegate Dr
Lewisville, TX 75067
|
1,442 sq. feet
|
2 baths 3 beds |
show details | |

|
#25
S Hatcher St
Lewisville, TX 75057
|
704 sq. feet
|
2 baths 2 beds |
show details | |

|
#26
Darlington Dr
Lewisville, TX 75077
|
3,639 sq. feet
|
3 baths 5 beds |
show details | |

|
#27
Cross Timbers Dr
Lewisville, TX 75077
|
3,148 sq. feet
|
3 baths 4 beds |
show details | |

|
#28
Sweetbriar Dr
Lewisville, TX 75067
|
1,313 sq. feet
|
2 baths 3 beds |
show details | |

|
#29
Evergreen Dr
Lewisville, TX 75067
|
1,539 sq. feet
|
2 baths 3 beds |
show details | |

|
#30
Canterbury Ln
Lewisville, TX 75067
|
1,444 sq. feet
|
2 baths 3 beds |
show details |
| Photo | Address | Area | Beds / Baths | Price | Details |
|---|---|---|---|---|---|

|
#31
Winterwood Dr
Lewisville, TX 75067
|
1,482 sq. feet
|
2 baths 3 beds |
show details | |

|
#32
Park Ln
Lewisville, TX 75077
|
2,007 sq. feet
|
2 baths 3 beds |
show details | |

|
#33
Ranney Dr
Lewisville, TX 75077
|
3,094 sq. feet
|
2 baths 4 beds |
show details | |

|
#34
Yorkshire Ter
Lewisville, TX 75067
|
1,776 sq. feet
|
1 baths 3 beds |
show details | |

|
#35
Bentwood Dr
Lewisville, TX 75067
|
1,322 sq. feet
|
2 baths 3 beds |
show details | |

|
#36
Casey Trl
Lewisville, TX 75077
|
1,853 sq. feet
|
2 baths 3 beds |
show details | |

|
#37
Logan Dr
Lewisville, TX 75077
|
4,069 sq. feet
|
3 baths 5 beds |
show details | |

|
#38
Peregrine St
Lewisville, TX 75077
|
1,473 sq. feet
|
2 baths 3 beds |
show details | |

|
#39
Highland Hills Ln
Lewisville, TX 75077
|
3,025 sq. feet
|
2 baths 4 beds |
show details | |

|
#40
Elmwood Dr
Lewisville, TX 75067
|
1,266 sq. feet
|
2 baths 3 beds |
show details |
| Photo | Address | Area | Beds / Baths | Price | Details |
|---|---|---|---|---|---|

|
#41
Creekside Dr
Lewisville, TX 75067
|
1,673 sq. feet
|
2 baths 3 beds |
show details | |

|
#42
Autumn Breeze Ln
Lewisville, TX 75077
|
1,819 sq. feet
|
2 baths 3 beds |
show details | |

|
#43
Bristol Ln
Lewisville, TX 75077
|
2,068 sq. feet
|
2 baths 3 beds |
show details | |

|
#44
Castlewood Blvd
Lewisville, TX 75077
|
3,508 sq. feet
|
2 baths 4 beds |
show details | |

|
#45
Horseshoe Dr
Lewisville, TX 75077
|
1,712 sq. feet
|
2 baths 3 beds |
show details | |

|
#46
Circle Creek Dr
Lewisville, TX 75067
|
1,358 sq. feet
|
2 baths 3 beds |
show details | |

|
#47
Salem Trl
Lewisville, TX 75067
|
1,748 sq. feet
|
2 baths 3 beds |
show details | |

|
#48
Mobile Dr
Lewisville, TX 75077
|
1,895 sq. feet
|
2 baths 3 beds |
show details | |

|
#49
Mustang Dr
Lewisville, TX 75067
|
2,059 sq. feet
|
2 baths - beds |
show details | |

|
Check over 1 million property listings on Foreclosure.com!
|
browse all offers | |||

Latest news about housing in Lewisville, TX collected exclusively by city-data.com from local newspapers, TV, and radio stations


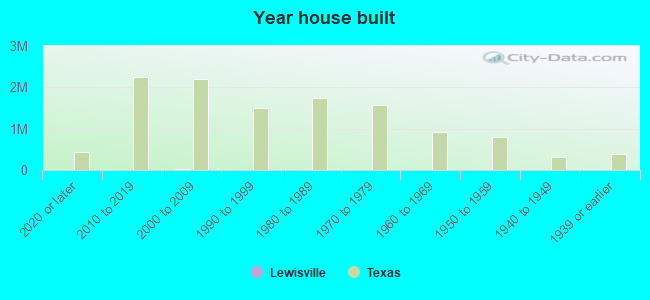
Median year apartment built: 2002
Household type by relationship:
Households: 130,933- Male householders: 24,601 (7,096 living alone), Female householders: 29,314 (11,012 living alone)
21,663 spouses (21,253 opposite-sex spouses), 5,206 unmarried partners, (5,167 opposite-sex unmarried partners), 36,242 children (34,770 natural, 135 adopted, 1,337 stepchildren), 1,752 grandchildren, 1,924 brothers or sisters, 3,681 parents, 357 foster children, 2,140 other relatives, 3,542 non-relatives
- In group quarters: 511
Size of family households: 12,565 2-persons, 7,533 3-persons, 7,262 4-persons, 2,889 5-persons, 1,247 6-persons, 420 7-or-more-persons.
Size of nonfamily households: 18,108 1-person, 3,333 2-persons, 486 3-persons, 72 7-or-more-persons.
15,544 married couples with children.
12,098 single-parent households (3,991 men, 8,107 women).
66.2% of residents of Lewisville speak English at home.
19.7% of residents speak Spanish at home (57% speak English very well, 20% speak English well, 15% speak English not well, 8% don't speak English at all).
3.9% of residents speak other Indo-European language at home (79% speak English very well, 16% speak English well, 3% speak English not well, 1% don't speak English at all).
9.0% of residents speak Asian or Pacific Island language at home (55% speak English very well, 28% speak English well, 13% speak English not well, 4% don't speak English at all).
1.1% of residents speak other language at home (94% speak English very well, 6% speak English well).
Foreign born population: 27,140 (20.7%)
(51.3% of them are naturalized citizens)
| Here: | 6.4 |
| State: | 6.3 |
| Here: | 3.6 |
| State: | 4.0 |
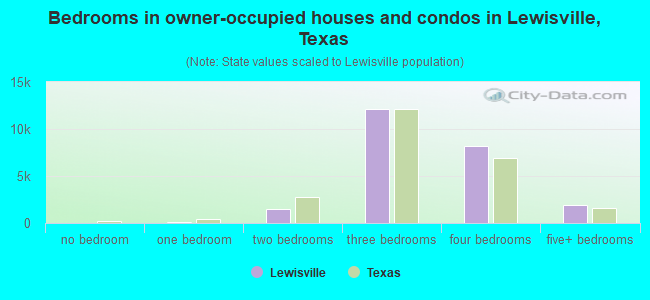
- Bedrooms in owner-occupied houses and condos in Lewisville, Texas
- 0no bedroom
- 1131 bedroom
- 1,5132 bedrooms
- 12,1573 bedrooms
- 8,2444 bedrooms
- 1,9315+ bedrooms
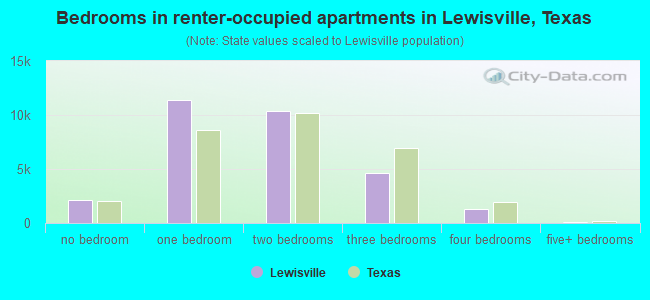
- Bedrooms in renter-occupied apartments in Lewisville, Texas
- 2,149no bedroom
- 11,4241 bedroom
- 10,3492 bedrooms
- 4,5893 bedrooms
- 1,3214 bedrooms
- 1255+ bedrooms
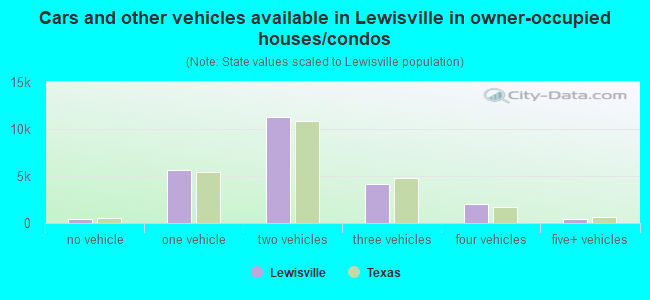
- Cars and other vehicles available in Lewisville in owner-occupied houses/condos
- 377no vehicle
- 5,6691 vehicle
- 11,3232 vehicles
- 4,1813 vehicles
- 2,0164 vehicles
- 3925+ vehicles
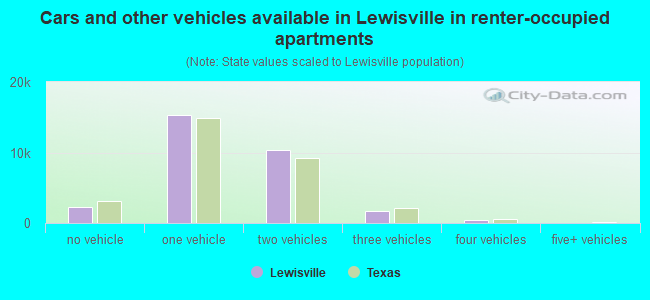
- Cars and other vehicles available in Lewisville in renter-occupied apartments
- 2,277no vehicle
- 15,2671 vehicle
- 10,3082 vehicles
- 1,7323 vehicles
- 3734 vehicles
- 05+ vehicles
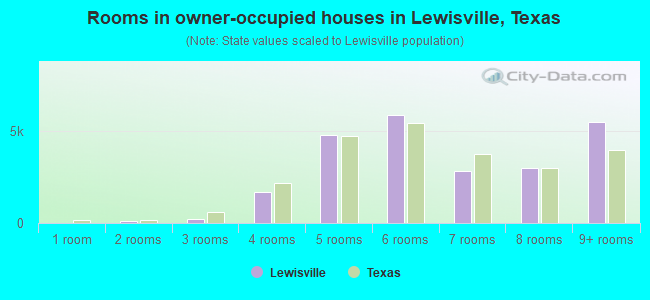
- Rooms in owner-occupied houses in Lewisville, Texas
- 01 room
- 1132 rooms
- 2093 rooms
- 1,7054 rooms
- 4,7875 rooms
- 5,8676 rooms
- 2,8127 rooms
- 2,9978 rooms
- 5,4689+ rooms
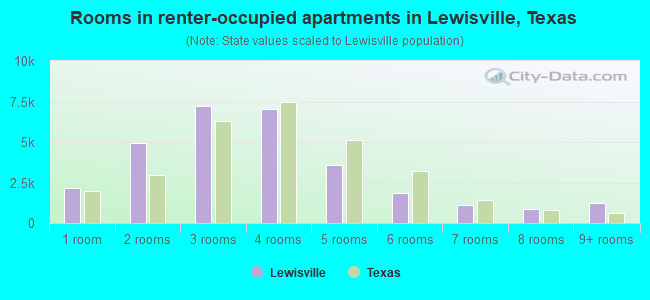
- Rooms in renter-occupied apartments in Lewisville, Texas
- 2,1491 room
- 4,9652 rooms
- 7,2463 rooms
- 7,0214 rooms
- 3,5665 rooms
- 1,8816 rooms
- 1,0837 rooms
- 8348 rooms
- 1,2129+ rooms
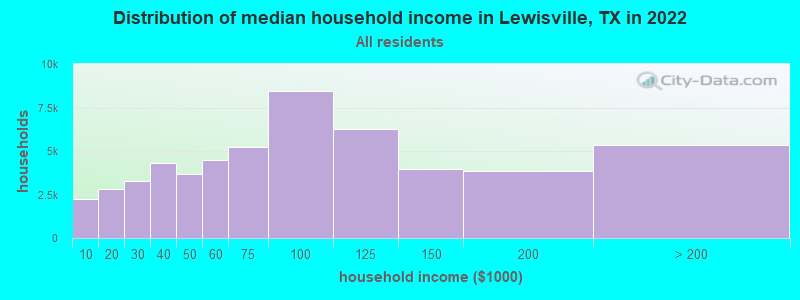
Lewisville, TX household income distribution

- 2,262Less than $10,000
- 2,797$10,000 to $19,999
- 3,250$20,000 to $29,999
- 4,329$30,000 to $39,999
- 3,666$40,000 to $49,999
- 4,490$50,000 to $59,999
- 5,225$60,000 to $74,999
- 8,439$75,000 to $99,999
- 6,290$100,000 to $124,999
- 3,938$125,000 to $149,999
- 3,856$150,000 to $199,999
- 5,373$200,000 or more
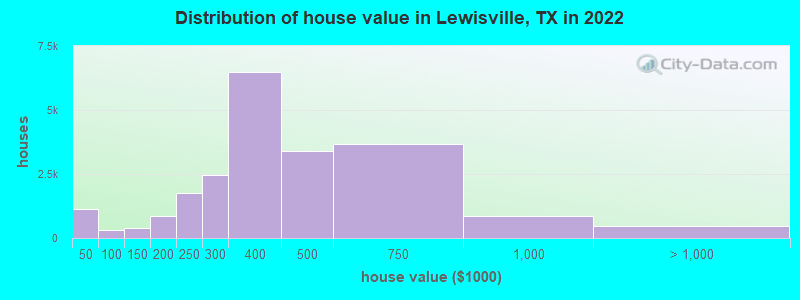
Home value of owner - occupied houses in 2022 in Lewisville, TX
-
- 191Less than $10,000
- 126$10,000 to $14,999
- 107$15,000 to $19,999
- 120$20,000 to $24,999
- 45$25,000 to $29,999
- 358$30,000 to $34,999
- 113$35,000 to $39,999
- 68$40,000 to $49,999
- 21$50,000 to $59,999
- 56$60,000 to $69,999
- 68$70,000 to $79,999
- 17$80,000 to $89,999
- 67$90,000 to $99,999
- 203$100,000 to $124,999
- 178$125,000 to $149,999
- 439$150,000 to $174,999
- 418$175,000 to $199,999
- 1,750$200,000 to $249,999
- 2,446$250,000 to $299,999
- 6,467$300,000 to $399,999
- 3,396$400,000 to $499,999
- 3,689$500,000 to $749,999
- 845$750,000 to $999,999
- 305$1,000,000 to $1,499,999
- 58$1,500,000 to $1,999,999
- 118$2,000,000 or more
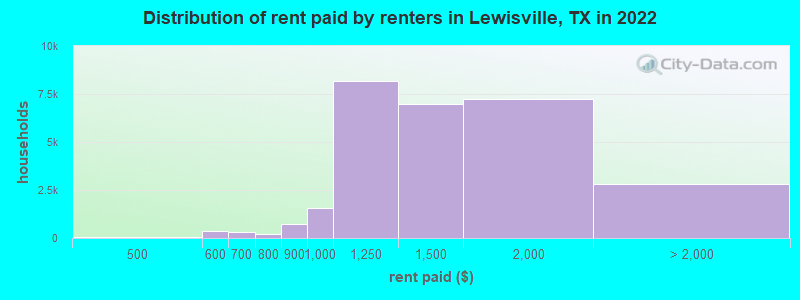
Rent paid by renters in 2022 in Lewisville, TX
-
- 17$100 to $149
- 21$150 to $199
- 54$250 to $299
- 5$300 to $349
- 13$350 to $399
- 77$450 to $499
- 43$500 to $549
- 305$550 to $599
- 211$600 to $649
- 88$650 to $699
- 79$700 to $749
- 151$750 to $799
- 719$800 to $899
- 1,580$900 to $999
- 8,155$1,000 to $1,249
- 7,004$1,250 to $1,499
- 7,238$1,500 to $1,999
- 1,637$2,000 to $2,499
- 339$2,500 to $2,999
- 294$3,000 to $3,499
- 129$3,500 or more
- 427No cash rent
Percentage of workers working in this county: 57.1%
Number of people working at home: 13,660 (18.0% of all workers)
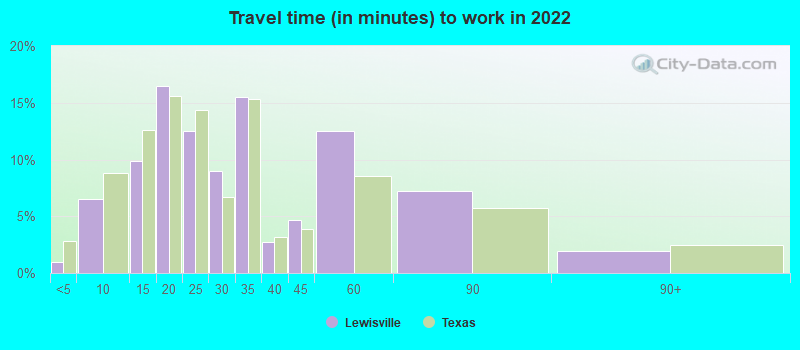
Travel time to work (commute)
- Less than 5 minutes: 1,251
- 5 to 9 minutes: 3,417
- 10 to 14 minutes: 7,621
- 15 to 19 minutes: 11,658
- 20 to 24 minutes: 10,012
- 25 to 29 minutes: 4,936
- 30 to 34 minutes: 11,585
- 35 to 39 minutes: 2,046
- 40 to 44 minutes: 2,404
- 45 to 59 minutes: 2,692
- 60 to 89 minutes: 1,850
- 90 or more minutes: 981
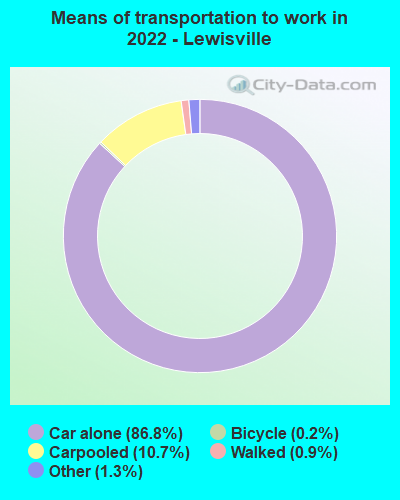
Means of transportation to work:
- Drove a car alone: 45,504 (67.8%)
- Carpooled: 4,804 (7.2%)
- Bus: 26 (0.0%)
- Long-distance train or commuter rail: 6 (0.0%)
- Light rail, streetcar or trolley: 18 (0.0%)
- Taxi: 740 (1.1%)
- Bicycle: 115 (0.2%)
- Walked: 409 (0.6%)
- Worked at home: 13,660 (20.4%)
- Unemployment by race in 2022
- Unemployment rate for White non-Hispanic residents
- 4.5%Males
- 6.3%Females
- Unemployment rate for Black residents
- 4.7%Males
- 6.5%Females
- Unemployment rate for American Indian and Alaska Native residents
- 1.8%Females
- Unemployment rate for Asian residents
- 1.5%Males
- 2.6%Females
- Unemployment rate for other race residents
- 1.0%Males
- 1.5%Females
- Unemployment rate for two or more race residents
- 1.8%Males
- 2.8%Females
- Unemployment rate for Hispanic or Latino residents
- 0.5%Males
- 4.1%Females
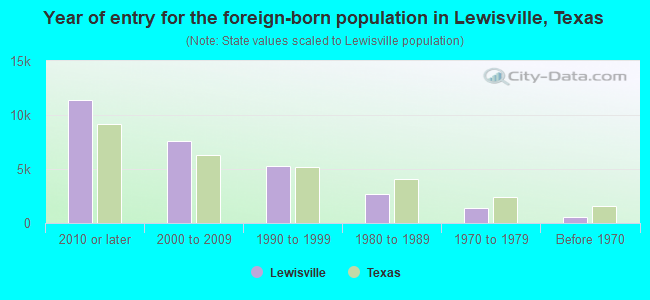
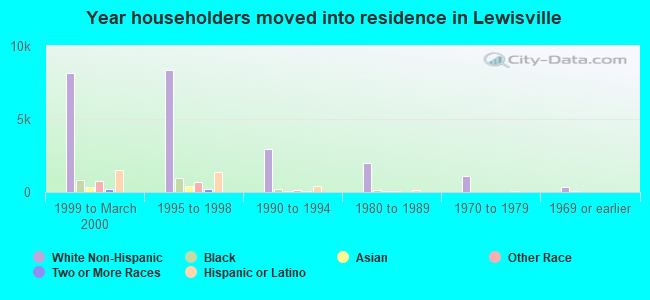
- Year of entry for the foreign-born population in Lewisville, Texas
- 11,3962010 or later
- 7,6272000 to 2009
- 5,2411990 to 1999
- 2,6551980 to 1989
- 1,3471970 to 1979
- 529Before 1970
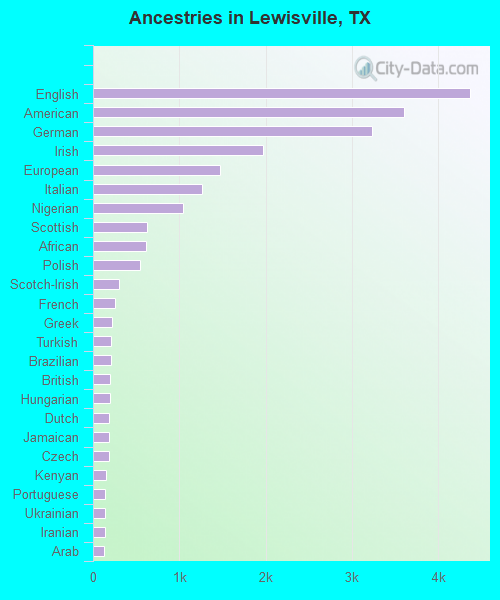
First ancestries reported:
- English: 4,371 (6.6%)
- American: 3,608 (5.4%)
- German: 3,230 (4.8%)
- Irish: 1,971 (3.0%)
- European: 1,468 (2.2%)
- Italian: 1,266 (1.9%)
- Nigerian: 1,038 (1.6%)
- Scottish: 622 (0.9%)
- African: 614 (0.9%)
- Polish: 547 (0.8%)
- Scotch-Irish: 307 (0.5%)
- French: 260 (0.4%)
- Greek: 222 (0.3%)
- Turkish: 204 (0.3%)
- Brazilian: 203 (0.3%)
- British: 198 (0.3%)
- Hungarian: 192 (0.3%)
- Dutch: 190 (0.3%)
- Jamaican: 190 (0.3%)
- Czech: 185 (0.3%)
- Kenyan: 155 (0.2%)
- Portuguese: 140 (0.2%)
- Ukrainian: 140 (0.2%)
- Iranian: 139 (0.2%)
- Arab: 131 (0.2%)
- Swedish: 125 (0.2%)
- Norwegian: 111 (0.2%)
- Northern European: 109 (0.2%)
- South African: 107 (0.2%)
- French Canadian: 80 (0.1%)
- Sudanese: 77 (0.1%)
- Canadian: 75 (0.1%)
- Welsh: 70 (0.1%)
- Danish: 68 (0.1%)
- Eastern European: 68 (0.1%)
- Scandinavian: 67 (0.1%)
- Lebanese: 63 (0.09%)
- Czechoslovakian: 56 (0.08%)
- Ghanaian: 52 (0.08%)
- West Indian: 47 (0.07%)
- Zimbabwean: 27 (0.04%)
- Armenian: 21 (0.03%)
- Russian: 21 (0.03%)
- Haitian: 21 (0.03%)
- Croatian: 15 (0.02%)
- Cajun: 14 (0.02%)
- Yugoslavian: 14 (0.02%)
- Romanian: 13 (0.02%)
- Pennsylvania German: 10 (0.02%)
- Trinidadian and Tobagonian: 10 (0.02%)
- Ethiopian: 9 (0.01%)
- Slovak: 8 (0.01%)
- Iraqi: 8 (0.01%)
- Belgian: 7 (0.01%)
- Barbadian: 7 (0.01%)
- Swiss: 7 (0.01%)
- Finnish: 7 (0.01%)
- Dutch West Indian: 4 (0.01%)
Most common places of birth for foreign-born residents (%):
| Lewisville: | 29.1% (7,911) |
| Texas: | 48.4% (2,411,723) |
| Lewisville: | 16.0% (4,363) |
| Texas: | 6.1% (306,347) |
| Lewisville: | 10.2% (2,776) |
| Texas: | 1.2% (60,172) |
| Lewisville: | 4.3% (1,183) |
| Texas: | 0.2% (12,200) |
| Lewisville: | 3.5% (958) |
| Texas: | 1.2% (62,159) |
| Lewisville: | 3.4% (929) |
| Texas: | 3.7% (184,770) |
| Lewisville: | 3.1% (849) |
| Texas: | 2.3% (115,558) |
| Lewisville: | 2.8% (756) |
| Texas: | 1.5% (72,413) |
| Lewisville: | 2.5% (673) |
| Texas: | 4.5% (224,455) |
| Lewisville: | 2.2% (595) |
| Texas: | 1.9% (96,110) |
| Lewisville: | 2.0% (534) |
| Texas: | 0.6% (27,480) |
| Lewisville: | 1.7% (475) |
| Texas: | 2.1% (103,148) |
Place of birth for U.S.-born residents:
- This state: 62,344
- Other state: 39,538
- Northeast: 5,391
- Midwest: 11,335
- South: 12,764
- West: 10,048
83.6% of Lewisville residents lived in the same house 1 years ago.
Out of people who lived in different houses, 32.2% lived in this county.
Out of people who lived in different counties, 76.8% lived in Texas.
| Lewisville: | 83.6% |
| State average: | 85.7% |
Education attainment for males 25 years and older:
- No schooling: 1,357
- Nursery to 4th grade: 276
- 5th and 6th grade: 815
- 7th and 8th grade: 230
- 9th grade: 351
- 10th grade: 364
- 11th grade: 151
- 12th grade, no diploma: 1,786
- High school graduate (or equivalency): 6,915
- Less than 1 year of college: 3,261
- Some college more than 1 year, no degree: 4,782
- Associate degree: 4,009
- Bachelor's degree: 10,893
- Master's degree: 5,370
- Professional school degree: 582
- Doctorate degree: 542

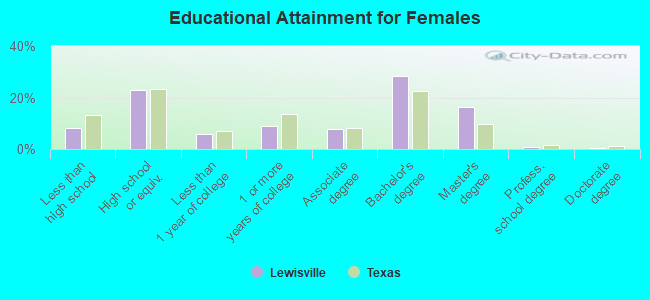
Education attainment for females 25 years and older:
- No schooling: 1,135
- Nursery to 4th grade: 289
- 5th and 6th grade: 333
- 7th and 8th grade: 491
- 9th grade: 95
- 10th grade: 0
- 11th grade: 342
- 12th grade, no diploma: 1,171
- High school graduate (or equivalency): 10,840
- Less than 1 year of college: 2,816
- Some college more than 1 year, no degree: 4,255
- Associate degree: 3,638
- Bachelor's degree: 13,366
- Master's degree: 7,604
- Professional school degree: 401
- Doctorate degree: 248
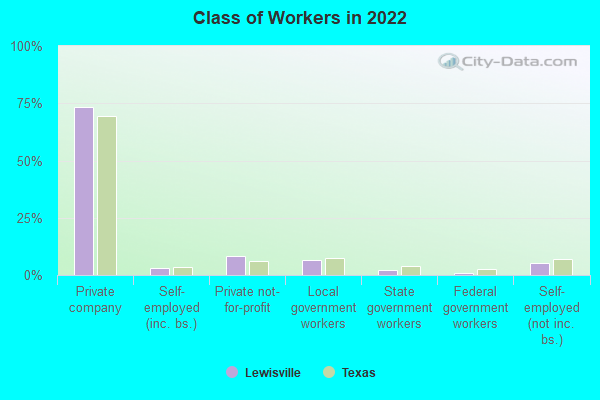
Housing units in structures:
- One, detached: 25,463
- One, attached: 3,615
- Two: 870
- 3 or 4: 3,589
- 5 to 9: 3,479
- 10 to 19: 6,754
- 20 to 49: 6,015
- 50 or more: 5,916
- Mobile homes: 586
Median worth of mobile homes: $48,030
Housing units lacking complete kitchen facilities in 2022: 1.2%
House/condo owner moved in on average 10 years ago
Renter moved in on average 1 years ago
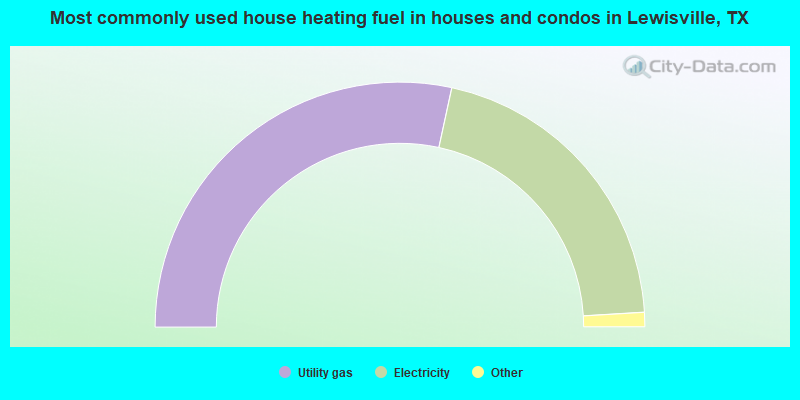
- 56.8%Utility gas
- 41.3%Electricity
- 1.5%Bottled, tank, or LP gas
- 0.2%Wood
- 0.1%No fuel used
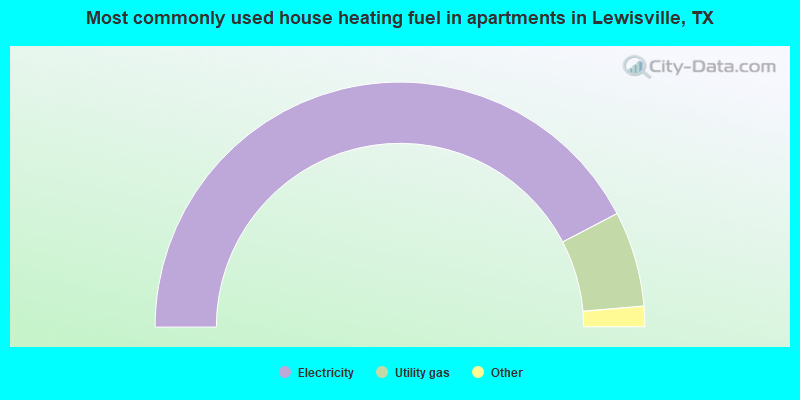
- 84.7%Electricity
- 12.6%Utility gas
- 1.3%No fuel used
- 0.8%Bottled, tank, or LP gas
- 0.3%Solar energy
- 0.2%Fuel oil, kerosene, etc.
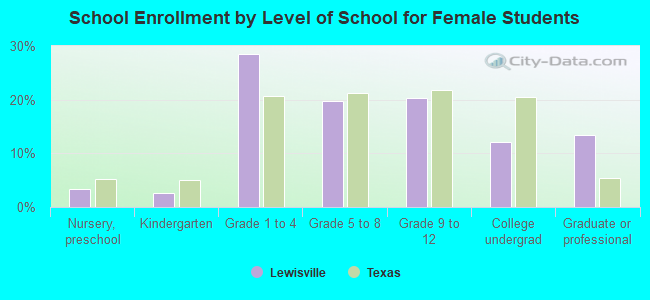
Private vs. public school enrollment:
| Here: | 5.5% |
| Texas: | 8.8% |
| Here: | 6.1% |
| Texas: | 8.0% |
| Here: | 14.1% |
| Texas: | 16.2% |