Median price asked for vacant for-sale houses and condos in 2022 in this county: $804,977.
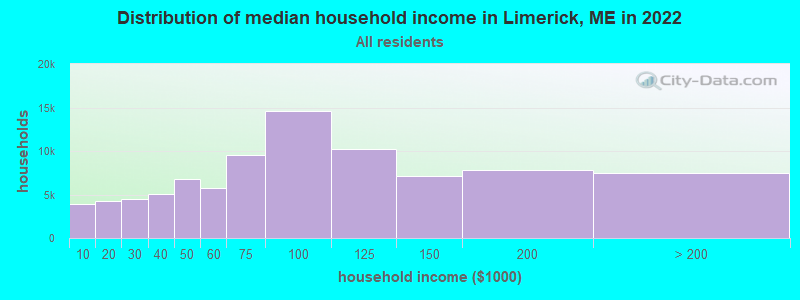
Median contract rent in 2022: $998 (lower quartile is $714, upper quartile is $1,452)
Median rent asked for vacant for-rent units in 2022: $889
Median gross rent in Limerick, ME in 2022: $1,240
Housing units in Limerick with a mortgage: 391 (38 second mortgage, 65 home equity loan, 0 both second mortgage and home equity loan) Houses without a mortgage: 141
In family households: 158,401 (37,082 male householders, 16,054 female householders)
41,663 spouses, 51,134 children (47,171 natural, 1,394 adopted, 2,569 stepchildren), 2,600 grandchildren, 991 brothers or sisters, 1,507 parents, foster children, 1,229 other relatives, 5,058 non-relatives
In nonfamily households: 35,625 (12,712 male householders (9,103 living alone)), 15,161 female householders (12,327 living alone)), 7,752 nonrelatives
In group quarters: 3,105 (1,264 institutionalized population)
33,005 married couples with children.
10,140 single-parent households (2,552 men, 7,588 women).
95.8% of residents of Limerick speak English at home.
0.5% of residents speak Spanish at home (100% speak English very well).
3.7% of residents speak other Indo-European language at home (64% speak English very well, 26% speak English well, 9% speak English not well).
0.1% of residents speak other language at home (100% speak English well).
Foreign born population: 94 (3.6%)
(74.5% of them are naturalized citizens)
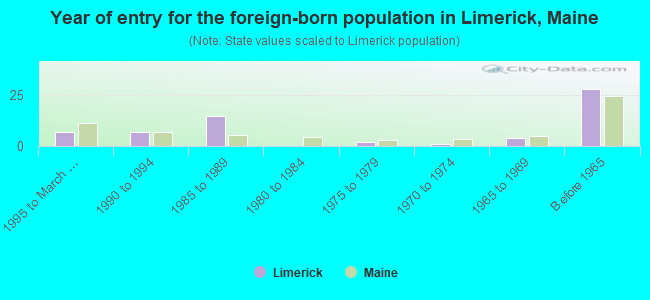
Year of entry for the foreign-born population in Limerick, Maine
71995 to March 2000
71990 to 1994
151985 to 1989
01980 to 1984
21975 to 1979
11970 to 1974
41965 to 1969
28Before 1965
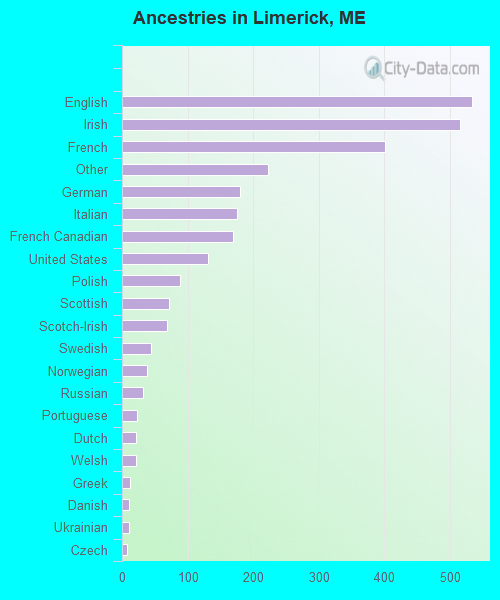
First ancestries reported:
English: 533 (19.1%)
Irish: 515 (18.5%)
French: 401 (14.4%)
Other: 223 (8.0%)
German: 180 (6.5%)
Italian: 176 (6.3%)
French Canadian: 170 (6.1%)
United States: 131 (4.7%)
Polish: 89 (3.2%)
Scottish: 71 (2.5%)
Scotch-Irish: 68 (2.4%)
Swedish: 44 (1.6%)
Norwegian: 38 (1.4%)
Russian: 32 (1.1%)
Portuguese: 23 (0.8%)
Dutch: 21 (0.8%)
Welsh: 21 (0.8%)
Greek: 12 (0.4%)
Danish: 11 (0.4%)
Ukrainian: 10 (0.4%)
Czech: 7 (0.3%)
Hungarian: 4 (0.1%)
West Indian: 3 (0.1%)
Lithuanian: 2 (0.07%)
Most common places of birth for foreign-born residents (%):
Canada
Limerick:
39.1% (25)
Maine:
41.4% (15,199)
United Kingdom
Limerick:
12.5% (8)
Maine:
7.8% (2,856)
Poland
Limerick:
12.5% (8)
Maine:
1.2% (422)
France
Limerick:
7.8% (5)
Maine:
1.2% (447)
Portugal
Limerick:
4.7% (3)
Maine:
0.5% (177)
India
Limerick:
4.7% (3)
Maine:
1.6% (590)
El Salvador
Limerick:
4.7% (3)
Maine:
0.5% (178)
Italy
Limerick:
3.1% (2)
Maine:
1.1% (412)
Romania
Limerick:
3.1% (2)
Maine:
0.4% (140)
Russia
Limerick:
3.1% (2)
Maine:
1.5% (551)
Other Eastern Europe
Limerick:
3.1% (2)
Maine:
1.6% (601)
Place of birth for U.S.-born residents:
This state: 1,368
Other state: 781
Northeast: 585
Midwest: 34
South: 100
West: 62
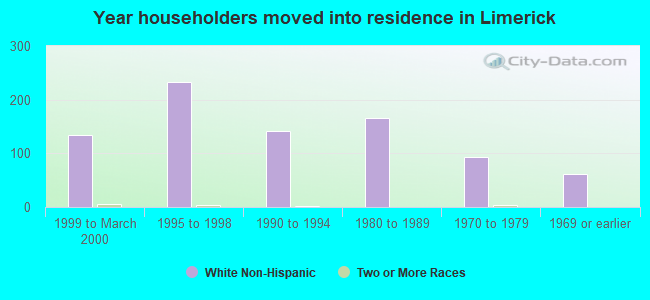
58% of Limerick residents lived in the same house 5 years ago. Out of people who lived in different houses, 44% lived in this county. Out of people who lived in different counties, 51% lived in Maine.
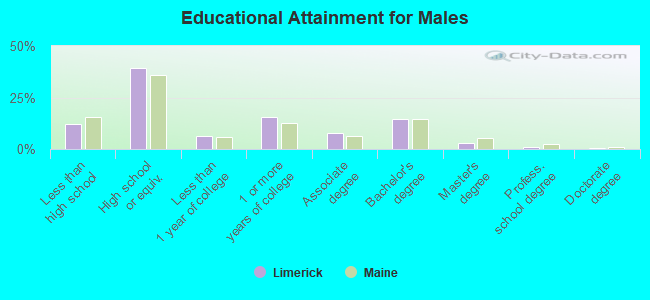
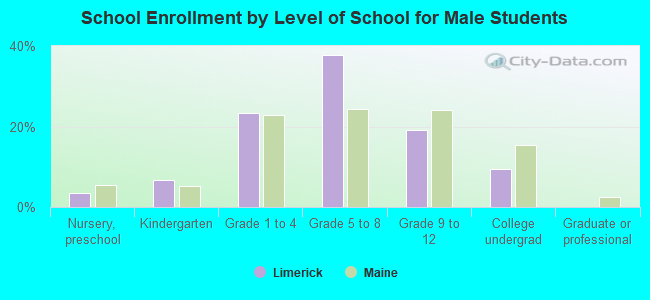
Education attainment for males 25 years and older:
No schooling: 2
Nursery to 4th grade: 5
5th and 6th grade: 0
7th and 8th grade: 20
9th grade: 7
10th grade: 20
11th grade: 14
12th grade, no diploma: 22
High school graduate (or equivalency): 288
Less than 1 year of college: 45
Some college more than 1 year, no degree: 113
Associate degree: 56
Bachelor's degree: 108
Master's degree: 21
Professional school degree: 8
Doctorate degree: 3
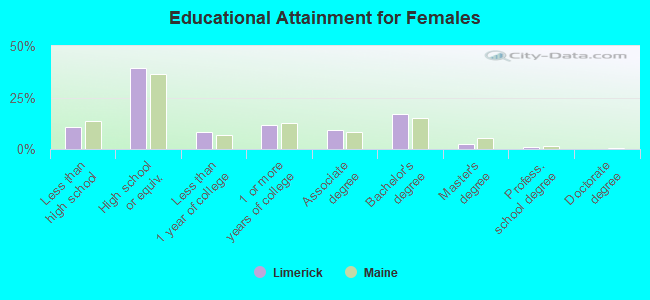
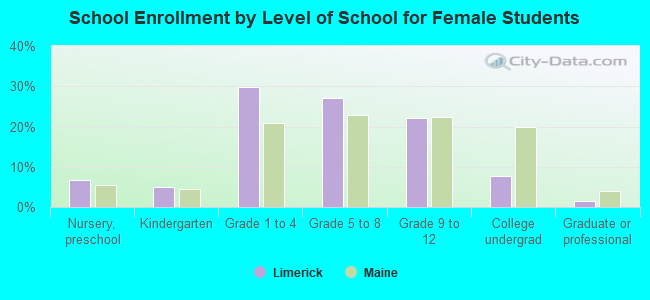
Education attainment for females 25 years and older:
No schooling: 6
Nursery to 4th grade: 0
5th and 6th grade: 5
7th and 8th grade: 23
9th grade: 6
10th grade: 20
11th grade: 13
12th grade, no diploma: 9
High school graduate (or equivalency): 295
Less than 1 year of college: 63
Some college more than 1 year, no degree: 88
Associate degree: 69
Bachelor's degree: 127
Master's degree: 20
Professional school degree: 8
Doctorate degree: 0
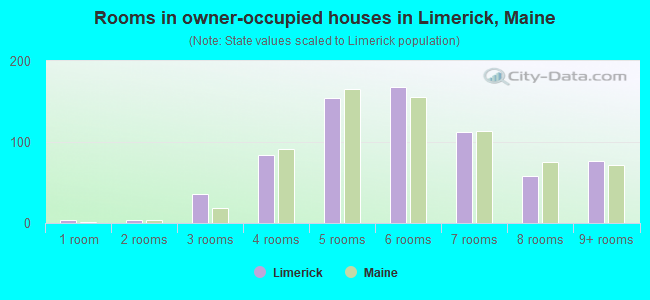
Housing units in structures:
One, detached: 1,105
One, attached: 23
Two: 31
3 or 4: 27
5 to 9: 10
10 to 19: 2
50 or more: 1
Mobile homes: 67
Boats, RVs, vans, etc.: 13
Median worth of mobile homes: $70,021
Housing units lacking complete plumbing facilities: 7.0%
Housing units lacking complete kitchen facilities: 5.6%