Livonia, MI (Michigan) Houses and Residents
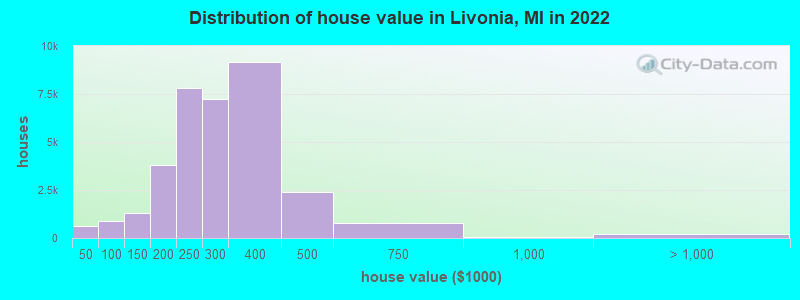
Estimated median house or condo value in 2022: $269,000 (it was $160,400 in 2000 )
Livonia:
$269,000Michigan:
$224,400
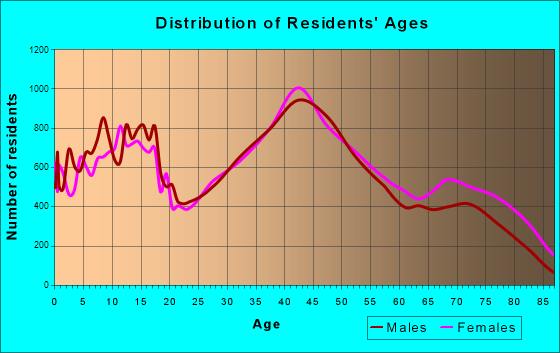
Lower value quartile - upper value quartile: $213,000 - $344,400Total population: 94,958 (All urban)
Houses: 40,431 (39,170 occupied: 34,255 owner occupied, 4,915 renter occupied )
% of renters here:
13%State:
27%
Housing density: 1,132 houses/condos per square mile
Median price asked for vacant for-sale houses and condos in 2022: $433,257.
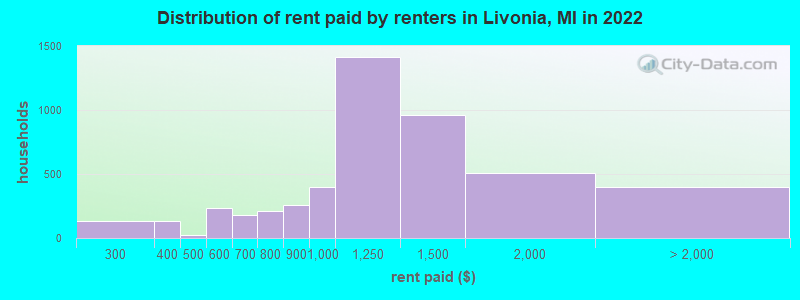
Median contract rent in 2022: $1,028 (lower quartile is $648, upper quartile is $1,213)
Median rent asked for vacant for-rent units in 2022: $1,644
Median gross rent in Livonia, MI in 2022: $1,134
Housing units in Livonia with a mortgage: 20,836 (2,036 second mortgage, 0 home equity loan, 1,932 both second mortgage and home equity loan )Houses without a mortgage: 898
Median household income for houses/condos with a mortgage: $103,951
Median household income for apartments without a mortgage: $89,119
Median monthly housing costs: $1,159
Data:
Median house or condo value ($)
Median house or condo value ($ change since 2000)
Median house or condo value ($) - White
Median house or condo value ($) - Black or African American
Median house or condo value ($) - Asian
Median house or condo value ($) - Hispanic or Latino
Median house or condo value ($) - American Indian and Alaska Native
Median house or condo value ($) - Multirace
Median house or condo value ($) - Other Race
Median price asked for mobile homes ($)
Household density (households per square mile)
Mean house or condo value by units in structure - 1, detached ($)
Mean house or condo value by units in structure - 1, attached ($)
Mean house or condo value by units in structure - 2 ($)
Mean house or condo value by units in structure by units in structure - 3 or 4 ($)
Mean house or condo value by units in structure - 5 or more ($)
Mean house or condo value by units in structure - Boat, RV, van, etc. ($)
Mean house or condo value by units in structure - Mobile home ($)
Median contract rent ($)
Median contract rent - Lower quartile ($)
Median contract rent - Upper quartile ($)
Median gross rent ($)
Urban houses (%)
Rural houses (%)
Houses occupied (%)
Houses occupied (% change since 2000)
Houses owner occupied (%)
Houses owner occupied (% change since 2000)
Houses renter occupied (%)
Houses renter occupied (% change since 2000)
Vacant housing units - For rent (%)
Vacant housing units - For rent (% change since 2000)
Vacant housing units - For sale only (%)
Vacant housing units - For sale only (% change since 2000)
Vacant housing units - Rented or sold, not occupied (%)
Vacant housing units - Rented or sold, not occupied (% change since 2000)
Vacant housing units - For seasonal, recreational, or occasional use (%)
Vacant housing units - For seasonal, recreational, or occasional use (% change since 2000)
Vacant housing units - For migrant workers (%)
Vacant housing units - For migrant workers (% change since 2000)
Vacant housing units - Other vacant (%)
Vacant housing units - Other vacant (% change since 2000)
Median monthly housing costs ($)
Median household income for houses/condos with a mortgage ($)
Median household income for houses/condos without a mortgage ($)
Median household income ($)
Median household income ($) - White
Median household income ($) - Black or African American
Median household income ($) - Asian
Median household income ($) - Hispanic or Latino
Median household income ($) - American Indian and Alaska Native
Median household income ($) - Multirace
Median household income ($) - Other Race
Mortgage status - with mortgage (%)
Mortgage status - with second mortgage (%)
Mortgage status - with home equity loan (%)
Mortgage status - with both second mortgage and home equity loan (%)
Mortgage status - without a mortgage (%)
Median year house/condo built
Median year apartment built
Household type by relationship - Male householder living alone (%)
Household type by relationship - Male householder not living alone (%)
Household type by relationship - Female householder living alone (%)
Household type by relationship - Female householder not living alone (%)
Household type by relationship - Opposite-Sex spouse (%)
Household type by relationship - Same-Sex spouse (%)
Household type by relationship - Opposite-Sex unmarried partner (%)
Household type by relationship - Same-Sex unmarried partner (%)
Household type by relationship - In group quarters (%)
Size of family households - 2-person household (%)
Size of family households - 3-person household (%)
Size of family households - 4-person household (%)
Size of family households - 5-person household (%)
Size of family households - 6-person household (%)
Size of family households - 7-or-more-person household (%)
Size of nonfamily households - 1-person household (%)
Size of nonfamily households - 2-person household (%)
Size of nonfamily households - 3-person household (%)
Size of nonfamily households - 4-person household (%)
Size of nonfamily households - 5-person household (%)
Size of nonfamily households - 6-person household (%)
Size of nonfamily households - 7-or-moreperson household (%)
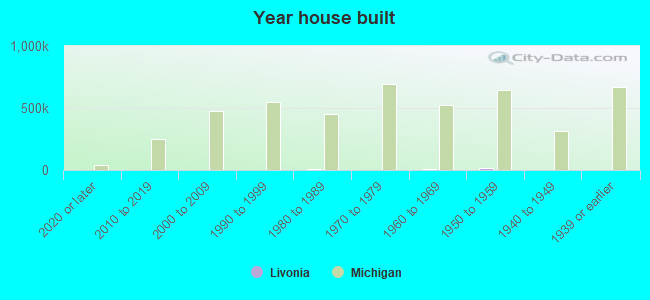
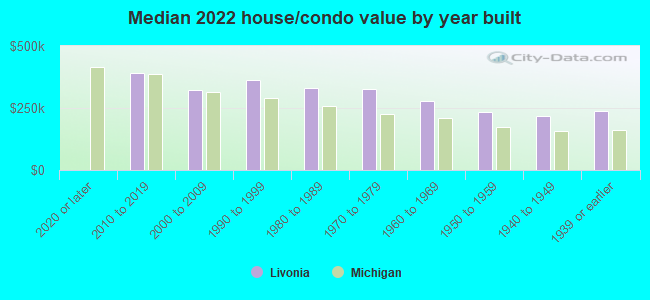
Year house built - Built 2010 or later (%)
Year house built - Built 2000 to 2009 (%)
Year house built - Built 1990 to 1999 (%)
Year house built - Built 1980 to 1989 (%)
Year house built - Built 1970 to 1979 (%)
Year house built - Built 1960 to 1969 (%)
Year house built - Built 1950 to 1959 (%)
Year house built - Built 1940 to 1949 (%)
Year house built - Built 1939 or earlier (%)
Median number of rooms in houses and condos
Median number of rooms in apartments
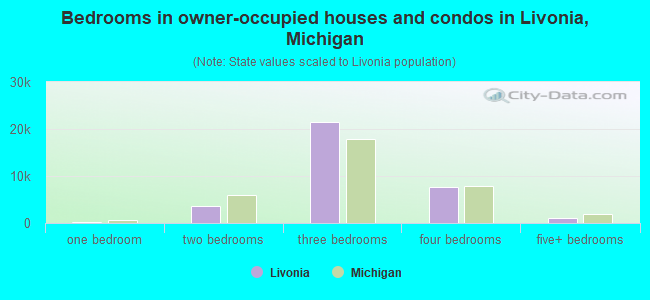
Median number of bedrooms in owner occupied houses
Mean number of bedrooms in owner occupied houses
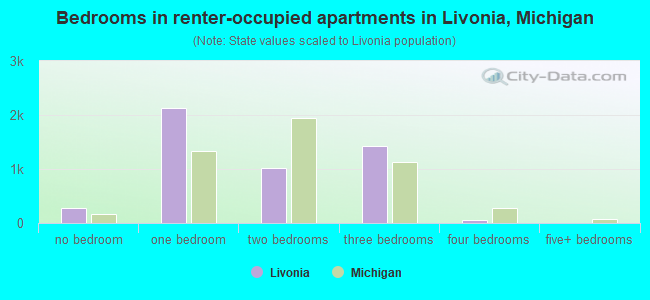
Median number of bedrooms in renter occupied houses
Mean number of bedrooms in renter occupied houses
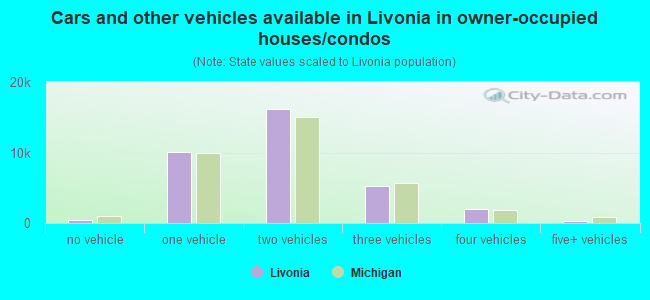
Median number of vehichles in owner occupied houses
Mean number of vehichles in owner occupied houses
Median number of vehichles in renter occupied houses
Mean number of vehichles in renter occupied houses
Rooms in owner-occupied houses - 1 room (%)
Rooms in owner-occupied houses - 2 rooms (%)
Rooms in owner-occupied houses - 3 rooms (%)
Rooms in owner-occupied houses - 4 rooms (%)
Rooms in owner-occupied houses - 5 rooms (%)
Rooms in owner-occupied houses - 6 rooms (%)
Rooms in owner-occupied houses - 7 rooms (%)
Rooms in owner-occupied houses - 8 rooms (%)
Rooms in owner-occupied houses - 9+ rooms (%)
Rooms in renter-occupied houses - 1 room (%)
Rooms in renter-occupied houses - 2 rooms (%)
Rooms in renter-occupied houses - 3 rooms (%)
Rooms in renter-occupied houses - 4 rooms (%)
Rooms in renter-occupied houses - 5 rooms (%)
Rooms in renter-occupied houses - 6 rooms (%)
Rooms in renter-occupied houses - 7 rooms (%)
Rooms in renter-occupied houses - 8 rooms (%)
Rooms in renter-occupied houses - 9+ rooms (%)
Bedrooms in owner-occupied houses - no bedrooms (%)
Bedrooms in owner-occupied houses - 1 bedroom (%)
Bedrooms in owner-occupied houses - 2 bedrooms (%)
Bedrooms in owner-occupied houses - 3 bedrooms (%)
Bedrooms in owner-occupied houses - 4 bedrooms (%)
Bedrooms in owner-occupied houses - 5+ bedrooms (%)
Bedrooms in renter-occupied houses - no bedrooms (%)
Bedrooms in renter-occupied houses - 1 bedroom (%)
Bedrooms in renter-occupied houses - 2 bedrooms (%)
Bedrooms in renter-occupied houses - 3 bedrooms (%)
Bedrooms in renter-occupied houses - 4 bedrooms (%)
Bedrooms in renter-occupied houses - 5+ bedrooms (%)
Vehicles available in owner-occupied houses - no vehicle available (%)
Vehicles available in owner-occupied houses - 1 vehicle available(%)
Vehicles available in owner-occupied houses - 2 Vehicles available (%)
Vehicles available in owner-occupied houses - 3 Vehicles available (%)
Vehicles available in owner-occupied houses - 4 Vehicles available (%)
Vehicles available in owner-occupied houses - 5+ Vehicles available (%)
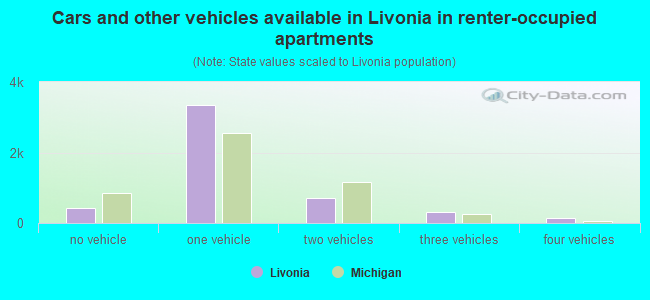
Vehicles available in renter-occupied houses - no vehicle available (%)
Vehicles available in renter-occupied houses - 1 vehicle available (%)
Vehicles available in renter-occupied houses - 2 Vehicles available (%)
Vehicles available in renter-occupied houses - 3 Vehicles available (%)
Vehicles available in renter-occupied houses - 4 Vehicles available (%)
Vehicles available in renter-occupied houses - 5+ Vehicles available (%)
Housing units in structures - 1, detached (%)
Housing units in structures - 1, attached (%)
Housing units in structures - 2 (%)
Housing units in structures - 3 or 4 (%)
Housing units in structures - 5 to 9 (%)
Housing units in structures - 10 to 19 (%)
Housing units in structures - 20 to 49 (%)
Housing units in structures - 50 or more (%)
Housing units in structures - Mobile home (%)
Housing units in structures - Boat, RV, van, etc. (%)
Housing units in structures - Owners - 1, detached (%)
Housing units in structures - Owners - 1, attached (%)
Housing units in structures - Owners - 2 (%)
Housing units in structures - Owners - 3 or 4 (%)
Housing units in structures - Owners - 5 to 9 (%)
Housing units in structures - Owners - 10 to 19 (%)
Housing units in structures - Owners - 20 to 49 (%)
Housing units in structures - Owners - 50 or more (%)
Housing units in structures - Owners - Mobile home (%)
Housing units in structures - Owners - Boat, RV, van, etc. (%)
Housing units in structures - Renters - 1, detached (%)
Housing units in structures - Renters - 1, attached (%)
Housing units in structures - Renters - 2 (%)
Housing units in structures - Renters - 3 or 4 (%)
Housing units in structures - Renters - 5 to 9 (%)
Housing units in structures - Renters - 10 to 19 (%)
Housing units in structures - Renters - 20 to 49 (%)
Housing units in structures - Renters - 50 or more (%)
Housing units in structures - Renters - Mobile home (%)
Housing units in structures - Renters - Boat, RV, van, etc. (%)
House/condo owner moved in on average (years ago)
Renter moved in on average (years ago)
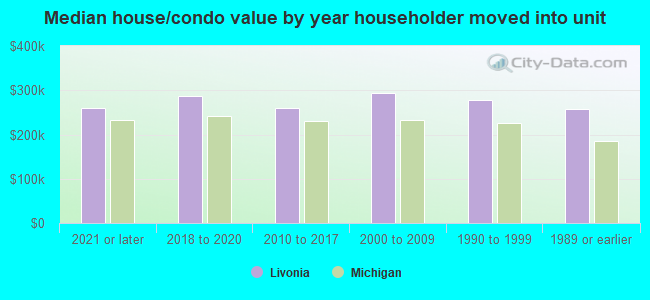
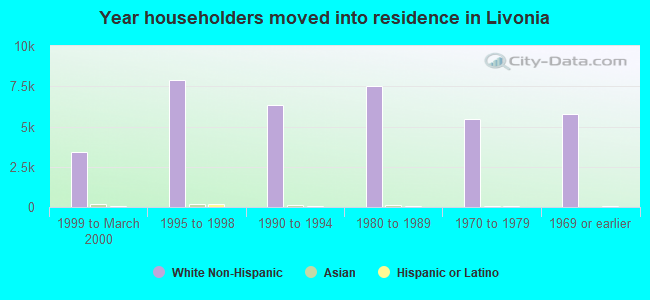
Year householder moved into unit - Moved in 1999 to March 2000 (%)
Year householder moved into unit - Moved in 1999 to March 2000 (%) - White
Year householder moved into unit - Moved in 1999 to March 2000 (%) - Black or African American
Year householder moved into unit - Moved in 1999 to March 2000 (%) - Asian
Year householder moved into unit - Moved in 1999 to March 2000 (%) - Hispanic or Latino
Year householder moved into unit - Moved in 1999 to March 2000 (%) - American Indian and Alaska Native
Year householder moved into unit - Moved in 1999 to March 2000 (%) - Multirace
Year householder moved into unit - Moved in 1999 to March 2000 (%) - Other Race
Year householder moved into unit - Moved in 1995 to 1998 (%)
Year householder moved into unit - Moved in 1995 to 1998 (%) - White
Year householder moved into unit - Moved in 1995 to 1998 (%) - Black or African American
Year householder moved into unit - Moved in 1995 to 1998 (%) - Asian
Year householder moved into unit - Moved in 1995 to 1998 (%) - Hispanic or Latino
Year householder moved into unit - Moved in 1995 to 1998 (%) - American Indian and Alaska Native
Year householder moved into unit - Moved in 1995 to 1998 (%) - Multirace
Year householder moved into unit - Moved in 1995 to 1998 (%) - Other Race
Year householder moved into unit - Moved in 1990 to 1994 (%)
Year householder moved into unit - Moved in 1990 to 1994 (%) - White
Year householder moved into unit - Moved in 1990 to 1994 (%) - Black or African American
Year householder moved into unit - Moved in 1990 to 1994 (%) - Asian
Year householder moved into unit - Moved in 1990 to 1994 (%) - Hispanic or Latino
Year householder moved into unit - Moved in 1990 to 1994 (%) - American Indian and Alaska Native
Year householder moved into unit - Moved in 1990 to 1994 (%) - Multirace
Year householder moved into unit - Moved in 1990 to 1994 (%) - Other Race
Year householder moved into unit - Moved in 1980 to 1989 (%)
Year householder moved into unit - Moved in 1980 to 1989 (%) - White
Year householder moved into unit - Moved in 1980 to 1989 (%) - Black or African American
Year householder moved into unit - Moved in 1980 to 1989 (%) - Asian
Year householder moved into unit - Moved in 1980 to 1989 (%) - Hispanic or Latino
Year householder moved into unit - Moved in 1980 to 1989 (%) - American Indian and Alaska Native
Year householder moved into unit - Moved in 1980 to 1989 (%) - Multirace
Year householder moved into unit - Moved in 1980 to 1989 (%) - Other Race
Year householder moved into unit - Moved in 1970 to 1979 (%)
Year householder moved into unit - Moved in 1970 to 1979 (%) - White
Year householder moved into unit - Moved in 1970 to 1979 (%) - Black or African American
Year householder moved into unit - Moved in 1970 to 1979 (%) - Asian
Year householder moved into unit - Moved in 1970 to 1979 (%) - Hispanic or Latino
Year householder moved into unit - Moved in 1970 to 1979 (%) - American Indian and Alaska Native
Year householder moved into unit - Moved in 1970 to 1979 (%) - Multirace
Year householder moved into unit - Moved in 1970 to 1979 (%) - Other Race
Year householder moved into unit - Moved in 1969 or earlier (%)
Year householder moved into unit - Moved in 1969 or earlier (%) - White
Year householder moved into unit - Moved in 1969 or earlier (%) - Black or African American
Year householder moved into unit - Moved in 1969 or earlier (%) - Asian
Year householder moved into unit - Moved in 1969 or earlier (%) - Hispanic or Latino
Year householder moved into unit - Moved in 1969 or earlier (%) - American Indian and Alaska Native
Year householder moved into unit - Moved in 1969 or earlier (%) - Multirace
Year householder moved into unit - Moved in 1969 or earlier (%) - Other Race
Housing units lacking complete plumbing facilities (%)
Housing units lacking complete kitchen facilities (%)
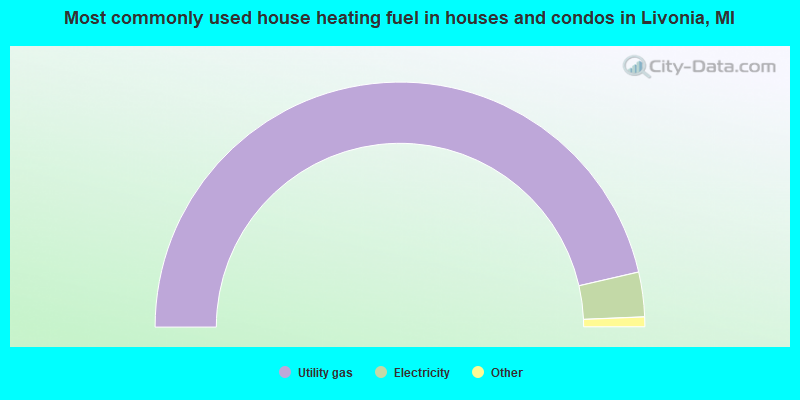
House heating fuel used in houses and condos - Utility gas (%)
House heating fuel used in houses and condos - Bottled, tank, or LP gas (%)
House heating fuel used in houses and condos - Electricity (%)
House heating fuel used in houses and condos - Fuel oil, kerosene, etc. (%)
House heating fuel used in houses and condos - Coal or coke (%)
House heating fuel used in houses and condos - Wood (%)
House heating fuel used in houses and condos - Solar energy (%)
House heating fuel used in houses and condos - Other fuel (%)
House heating fuel used in houses and condos - No fuel used (%)
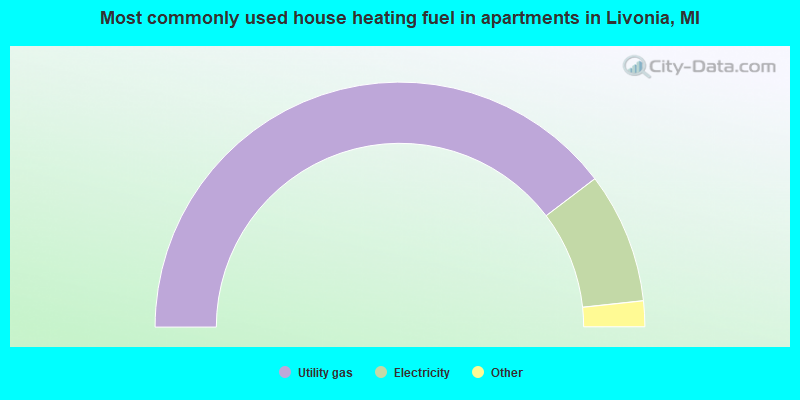
House heating fuel used in apartments - Utility gas (%)
House heating fuel used in apartments - Bottled, tank, or LP gas (%)
House heating fuel used in apartments - Electricity (%)
House heating fuel used in apartments - Fuel oil, kerosene, etc. (%)
House heating fuel used in apartments - Coal or coke (%)
House heating fuel used in apartments - Wood (%)
House heating fuel used in apartments - Solar energy (%)
House heating fuel used in apartments - Other fuel (%)
House heating fuel used in apartments - No fuel used (%)
Latest news about housing in Livonia, MI collected exclusively by city-data.com from local newspapers, TV, and radio stations
Median year house/condo built: 1963Median year apartment built: 1972Household type by relationship:
Households: 93,786
Male householders: 20,288 (6,507 living alone ), Female householders: 18,882 (5,632 living alone )19,571 spouses (19,330 opposite-sex spouses ), 2,073 unmarried partners , (2,027 opposite-sex unmarried partners ), 25,455 children (24,649 natural , 181 adopted , 625 stepchildren ), 1,473 grandchildren , 924 brothers or sisters , 1,624 parents , 0 foster children , 1,165 other relatives , 1,244 non-relatives In group quarters: 1,087
Size of family households: 13,042 2-persons , 4,895 3-persons , 5,194 4-persons , 1,491 5-persons , 462 6-persons , 205 7-or-more-persons .
Size of nonfamily households: 12,139 1-person , 1,637 2-persons , 105 3-persons .
12,867 married couples with children. single-parent households (630 men , 2,541 women ).
89.5% of residents of Livonia speak English at home. of residents speak Spanish at home (79% speak English very well , 13% speak English well , 7% speak English not well ).of residents speak other Indo-European language at home (69% speak English very well , 20% speak English well , 11% speak English not well , 1% don't speak English at all ).of residents speak Asian or Pacific Island language at home (54% speak English very well , 30% speak English well , 15% speak English not well , 1% don't speak English at all ).of residents speak other language at home (67% speak English very well , 22% speak English well , 12% speak English not well ).
Foreign born population: 7,884 (8.4%)of them are naturalized citizens )
Median number of rooms in houses and condos:
Median number of rooms in apartments
Owner-occupied Renter-occupied
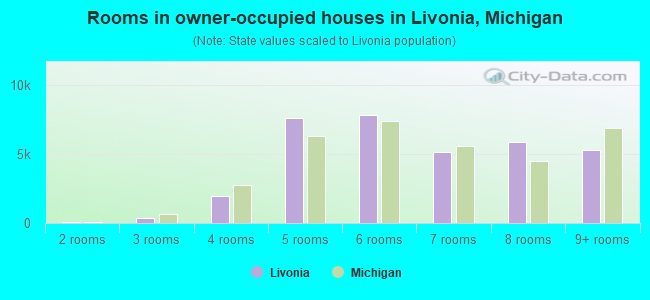
Rooms in owner-occupied houses in Livonia, Michigan
66 1 room 42 2 rooms 346 3 rooms 1,991 4 rooms 7,645 5 rooms 7,834 6 rooms 5,153 7 rooms 5,885 8 rooms 5,293 9+ rooms
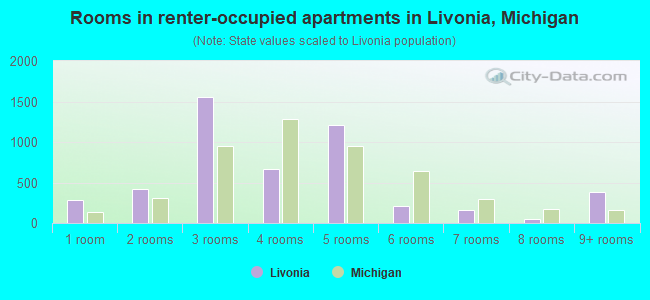
Rooms in renter-occupied apartments in Livonia, Michigan
282 1 room 415 2 rooms 1,550 3 rooms 662 4 rooms 1,211 5 rooms 206 6 rooms 163 7 rooms 45 8 rooms 381 9+ rooms
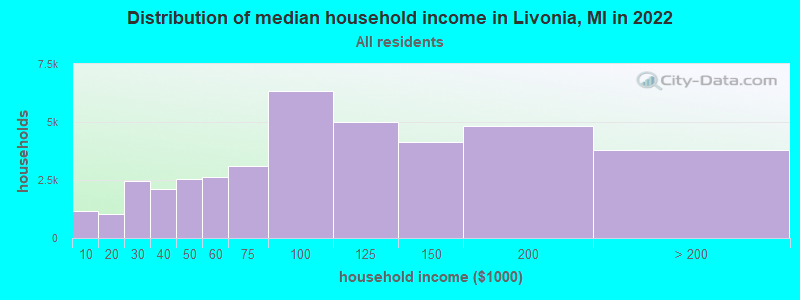
Livonia, MI household income distribution 1,175 Less than $10,0001,038 $10,000 to $19,9992,471 $20,000 to $29,9992,094 $30,000 to $39,9992,551 $40,000 to $49,9992,646 $50,000 to $59,9993,099 $60,000 to $74,9996,357 $75,000 to $99,9995,002 $100,000 to $124,9994,132 $125,000 to $149,9994,815 $150,000 to $199,9993,790 $200,000 or more
Home value of owner - occupied houses in 2022 in Livonia, MI 188 Less than $10,00027 $10,000 to $14,999100 $15,000 to $19,999133 $20,000 to $24,99990 $25,000 to $29,99948 $35,000 to $39,99944 $40,000 to $49,999166 $50,000 to $59,999111 $60,000 to $69,99933 $70,000 to $79,999289 $80,000 to $89,999224 $90,000 to $99,999757 $100,000 to $124,999540 $125,000 to $149,9991,505 $150,000 to $174,9992,275 $175,000 to $199,9997,838 $200,000 to $249,9997,255 $250,000 to $299,9999,161 $300,000 to $399,9992,387 $400,000 to $499,999803 $500,000 to $749,99951 $750,000 to $999,99941 $1,000,000 to $1,499,999144 $1,500,000 to $1,999,99945 $2,000,000 or moreRent paid by renters in 2022 in Livonia, MI 3 Less than $10010 $150 to $19986 $200 to $24949 $250 to $299107 $300 to $34926 $350 to $39917 $400 to $4495 $450 to $49992 $500 to $549144 $550 to $59986 $600 to $64990 $650 to $69970 $700 to $749138 $750 to $799258 $800 to $899395 $900 to $9991,410 $1,000 to $1,249957 $1,250 to $1,499510 $1,500 to $1,99919 $2,000 to $2,4998 $2,500 to $2,99957 $3,500 or more309 No cash rent
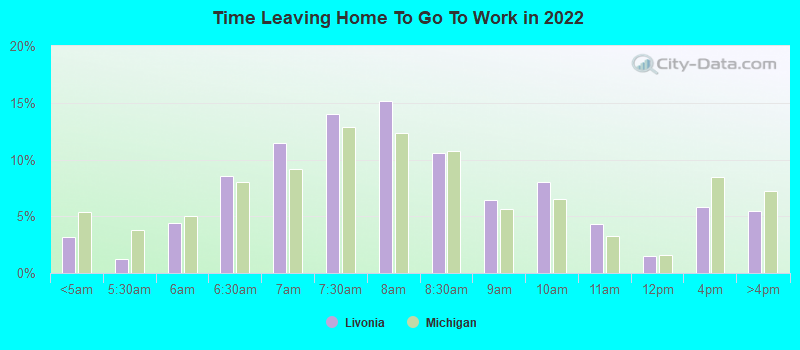
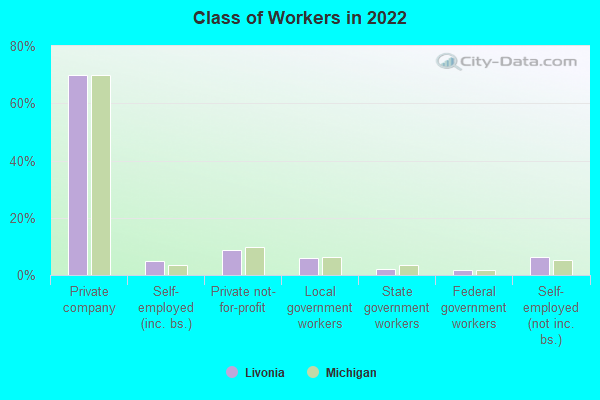
Percentage of workers working in this county: 69.6%Number of people working at home: 8,449 (17.9% of all workers )
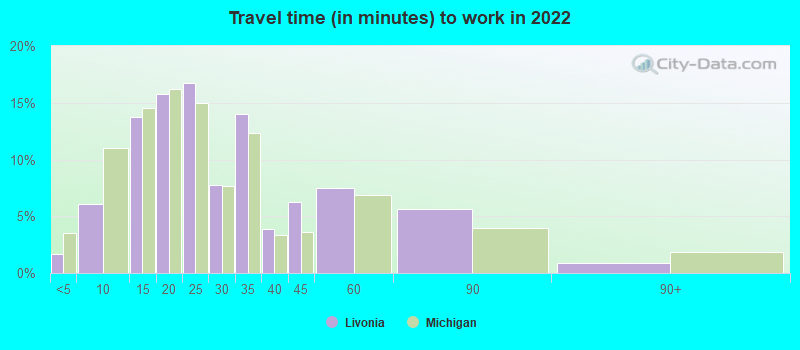
Travel time to work (commute)
Less than 5 minutes: 9045 to 9 minutes: 3,48810 to 14 minutes: 4,77815 to 19 minutes: 5,18320 to 24 minutes: 6,76925 to 29 minutes: 4,46230 to 34 minutes: 5,96235 to 39 minutes: 1,14340 to 44 minutes: 1,22145 to 59 minutes: 2,18160 to 89 minutes: 77490 or more minutes: 527
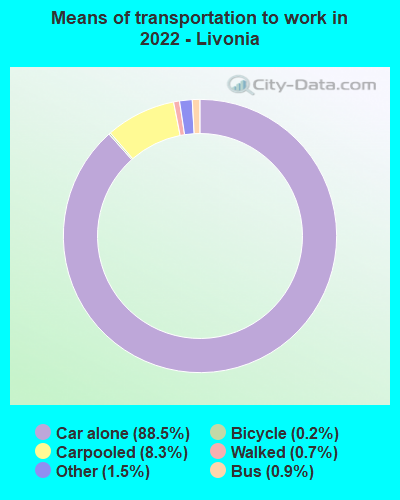
Means of transportation to work:
Drove a car alone: 61,770 (78.4%)Carpooled: 5,712 (7.2%)Bus : 506 (0.6%)Taxi: 1,158 (1.5%)Bicycle: 163 (0.2%)Walked: 485 (0.6%)Worked at home: 8,449 (10.7%)
Unemployment by race in 2022
Unemployment rate for White non-Hispanic residents 2.5% Males1.9% FemalesUnemployment rate for Black residents 3.6% Males9.9% FemalesUnemployment rate for Asian residents 0.7% Males2.6% FemalesUnemployment rate for other race residents 7.3% Males23.7% FemalesUnemployment rate for two or more race residents 10.4% Males4.0% FemalesUnemployment rate for Hispanic or Latino residents 5.6% Males6.9% Females
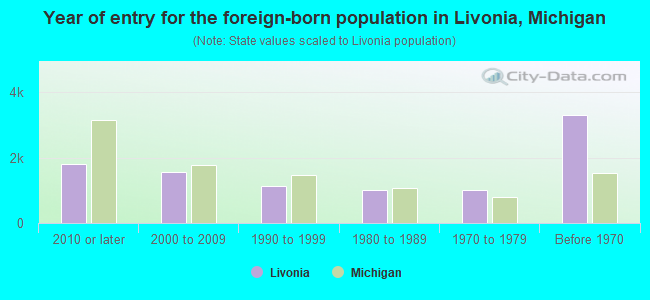
Year of entry for the foreign-born population in Livonia, Michigan
1,807 2010 or later 1,558 2000 to 2009 1,127 1990 to 1999 1,017 1980 to 1989 1,008 1970 to 1979 3,301 Before 1970
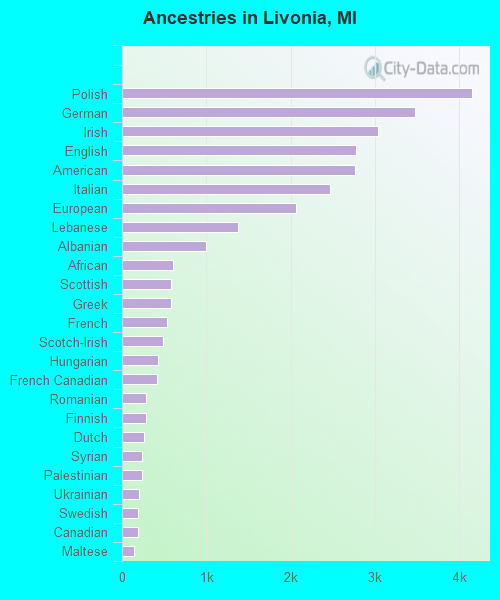
First ancestries reported:
Polish: 4,145 (10.7%)
German: 3,470 (8.9%)
Irish: 3,032 (7.8%)
English: 2,774 (7.2%)
American: 2,766 (7.1%)
Italian: 2,471 (6.4%)
European: 2,069 (5.3%)
Lebanese: 1,379 (3.6%)
Albanian: 994 (2.6%)
African: 606 (1.6%)
Scottish: 586 (1.5%)
Greek: 584 (1.5%)
French: 538 (1.4%)
Scotch-Irish: 490 (1.3%)
Hungarian: 428 (1.1%)
French Canadian: 411 (1.1%)
Romanian: 289 (0.7%)
Finnish: 283 (0.7%)
Dutch: 259 (0.7%)
Syrian: 237 (0.6%)
Palestinian: 236 (0.6%)
Ukrainian: 198 (0.5%)
Swedish: 190 (0.5%)
Canadian: 186 (0.5%)
Maltese: 138 (0.4%)
Eastern European: 131 (0.3%)
British: 116 (0.3%)
Egyptian: 113 (0.3%)
Czech: 113 (0.3%)
Norwegian: 111 (0.3%)
Armenian: 109 (0.3%)
Serbian: 108 (0.3%)
Slovak: 107 (0.3%)
Welsh: 99 (0.3%)
Arab: 98 (0.3%)
Danish: 87 (0.2%)
Lithuanian: 81 (0.2%)
Brazilian: 71 (0.2%)
Scandinavian: 66 (0.2%)
Russian: 58 (0.1%)
Portuguese: 58 (0.1%)
Moroccan: 48 (0.1%)
Jamaican: 44 (0.1%)
Assyrian: 39 (0.1%)
Macedonian: 39 (0.1%)
Iraqi: 34 (0.09%)
Croatian: 30 (0.08%)
Bulgarian: 30 (0.08%)
Yugoslavian: 28 (0.07%)
Jordanian: 27 (0.07%)
Czechoslovakian: 24 (0.06%)
Icelander: 21 (0.05%)
Afghan: 21 (0.05%)
Latvian: 21 (0.05%)
Slovene: 20 (0.05%)
Slavic: 16 (0.04%)
Ghanaian: 16 (0.04%)
Belgian: 14 (0.04%)
Northern European: 12 (0.03%)
Austrian: 11 (0.03%)
Belizean: 10 (0.03%)
Nigerian: 8 (0.02%)
New Zealander: 7 (0.02%)
Cypriot: 6 (0.02%)
Turkish: 5 (0.01%)
Iranian: 4 (0.01%)
Most common places of birth for foreign-born residents (%): India Livonia:
10.3% (790)Michigan:
11.1% (77,240)
Philippines Livonia:
8.5% (657)Michigan:
2.8% (19,112)
Lebanon Livonia:
6.9% (532)Michigan:
3.7% (25,634)
Canada Livonia:
6.0% (458)Michigan:
5.0% (35,052)
Albania Livonia:
5.2% (403)Michigan:
1.9% (12,910)
Mexico Livonia:
5.0% (382)Michigan:
10.9% (75,965)
Romania Livonia:
3.5% (270)Michigan:
1.2% (8,563)
Italy Livonia:
3.2% (249)Michigan:
1.1% (7,792)
Korea Livonia:
3.2% (243)Michigan:
3.0% (20,884)
Vietnam Livonia:
3.1% (242)Michigan:
1.8% (12,679)
China, excluding Hong Kong and Taiwan Livonia:
2.6% (203)Michigan:
4.9% (34,295)
Japan Livonia:
2.5% (192)Michigan:
1.5% (10,225)
Poland Livonia:
2.4% (184)Michigan:
1.6% (10,857)
Germany Livonia:
2.1% (160)Michigan:
2.3% (16,126)
Greece Livonia:
2.0% (155)Michigan:
0.4% (2,721)
Iraq Livonia:
1.8% (136)Michigan:
8.1% (55,954)
Syria Livonia:
1.5% (118)Michigan:
0.9% (5,978)
Jordan Livonia:
1.5% (118)Michigan:
0.7% (4,939)
Place of birth for U.S.-born residents:
This state: 73,286Other state: 12,204Northeast: 1,853Midwest: 4,508South: 4,068West: 1,775 91.0% of Livonia residents lived in the same house 1 years ago.
Out of people who lived in different houses, 36.3% lived in this county.
Out of people who lived in different counties, 67.7% lived in Michigan.
Livonia:
91.0%State average:
88.4%
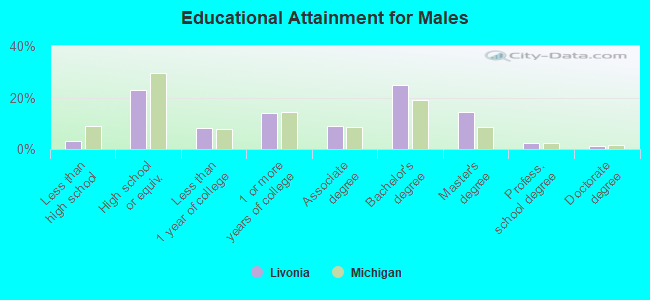
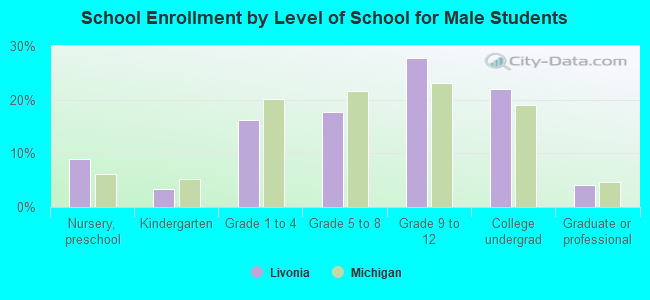
Education attainment for males 25 years and older:
No schooling: 64Nursery to 4th grade: 775th and 6th grade: 07th and 8th grade: 1239th grade: 15810th grade: 4811th grade: 7012th grade, no diploma: 494High school graduate (or equivalency): 7,948Less than 1 year of college: 2,854Some college more than 1 year, no degree: 4,768Associate degree: 3,143Bachelor's degree: 8,596Master's degree: 4,916Professional school degree: 760Doctorate degree: 450
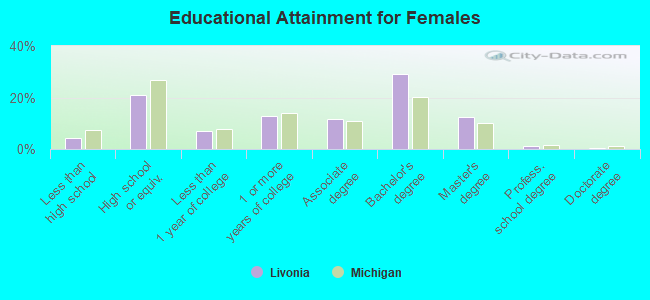
Education attainment for females 25 years and older:
No schooling: 244Nursery to 4th grade: 815th and 6th grade: 487th and 8th grade: 09th grade: 16710th grade: 11211th grade: 32112th grade, no diploma: 522High school graduate (or equivalency): 7,544Less than 1 year of college: 2,476Some college more than 1 year, no degree: 4,539Associate degree: 4,161Bachelor's degree: 10,426Master's degree: 4,450Professional school degree: 435Doctorate degree: 132
Housing units in structures:
One, detached: 34,425One, attached: 1,446Two: 1163 or 4: 7045 to 9: 1,83210 to 19: 38220 to 49: 25150 or more: 997Mobile homes: 278Housing units lacking complete plumbing facilities in 2022: 0.2%Housing units lacking complete kitchen facilities in 2022: 0.3%House/condo owner moved in on average 14 years ago
Renter moved in on average 1 years ago
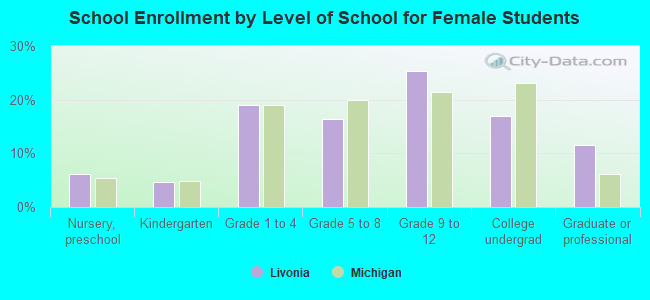
Private vs. public school enrollment:
Students in private schools in grades 1 to 8 (elementary and middle school): 1,039 Students in private schools in grades 9 to 12 (high school): 528 Students in private undergraduate colleges: 257