Manassas, VA (Virginia) Houses and Residents
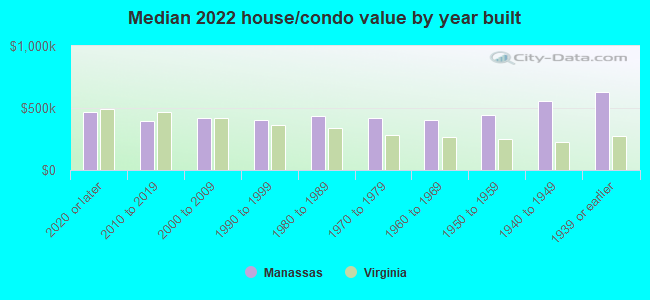
Estimated median house or condo value in 2022: $427,699 (it was $148,600 in 2000 )
Manassas:
$427,699Virginia:
$365,700
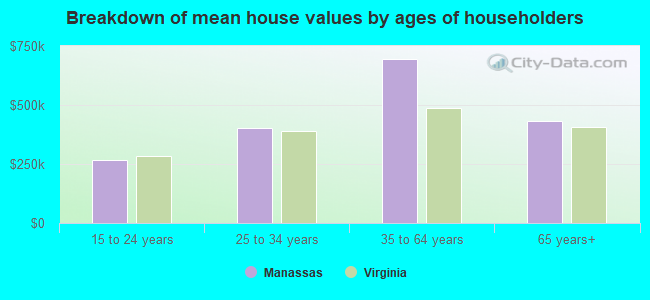
Lower value quartile - upper value quartile: $332,482 - $529,591Mean price in 2022: Detached houses: $554,932 Here:
$554,932State:
$472,865
Townhouses or other attached units: $764,791 Here:
$764,791State:
$457,437
In 2-unit structures: $227,750 Here:
$227,750State:
$396,289
In 3-to-4-unit structures: $286,694 Here:
$286,694State:
$252,346
In 5-or-more-unit structures: $202,487 Here:
$202,487State:
$382,551
Mobile homes: $17,494 Here:
$17,494State:
$100,736
Total population: 42,081 (Urban population: 35,115, Rural population: 20 (all nonfarm) )
Houses: 14,655 (14,139 occupied: 10,511 owner occupied, 3,701 renter occupied )
% of renters here:
26%State:
33%
Housing density: 1,475 houses/condos per square mile
Median price asked for vacant for-sale houses and condos in 2022: $332,560.
Median contract rent in 2022: $1,593 (lower quartile is $1,268, upper quartile is $1,925)
Median rent asked for vacant for-rent units in 2022: $1,737
Median gross rent in Manassas, VA in 2022: $1,728
Housing units in Manassas with a mortgage: 8,423 (549 second mortgage, 92 home equity loan, 404 both second mortgage and home equity loan )Houses without a mortgage: 253
Median household income for houses/condos with a mortgage: $133,585
Median household income for apartments without a mortgage: $104,328
Median monthly housing costs: $1,860
Data:
Median house or condo value ($)
Median house or condo value ($ change since 2000)
Median house or condo value ($) - White
Median house or condo value ($) - Black or African American
Median house or condo value ($) - Asian
Median house or condo value ($) - Hispanic or Latino
Median house or condo value ($) - American Indian and Alaska Native
Median house or condo value ($) - Multirace
Median house or condo value ($) - Other Race
Median price asked for mobile homes ($)
Household density (households per square mile)
Mean house or condo value by units in structure - 1, detached ($)
Mean house or condo value by units in structure - 1, attached ($)
Mean house or condo value by units in structure - 2 ($)
Mean house or condo value by units in structure by units in structure - 3 or 4 ($)
Mean house or condo value by units in structure - 5 or more ($)
Mean house or condo value by units in structure - Boat, RV, van, etc. ($)
Mean house or condo value by units in structure - Mobile home ($)
Median contract rent ($)
Median contract rent - Lower quartile ($)
Median contract rent - Upper quartile ($)
Median gross rent ($)
Urban houses (%)
Rural houses (%)
Houses occupied (%)
Houses occupied (% change since 2000)
Houses owner occupied (%)
Houses owner occupied (% change since 2000)
Houses renter occupied (%)
Houses renter occupied (% change since 2000)
Vacant housing units - For rent (%)
Vacant housing units - For rent (% change since 2000)
Vacant housing units - For sale only (%)
Vacant housing units - For sale only (% change since 2000)
Vacant housing units - Rented or sold, not occupied (%)
Vacant housing units - Rented or sold, not occupied (% change since 2000)
Vacant housing units - For seasonal, recreational, or occasional use (%)
Vacant housing units - For seasonal, recreational, or occasional use (% change since 2000)
Vacant housing units - For migrant workers (%)
Vacant housing units - For migrant workers (% change since 2000)
Vacant housing units - Other vacant (%)
Vacant housing units - Other vacant (% change since 2000)
Median monthly housing costs ($)
Median household income for houses/condos with a mortgage ($)
Median household income for houses/condos without a mortgage ($)
Median household income ($)
Median household income ($) - White
Median household income ($) - Black or African American
Median household income ($) - Asian
Median household income ($) - Hispanic or Latino
Median household income ($) - American Indian and Alaska Native
Median household income ($) - Multirace
Median household income ($) - Other Race
Mortgage status - with mortgage (%)
Mortgage status - with second mortgage (%)
Mortgage status - with home equity loan (%)
Mortgage status - with both second mortgage and home equity loan (%)
Mortgage status - without a mortgage (%)
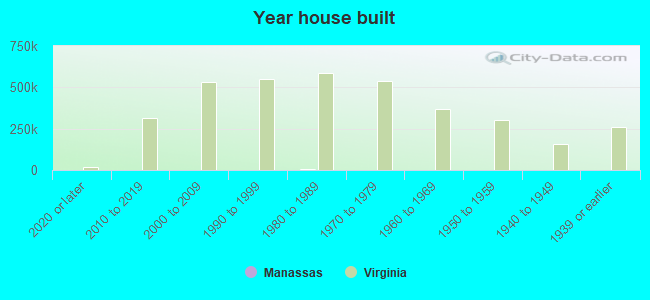
Median year house/condo built
Median year apartment built
Household type by relationship - Male householder living alone (%)
Household type by relationship - Male householder not living alone (%)
Household type by relationship - Female householder living alone (%)
Household type by relationship - Female householder not living alone (%)
Household type by relationship - Opposite-Sex spouse (%)
Household type by relationship - Same-Sex spouse (%)
Household type by relationship - Opposite-Sex unmarried partner (%)
Household type by relationship - Same-Sex unmarried partner (%)
Household type by relationship - In group quarters (%)
Size of family households - 2-person household (%)
Size of family households - 3-person household (%)
Size of family households - 4-person household (%)
Size of family households - 5-person household (%)
Size of family households - 6-person household (%)
Size of family households - 7-or-more-person household (%)
Size of nonfamily households - 1-person household (%)
Size of nonfamily households - 2-person household (%)
Size of nonfamily households - 3-person household (%)
Size of nonfamily households - 4-person household (%)
Size of nonfamily households - 5-person household (%)
Size of nonfamily households - 6-person household (%)
Size of nonfamily households - 7-or-moreperson household (%)
Year house built - Built 2010 or later (%)
Year house built - Built 2000 to 2009 (%)
Year house built - Built 1990 to 1999 (%)
Year house built - Built 1980 to 1989 (%)
Year house built - Built 1970 to 1979 (%)
Year house built - Built 1960 to 1969 (%)
Year house built - Built 1950 to 1959 (%)
Year house built - Built 1940 to 1949 (%)
Year house built - Built 1939 or earlier (%)
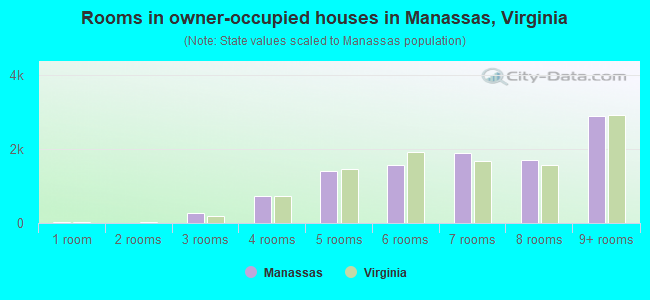
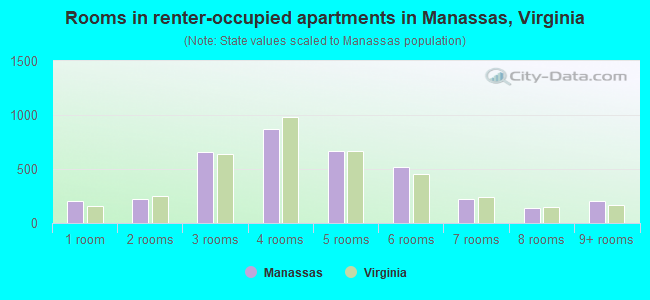
Median number of rooms in houses and condos
Median number of rooms in apartments
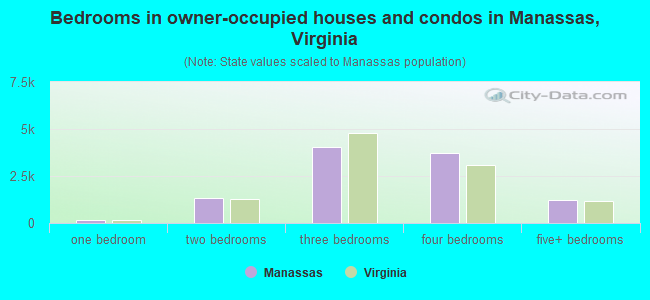
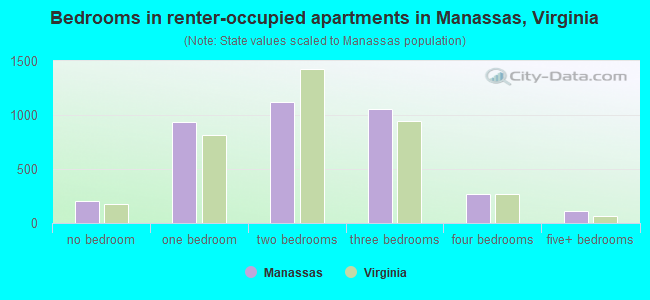
Median number of bedrooms in owner occupied houses
Mean number of bedrooms in owner occupied houses
Median number of bedrooms in renter occupied houses
Mean number of bedrooms in renter occupied houses
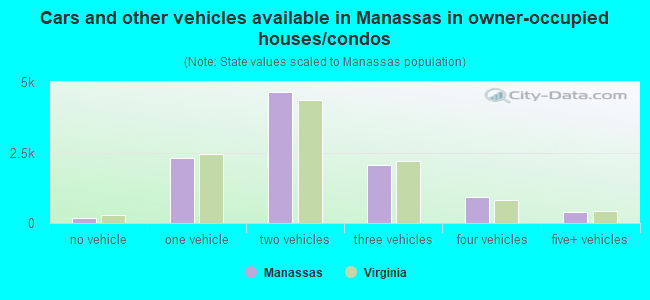
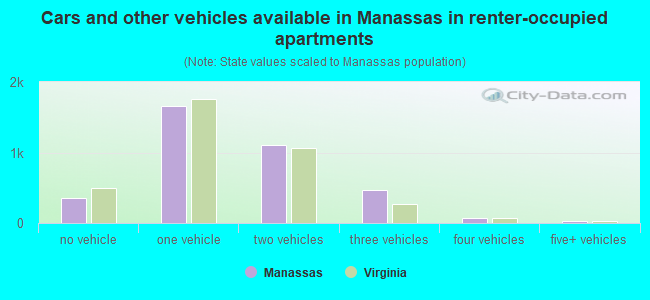
Median number of vehichles in owner occupied houses
Mean number of vehichles in owner occupied houses
Median number of vehichles in renter occupied houses
Mean number of vehichles in renter occupied houses
Rooms in owner-occupied houses - 1 room (%)
Rooms in owner-occupied houses - 2 rooms (%)
Rooms in owner-occupied houses - 3 rooms (%)
Rooms in owner-occupied houses - 4 rooms (%)
Rooms in owner-occupied houses - 5 rooms (%)
Rooms in owner-occupied houses - 6 rooms (%)
Rooms in owner-occupied houses - 7 rooms (%)
Rooms in owner-occupied houses - 8 rooms (%)
Rooms in owner-occupied houses - 9+ rooms (%)
Rooms in renter-occupied houses - 1 room (%)
Rooms in renter-occupied houses - 2 rooms (%)
Rooms in renter-occupied houses - 3 rooms (%)
Rooms in renter-occupied houses - 4 rooms (%)
Rooms in renter-occupied houses - 5 rooms (%)
Rooms in renter-occupied houses - 6 rooms (%)
Rooms in renter-occupied houses - 7 rooms (%)
Rooms in renter-occupied houses - 8 rooms (%)
Rooms in renter-occupied houses - 9+ rooms (%)
Bedrooms in owner-occupied houses - no bedrooms (%)
Bedrooms in owner-occupied houses - 1 bedroom (%)
Bedrooms in owner-occupied houses - 2 bedrooms (%)
Bedrooms in owner-occupied houses - 3 bedrooms (%)
Bedrooms in owner-occupied houses - 4 bedrooms (%)
Bedrooms in owner-occupied houses - 5+ bedrooms (%)
Bedrooms in renter-occupied houses - no bedrooms (%)
Bedrooms in renter-occupied houses - 1 bedroom (%)
Bedrooms in renter-occupied houses - 2 bedrooms (%)
Bedrooms in renter-occupied houses - 3 bedrooms (%)
Bedrooms in renter-occupied houses - 4 bedrooms (%)
Bedrooms in renter-occupied houses - 5+ bedrooms (%)
Vehicles available in owner-occupied houses - no vehicle available (%)
Vehicles available in owner-occupied houses - 1 vehicle available(%)
Vehicles available in owner-occupied houses - 2 Vehicles available (%)
Vehicles available in owner-occupied houses - 3 Vehicles available (%)
Vehicles available in owner-occupied houses - 4 Vehicles available (%)
Vehicles available in owner-occupied houses - 5+ Vehicles available (%)
Vehicles available in renter-occupied houses - no vehicle available (%)
Vehicles available in renter-occupied houses - 1 vehicle available (%)
Vehicles available in renter-occupied houses - 2 Vehicles available (%)
Vehicles available in renter-occupied houses - 3 Vehicles available (%)
Vehicles available in renter-occupied houses - 4 Vehicles available (%)
Vehicles available in renter-occupied houses - 5+ Vehicles available (%)
Housing units in structures - 1, detached (%)
Housing units in structures - 1, attached (%)
Housing units in structures - 2 (%)
Housing units in structures - 3 or 4 (%)
Housing units in structures - 5 to 9 (%)
Housing units in structures - 10 to 19 (%)
Housing units in structures - 20 to 49 (%)
Housing units in structures - 50 or more (%)
Housing units in structures - Mobile home (%)
Housing units in structures - Boat, RV, van, etc. (%)
Housing units in structures - Owners - 1, detached (%)
Housing units in structures - Owners - 1, attached (%)
Housing units in structures - Owners - 2 (%)
Housing units in structures - Owners - 3 or 4 (%)
Housing units in structures - Owners - 5 to 9 (%)
Housing units in structures - Owners - 10 to 19 (%)
Housing units in structures - Owners - 20 to 49 (%)
Housing units in structures - Owners - 50 or more (%)
Housing units in structures - Owners - Mobile home (%)
Housing units in structures - Owners - Boat, RV, van, etc. (%)
Housing units in structures - Renters - 1, detached (%)
Housing units in structures - Renters - 1, attached (%)
Housing units in structures - Renters - 2 (%)
Housing units in structures - Renters - 3 or 4 (%)
Housing units in structures - Renters - 5 to 9 (%)
Housing units in structures - Renters - 10 to 19 (%)
Housing units in structures - Renters - 20 to 49 (%)
Housing units in structures - Renters - 50 or more (%)
Housing units in structures - Renters - Mobile home (%)
Housing units in structures - Renters - Boat, RV, van, etc. (%)
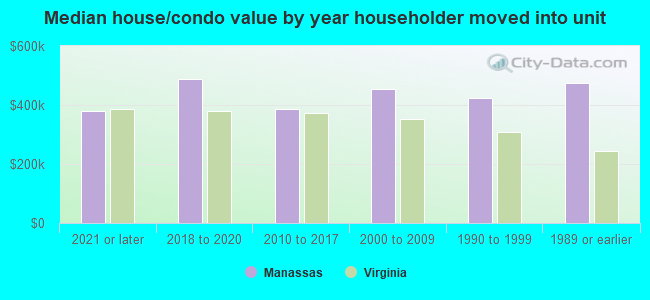
House/condo owner moved in on average (years ago)
Renter moved in on average (years ago)
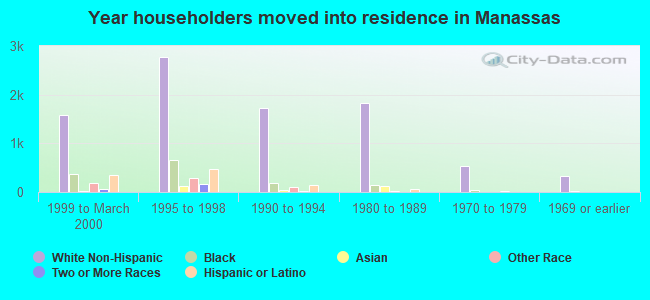
Year householder moved into unit - Moved in 1999 to March 2000 (%)
Year householder moved into unit - Moved in 1999 to March 2000 (%) - White
Year householder moved into unit - Moved in 1999 to March 2000 (%) - Black or African American
Year householder moved into unit - Moved in 1999 to March 2000 (%) - Asian
Year householder moved into unit - Moved in 1999 to March 2000 (%) - Hispanic or Latino
Year householder moved into unit - Moved in 1999 to March 2000 (%) - American Indian and Alaska Native
Year householder moved into unit - Moved in 1999 to March 2000 (%) - Multirace
Year householder moved into unit - Moved in 1999 to March 2000 (%) - Other Race
Year householder moved into unit - Moved in 1995 to 1998 (%)
Year householder moved into unit - Moved in 1995 to 1998 (%) - White
Year householder moved into unit - Moved in 1995 to 1998 (%) - Black or African American
Year householder moved into unit - Moved in 1995 to 1998 (%) - Asian
Year householder moved into unit - Moved in 1995 to 1998 (%) - Hispanic or Latino
Year householder moved into unit - Moved in 1995 to 1998 (%) - American Indian and Alaska Native
Year householder moved into unit - Moved in 1995 to 1998 (%) - Multirace
Year householder moved into unit - Moved in 1995 to 1998 (%) - Other Race
Year householder moved into unit - Moved in 1990 to 1994 (%)
Year householder moved into unit - Moved in 1990 to 1994 (%) - White
Year householder moved into unit - Moved in 1990 to 1994 (%) - Black or African American
Year householder moved into unit - Moved in 1990 to 1994 (%) - Asian
Year householder moved into unit - Moved in 1990 to 1994 (%) - Hispanic or Latino
Year householder moved into unit - Moved in 1990 to 1994 (%) - American Indian and Alaska Native
Year householder moved into unit - Moved in 1990 to 1994 (%) - Multirace
Year householder moved into unit - Moved in 1990 to 1994 (%) - Other Race
Year householder moved into unit - Moved in 1980 to 1989 (%)
Year householder moved into unit - Moved in 1980 to 1989 (%) - White
Year householder moved into unit - Moved in 1980 to 1989 (%) - Black or African American
Year householder moved into unit - Moved in 1980 to 1989 (%) - Asian
Year householder moved into unit - Moved in 1980 to 1989 (%) - Hispanic or Latino
Year householder moved into unit - Moved in 1980 to 1989 (%) - American Indian and Alaska Native
Year householder moved into unit - Moved in 1980 to 1989 (%) - Multirace
Year householder moved into unit - Moved in 1980 to 1989 (%) - Other Race
Year householder moved into unit - Moved in 1970 to 1979 (%)
Year householder moved into unit - Moved in 1970 to 1979 (%) - White
Year householder moved into unit - Moved in 1970 to 1979 (%) - Black or African American
Year householder moved into unit - Moved in 1970 to 1979 (%) - Asian
Year householder moved into unit - Moved in 1970 to 1979 (%) - Hispanic or Latino
Year householder moved into unit - Moved in 1970 to 1979 (%) - American Indian and Alaska Native
Year householder moved into unit - Moved in 1970 to 1979 (%) - Multirace
Year householder moved into unit - Moved in 1970 to 1979 (%) - Other Race
Year householder moved into unit - Moved in 1969 or earlier (%)
Year householder moved into unit - Moved in 1969 or earlier (%) - White
Year householder moved into unit - Moved in 1969 or earlier (%) - Black or African American
Year householder moved into unit - Moved in 1969 or earlier (%) - Asian
Year householder moved into unit - Moved in 1969 or earlier (%) - Hispanic or Latino
Year householder moved into unit - Moved in 1969 or earlier (%) - American Indian and Alaska Native
Year householder moved into unit - Moved in 1969 or earlier (%) - Multirace
Year householder moved into unit - Moved in 1969 or earlier (%) - Other Race
Housing units lacking complete plumbing facilities (%)
Housing units lacking complete kitchen facilities (%)
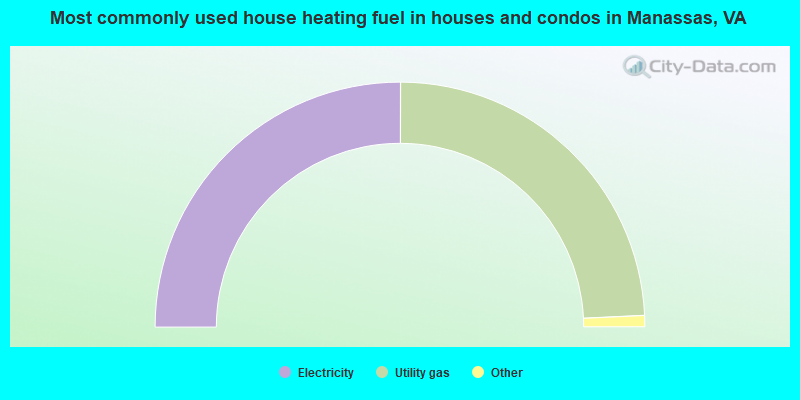
House heating fuel used in houses and condos - Utility gas (%)
House heating fuel used in houses and condos - Bottled, tank, or LP gas (%)
House heating fuel used in houses and condos - Electricity (%)
House heating fuel used in houses and condos - Fuel oil, kerosene, etc. (%)
House heating fuel used in houses and condos - Coal or coke (%)
House heating fuel used in houses and condos - Wood (%)
House heating fuel used in houses and condos - Solar energy (%)
House heating fuel used in houses and condos - Other fuel (%)
House heating fuel used in houses and condos - No fuel used (%)
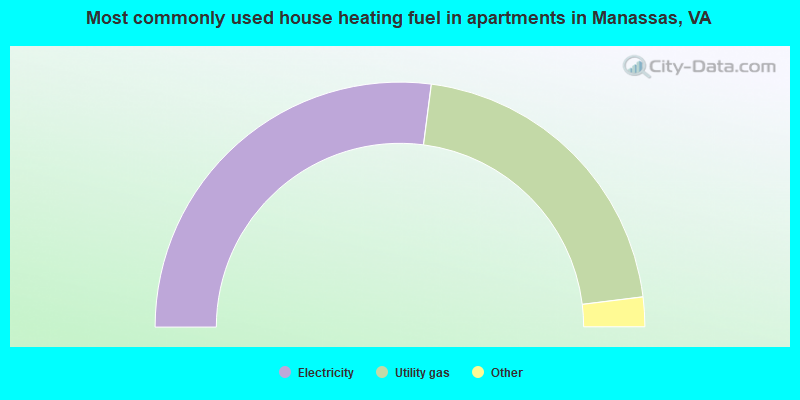
House heating fuel used in apartments - Utility gas (%)
House heating fuel used in apartments - Bottled, tank, or LP gas (%)
House heating fuel used in apartments - Electricity (%)
House heating fuel used in apartments - Fuel oil, kerosene, etc. (%)
House heating fuel used in apartments - Coal or coke (%)
House heating fuel used in apartments - Wood (%)
House heating fuel used in apartments - Solar energy (%)
House heating fuel used in apartments - Other fuel (%)
House heating fuel used in apartments - No fuel used (%)
Latest news about housing in Manassas, VA collected exclusively by city-data.com from local newspapers, TV, and radio stations
Median year house/condo built: 1985Median year apartment built: 1988Household type by relationship:
Households: 43,136
Male householders: 7,646 (1,518 living alone ), Female householders: 6,361 (1,971 living alone )7,413 spouses (7,396 opposite-sex spouses ), 1,381 unmarried partners , (1,325 opposite-sex unmarried partners ), 14,366 children (13,314 natural , 177 adopted , 875 stepchildren ), 853 grandchildren , 634 brothers or sisters , 1,111 parents , 0 foster children , 2,068 other relatives , 1,218 non-relatives In group quarters: 79
Size of family households: 3,055 2-persons , 2,320 3-persons , 2,005 4-persons , 1,057 5-persons , 794 6-persons , 653 7-or-more-persons .
Size of nonfamily households: 3,686 1-person , 649 2-persons , 60 3-persons , 9 4-persons .
7,206 married couples with children. single-parent households (631 men , 1,901 women ).
57.3% of residents of Manassas speak English at home. of residents speak Spanish at home (44% speak English very well , 19% speak English well , 22% speak English not well , 15% don't speak English at all ).of residents speak other Indo-European language at home (69% speak English very well , 28% speak English well , 3% speak English not well ).of residents speak Asian or Pacific Island language at home (54% speak English very well , 26% speak English well , 9% speak English not well , 11% don't speak English at all ).of residents speak other language at home (69% speak English very well , 22% speak English well , 9% speak English not well ).
Foreign born population: 12,267 (28.4%)of them are naturalized citizens )
Median number of rooms in houses and condos:
Median number of rooms in apartments
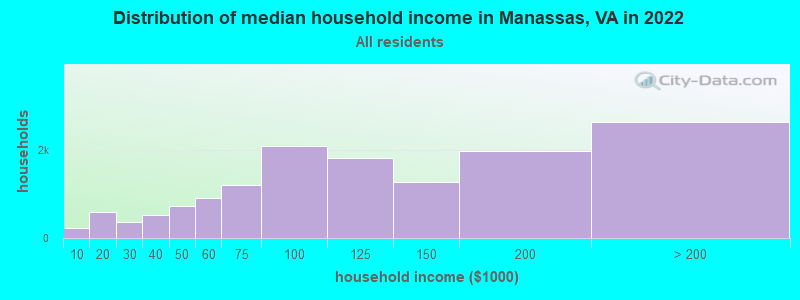
Manassas, VA household income distribution 219 Less than $10,000598 $10,000 to $19,999359 $20,000 to $29,999529 $30,000 to $39,999716 $40,000 to $49,999907 $50,000 to $59,9991,197 $60,000 to $74,9992,080 $75,000 to $99,9991,812 $100,000 to $124,9991,273 $125,000 to $149,9991,971 $150,000 to $199,9992,622 $200,000 or more
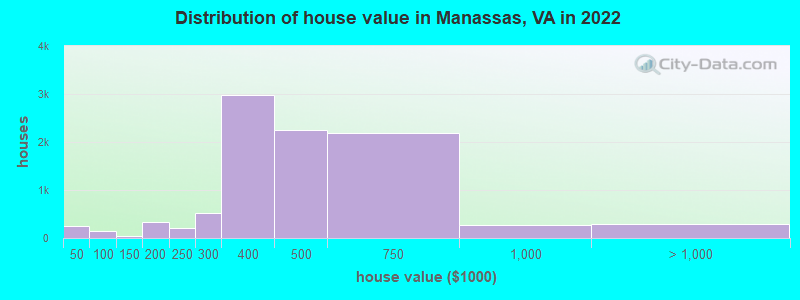
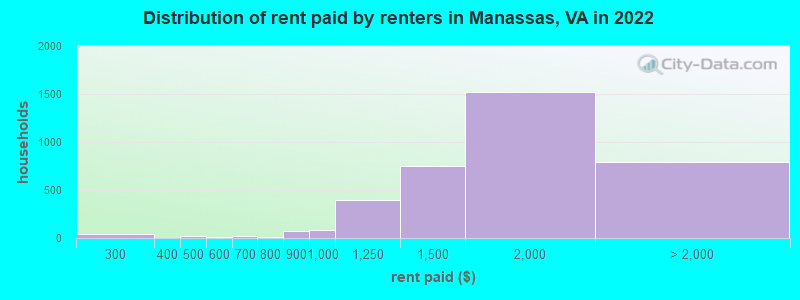
Home value of owner - occupied houses in 2022 in Manassas, VA 151 Less than $10,00022 $15,000 to $19,99915 $20,000 to $24,99924 $30,000 to $34,99940 $40,000 to $49,99947 $50,000 to $59,99915 $60,000 to $69,99938 $80,000 to $89,99912 $100,000 to $124,99927 $125,000 to $149,999131 $150,000 to $174,999199 $175,000 to $199,999216 $200,000 to $249,999512 $250,000 to $299,9992,973 $300,000 to $399,9992,252 $400,000 to $499,9992,195 $500,000 to $749,999275 $750,000 to $999,99920 $1,000,000 to $1,499,999273 $2,000,000 or moreRent paid by renters in 2022 in Manassas, VA 4 $150 to $19941 $200 to $24918 $400 to $4498 $550 to $59919 $600 to $64914 $750 to $79974 $800 to $89983 $900 to $999393 $1,000 to $1,249750 $1,250 to $1,4991,519 $1,500 to $1,999460 $2,000 to $2,499132 $2,500 to $2,99936 $3,000 to $3,49924 $3,500 or more140 No cash rent
Percentage of workers working in this county: 37.3%Number of people working at home: 3,150 (13.8% of all workers )
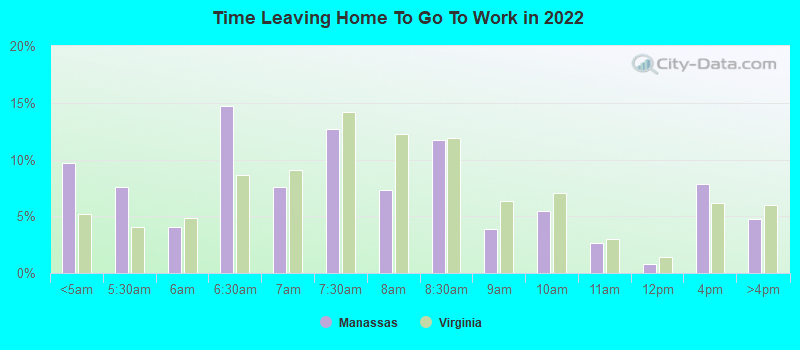
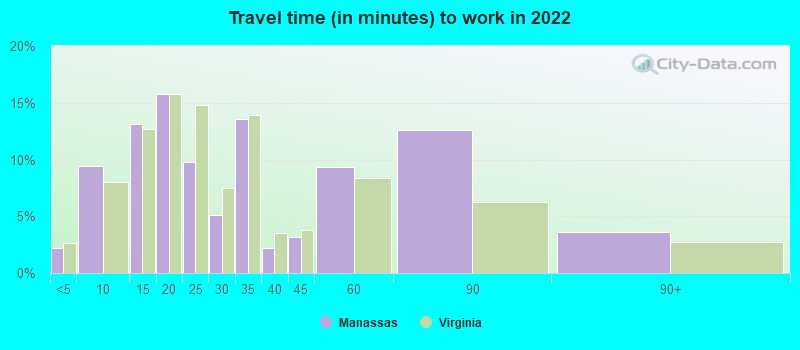
Travel time to work (commute)
Less than 5 minutes: 3745 to 9 minutes: 2,20410 to 14 minutes: 2,91215 to 19 minutes: 2,17720 to 24 minutes: 1,31825 to 29 minutes: 82430 to 34 minutes: 2,34535 to 39 minutes: 86040 to 44 minutes: 1,15045 to 59 minutes: 1,97260 to 89 minutes: 2,92990 or more minutes: 608
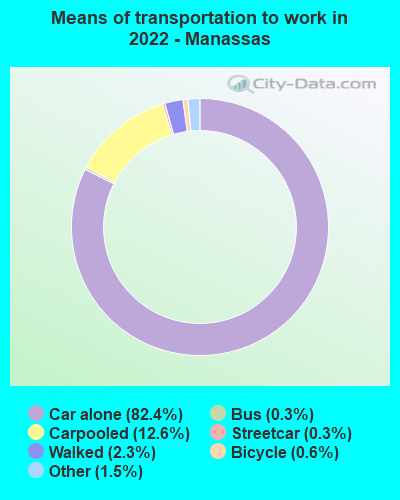
Means of transportation to work:
Drove a car alone: 18,229 (68.8%)Carpooled: 2,779 (10.5%)Bus : 38 (0.1%)Subway or elevated rail : 65 (0.2%)Long-distance train or commuter rail : 35 (0.1%)Taxi: 491 (1.9%)Bicycle: 97 (0.4%)Walked: 472 (1.8%)Worked at home: 3,150 (11.9%)
Unemployment by race in 2022
Unemployment rate for White non-Hispanic residents 3.9% Males1.6% FemalesUnemployment rate for Black residents 2.2% Males1.6% FemalesUnemployment rate for American Indian and Alaska Native residents 5.3% MalesUnemployment rate for Asian residents 12.0% MalesUnemployment rate for other race residents 2.5% Males9.2% FemalesUnemployment rate for two or more race residents 0.6% Males2.4% FemalesUnemployment rate for Hispanic or Latino residents 1.3% Males3.8% Females
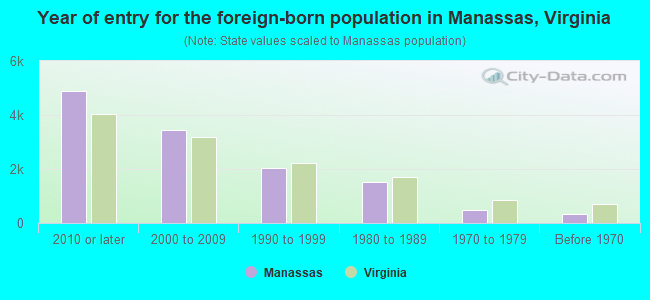
Year of entry for the foreign-born population in Manassas, Virginia
4,899 2010 or later 3,432 2000 to 2009 2,047 1990 to 1999 1,518 1980 to 1989 463 1970 to 1979 349 Before 1970
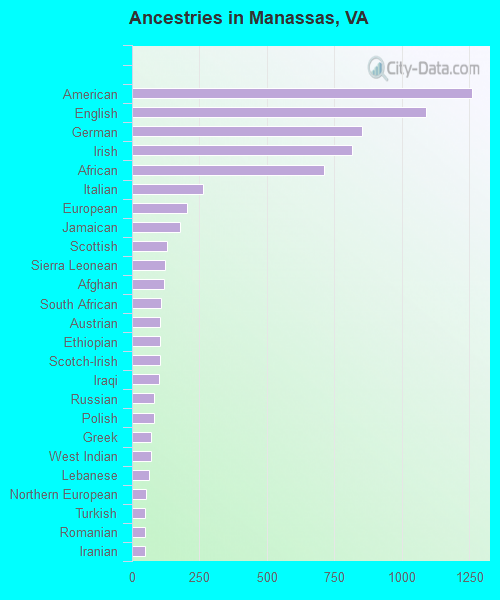
First ancestries reported:
American: 1,261 (5.4%)
English: 1,090 (4.7%)
German: 852 (3.6%)
Irish: 815 (3.5%)
African: 711 (3.0%)
Italian: 264 (1.1%)
European: 204 (0.9%)
Jamaican: 179 (0.8%)
Scottish: 129 (0.6%)
Sierra Leonean: 121 (0.5%)
Afghan: 117 (0.5%)
South African: 106 (0.5%)
Austrian: 104 (0.4%)
Ethiopian: 102 (0.4%)
Scotch-Irish: 102 (0.4%)
Iraqi: 99 (0.4%)
Russian: 81 (0.3%)
Polish: 81 (0.3%)
Greek: 72 (0.3%)
West Indian: 72 (0.3%)
Lebanese: 64 (0.3%)
Northern European: 53 (0.2%)
Turkish: 50 (0.2%)
Romanian: 50 (0.2%)
Iranian: 47 (0.2%)
British: 47 (0.2%)
French Canadian: 46 (0.2%)
Nigerian: 44 (0.2%)
Czech: 43 (0.2%)
Dutch: 42 (0.2%)
German Russian: 39 (0.2%)
Moroccan: 35 (0.1%)
Eastern European: 33 (0.1%)
Bulgarian: 32 (0.1%)
Norwegian: 30 (0.1%)
Welsh: 21 (0.09%)
Danish: 20 (0.09%)
Portuguese: 19 (0.08%)
Swiss: 19 (0.08%)
Finnish: 16 (0.07%)
Czechoslovakian: 15 (0.06%)
Israeli: 13 (0.06%)
French: 10 (0.04%)
Scandinavian: 9 (0.04%)
Basque: 9 (0.04%)
Ukrainian: 8 (0.03%)
Jordanian: 8 (0.03%)
Albanian: 6 (0.03%)
Slovak: 6 (0.03%)
Swedish: 6 (0.03%)
Arab: 6 (0.03%)
Hungarian: 5 (0.02%)
Trinidadian and Tobagonian: 4 (0.02%)
Most common places of birth for foreign-born residents (%): El Salvador Manassas:
27.8% (3,533)Virginia:
9.9% (107,534)
Mexico Manassas:
19.1% (2,429)Virginia:
5.3% (57,498)
Honduras Manassas:
9.4% (1,200)Virginia:
3.0% (32,892)
Philippines Manassas:
3.6% (462)Virginia:
4.8% (52,629)
Ghana Manassas:
3.1% (397)Virginia:
1.6% (17,346)
Peru Manassas:
2.7% (343)Virginia:
2.4% (26,366)
Guatemala Manassas:
2.6% (334)Virginia:
3.3% (35,938)
India Manassas:
2.3% (288)Virginia:
9.0% (97,830)
Japan Manassas:
1.7% (220)Virginia:
0.8% (8,805)
Dominican Republic Manassas:
1.7% (216)Virginia:
0.6% (6,698)
Bolivia Manassas:
1.6% (205)Virginia:
2.4% (25,722)
Vietnam Manassas:
1.6% (198)Virginia:
4.2% (45,750)
Place of birth for U.S.-born residents:
This state: 17,554Other state: 11,913Northeast: 3,513Midwest: 2,125South: 4,636West: 1,644 83.9% of Manassas residents lived in the same house 1 years ago.
Out of people who lived in different houses, 24.6% lived in this county.
Out of people who lived in different counties, 89.1% lived in Virginia.
Manassas:
83.9%State average:
86.6%
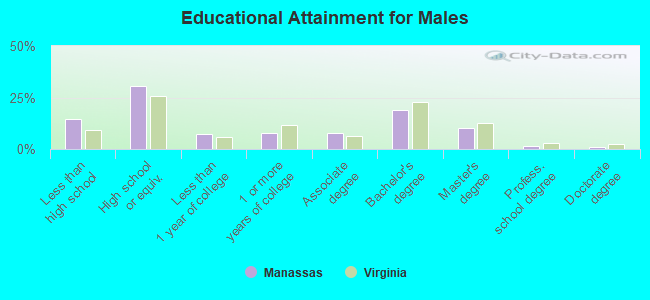
Education attainment for males 25 years and older:
No schooling: 780Nursery to 4th grade: 1775th and 6th grade: 1557th and 8th grade: 1689th grade: 26210th grade: 2711th grade: 7912th grade, no diploma: 415High school graduate (or equivalency): 4,371Less than 1 year of college: 1,032Some college more than 1 year, no degree: 1,110Associate degree: 1,126Bachelor's degree: 2,695Master's degree: 1,475Professional school degree: 196Doctorate degree: 147
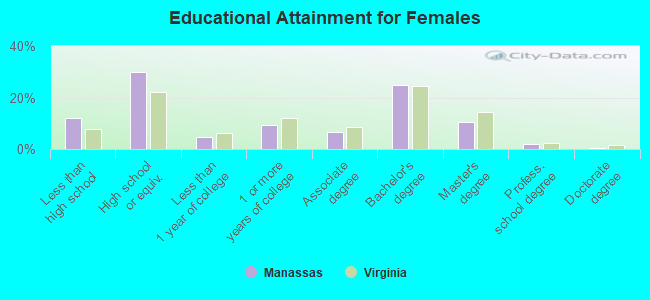
Education attainment for females 25 years and older:
No schooling: 620Nursery to 4th grade: 1045th and 6th grade: 737th and 8th grade: 2089th grade: 27710th grade: 4211th grade: 2812th grade, no diploma: 374High school graduate (or equivalency): 4,231Less than 1 year of college: 639Some college more than 1 year, no degree: 1,315Associate degree: 933Bachelor's degree: 3,514Master's degree: 1,475Professional school degree: 278Doctorate degree: 39
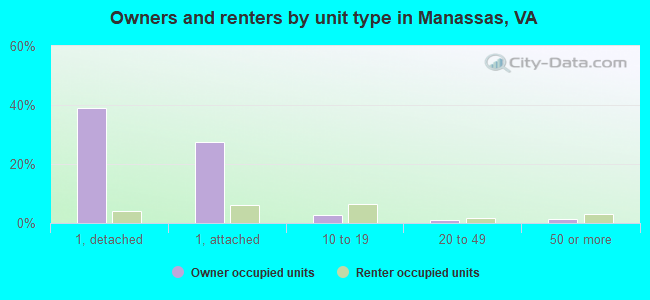
Housing units in structures:
One, detached: 6,330One, attached: 4,876Two: 883 or 4: 2105 to 9: 64910 to 19: 1,36220 to 49: 42150 or more: 571Mobile homes: 144Median worth of mobile homes: $19,724
Housing units lacking complete plumbing facilities in 2022: 0.2%Housing units lacking complete kitchen facilities in 2022: 0.7%House/condo owner moved in on average 9 years ago
Renter moved in on average 1 years ago
Private vs. public school enrollment:
Students in private schools in grades 1 to 8 (elementary and middle school): 800 Students in private schools in grades 9 to 12 (high school): 167 Students in private undergraduate colleges: 503