Mason, OH (Ohio) Houses and Residents
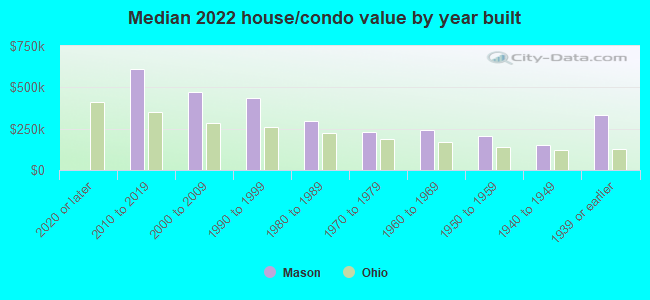
| Mason: | $412,900 |
| Ohio: | $204,100 |
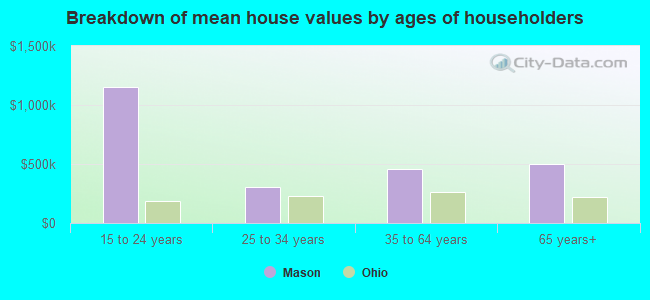
Mean price in 2022:
Detached houses: $431,597
Here: $431,597 State: $254,366 Townhouses or other attached units: $541,408
Here: $541,408 State: $225,733 In 3-to-4-unit structures: $657,081
Here: $657,081 State: $203,002 In 5-or-more-unit structures: $200,405
Here: $200,405 State: $211,593 Mobile homes: $19,487
Here: $19,487 State: $62,719
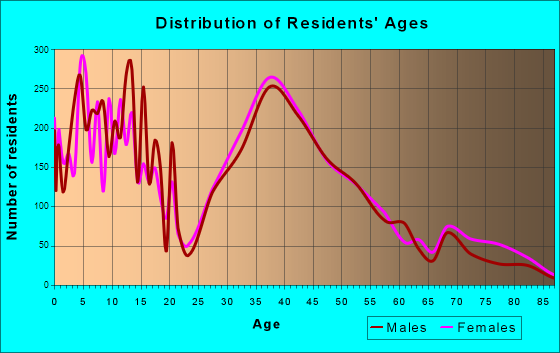
Total population: 31,613 (Urban population: 21,613, Rural population: 332 (all nonfarm))
Houses: 13,437 (13,072 occupied: 10,508 owner occupied, 2,887 renter occupied)
| % of renters here: | 22% |
| State: | 33% |
Housing density: 763 houses/condos per square mile
Median price asked for vacant for-sale houses and condos in 2022 in this county: $286,266.
Median contract rent in 2022: $1,461 (lower quartile is $1,067, upper quartile is $1,908)
Median rent asked for vacant for-rent units in 2022: $1,478
Median gross rent in Mason, OH in 2022: $1,666
Housing units in Mason with a mortgage: 7,776 (936 second mortgage, 61 home equity loan, 838 both second mortgage and home equity loan)
Houses without a mortgage: 156
Median household income for houses/condos with a mortgage: $147,083
Median household income for apartments without a mortgage: $119,421
Median monthly housing costs: $1,598
Compare current foreclosures in Mason, OH:
| Photo | Address | Area | Beds / Baths | Price | Details |
|---|---|---|---|---|---|

|
#1
Hunt Club Dr
Mason, OH 45040
|
3,484 sq. feet
|
3 baths 4 beds |
show details | |

|
#2
Brookcrest Dr
Mason, OH 45040
|
1,131 sq. feet
|
1 baths 3 beds |
show details | |

|
#3
Sparrow Pl
Mason, OH 45040
|
1,748 sq. feet
|
2 baths 3 beds |
show details | |

|
#4
Kings Mills Rd
Mason, OH 45040
|
2,076 sq. feet
|
1 baths 3 beds |
show details | |

|
#5
E North St
Mason, OH 45040
|
1,799 sq. feet
|
2 baths 3 beds |
show details | |

|
#6
Lakeknoll Dr
Mason, OH 45040
|
1,517 sq. feet
|
2 baths 3 beds |
show details | |

|
#7
Lakeknoll Dr
Mason, OH 45040
|
2,510 sq. feet
|
3 baths 3 beds |
show details | |

|
#8
Cloverwood Dr
Mason, OH 45040
|
1,584 sq. feet
|
2 baths 3 beds |
show details | |

|
#9
Brewer Rd
Mason, OH 45040
|
3,645 sq. feet
|
4 baths 5 beds |
show details | |

|
#10
Windward Dr
Mason, OH 45040
|
1,674 sq. feet
|
1 baths 3 beds |
show details |
| Photo | Address | Area | Beds / Baths | Price | Details |
|---|---|---|---|---|---|

|
#11
Wandering Way
Mason, OH 45040
|
3,732 sq. feet
|
2 baths 4 beds |
show details | |

|
#12
Brookcrest Dr
Mason, OH 45040
|
960 sq. feet
|
1 baths 3 beds |
show details | |

|
#13
Towneside Ct
Mason, OH 45040
|
2,612 sq. feet
|
2 baths 3 beds |
show details | |

|
#14
Spanish Bay Dr
Mason, OH 45040
|
1,144 sq. feet
|
1 baths 2 beds |
show details | |

|
#15
Clover Dr
Mason, OH 45040
|
1,521 sq. feet
|
1 baths 3 beds |
show details | |

|
#16
Cedar Knoll Dr
Mason, OH 45040
|
2,240 sq. feet
|
2 baths 4 beds |
show details | |

|
#17
Eagleview Dr
Mason, OH 45040
|
1,490 sq. feet
|
2 baths 3 beds |
show details | |

|
#18
Anthony Ln
Mason, OH 45040
|
1,394 sq. feet
|
2 baths 4 beds |
show details | |

|
#19
Winters Ln
Mason, OH 45040
|
2,680 sq. feet
|
2 baths 3 beds |
show details | |

|
#20
Spyglass Hl
Mason, OH 45040
|
1,202 sq. feet
|
1 baths 2 beds |
show details |
| Photo | Address | Area | Beds / Baths | Price | Details |
|---|---|---|---|---|---|

|
#21
Franklin Park St
Mason, OH 45040
|
2,071 sq. feet
|
3 baths 3 beds |
show details | |

|
#22
S Forest Ave
Mason, OH 45040
|
1,038 sq. feet
|
1 baths 3 beds |
show details | |

|
#23
Falcon Ln
Mason, OH 45040
|
2,292 sq. feet
|
2 baths 3 beds |
show details | |

|
#24
E Fountain Cir
Mason, OH 45040
|
- sq. feet
|
- baths - beds |
show details | |

|
#25
Placid Lake Dr Apt 104
Mason, OH 45040
|
- sq. feet
|
- baths - beds |
show details | |

|
#26
Shadow Lk
Mason, OH 45040
|
- sq. feet
|
- baths - beds |
show details | |

|
#27
N Shore Dr Apt 102
Mason, OH 45040
|
- sq. feet
|
- baths - beds |
show details | |

|
#28
Chatsworth Dr
Mason, OH 45040
|
- sq. feet
|
- baths - beds |
show details | |

|
#29
Maxfli Ln
Mason, OH 45040
|
- sq. feet
|
- baths - beds |
show details | |

|
#30
Fireside Dr
Mason, OH 45040
|
- sq. feet
|
- baths - beds |
show details |
| Photo | Address | Area | Beds / Baths | Price | Details |
|---|---|---|---|---|---|

|
#31
W Fountain Cir
Mason, OH 45040
|
- sq. feet
|
- baths - beds |
show details | |

|
#32
Lucena Way
Mason, OH 45040
|
- sq. feet
|
- baths - beds |
show details | |

|
#33
E Fountain Cir
Mason, OH 45040
|
- sq. feet
|
- baths - beds |
show details | |

|
#34
Lucena Way
Mason, OH 45040
|
- sq. feet
|
- baths - beds |
show details | |

|
#35
Palmera Dr
Mason, OH 45040
|
- sq. feet
|
- baths - beds |
show details | |

|
#36
Trustway Ct # 819
Mason, OH 45040
|
- sq. feet
|
- baths - beds |
show details | |

|
#37
Carriage Dr
Mason, OH 45040
|
- sq. feet
|
- baths - beds |
show details | |

|
#38
Four Seasons Dr
Mason, OH 45040
|
- sq. feet
|
- baths - beds |
show details | |

|
#39
Donna Jean Blvd
Mason, OH 45040
|
- sq. feet
|
- baths - beds |
show details | |

|
#40
Sherman Terrace Dr
Mason, OH 45040
|
- sq. feet
|
- baths - beds |
show details |
| Photo | Address | Area | Beds / Baths | Price | Details |
|---|---|---|---|---|---|

|
#41
Deerfield Blvd, Unit 355
Mason, OH 45040
|
- sq. feet
|
- baths - beds |
show details | |

|
#42
S Mason Montgomery Rd
Mason, OH 45040
|
50,475 sq. feet
|
- baths - beds |
show details | |

|
#43
Natorp Blvd # 407
Mason, OH 45040
|
- sq. feet
|
- baths - beds |
show details | |

|
#44
Innovation Way Ste 100
Mason, OH 45040
|
- sq. feet
|
- baths - beds |
show details | |

|
Check over 1 million property listings on Foreclosure.com!
|
browse all offers | |||

Latest news about housing in Mason, OH collected exclusively by city-data.com from local newspapers, TV, and radio stations


Median year apartment built: 2000
Household type by relationship:
Households: 35,710- Male householders: 6,498 (789 living alone), Female householders: 6,514 (1,700 living alone)
8,280 spouses (8,280 opposite-sex spouses), 725 unmarried partners, (689 opposite-sex unmarried partners), 12,025 children (11,652 natural, 145 adopted, 226 stepchildren), 339 grandchildren, 70 brothers or sisters, 442 parents, 0 foster children, 212 other relatives, 226 non-relatives
- In group quarters: 372
Size of family households: 4,205 2-persons, 1,955 3-persons, 2,421 4-persons, 987 5-persons, 322 6-persons, 10 7-or-more-persons.
Size of nonfamily households: 3,055 1-person, 457 2-persons.
7,616 married couples with children.
936 single-parent households (285 men, 651 women).
80.0% of residents of Mason speak English at home.
2.5% of residents speak Spanish at home (87% speak English very well, 6% speak English well, 7% don't speak English at all).
6.6% of residents speak other Indo-European language at home (83% speak English very well, 8% speak English well, 8% speak English not well, 1% don't speak English at all).
8.4% of residents speak Asian or Pacific Island language at home (71% speak English very well, 22% speak English well, 6% speak English not well, 1% don't speak English at all).
2.0% of residents speak other language at home (82% speak English very well, 11% speak English well, 7% don't speak English at all).
Foreign born population: 6,585 (18.4%)
(53.7% of them are naturalized citizens)
| Here: | 8.0 |
| State: | 6.7 |
| Here: | 5.0 |
| State: | 4.4 |
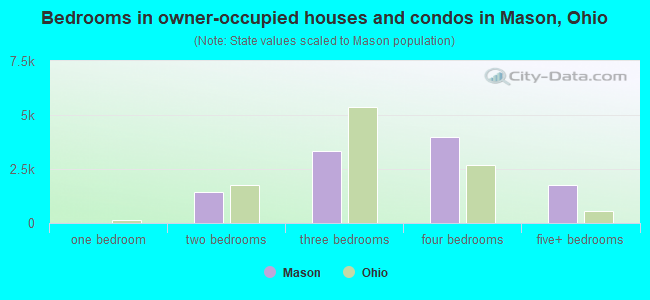
- Bedrooms in owner-occupied houses and condos in Mason, Ohio
- 0no bedroom
- 01 bedroom
- 1,4502 bedrooms
- 3,3203 bedrooms
- 3,9944 bedrooms
- 1,7445+ bedrooms
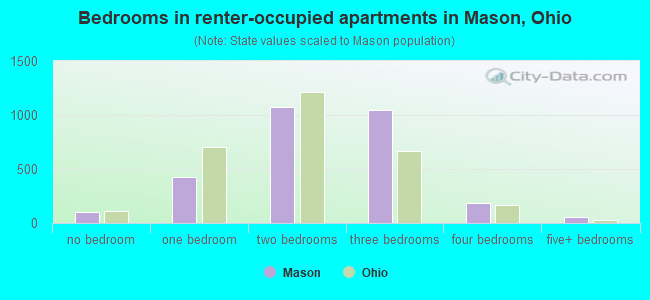
- Bedrooms in renter-occupied apartments in Mason, Ohio
- 104no bedroom
- 4301 bedroom
- 1,0742 bedrooms
- 1,0443 bedrooms
- 1834 bedrooms
- 535+ bedrooms
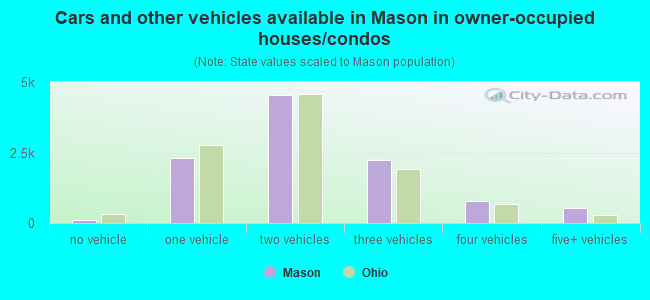
- Cars and other vehicles available in Mason in owner-occupied houses/condos
- 123no vehicle
- 2,3051 vehicle
- 4,5292 vehicles
- 2,2383 vehicles
- 7784 vehicles
- 5355+ vehicles
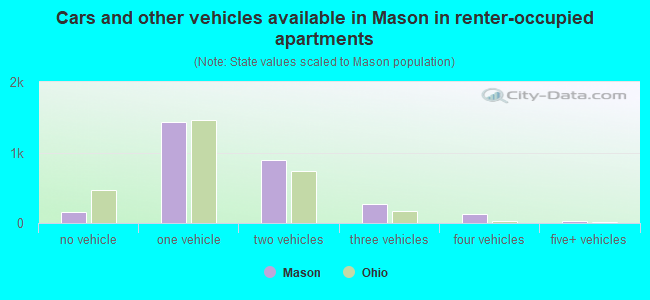
- Cars and other vehicles available in Mason in renter-occupied apartments
- 153no vehicle
- 1,4261 vehicle
- 8912 vehicles
- 2673 vehicles
- 1214 vehicles
- 295+ vehicles
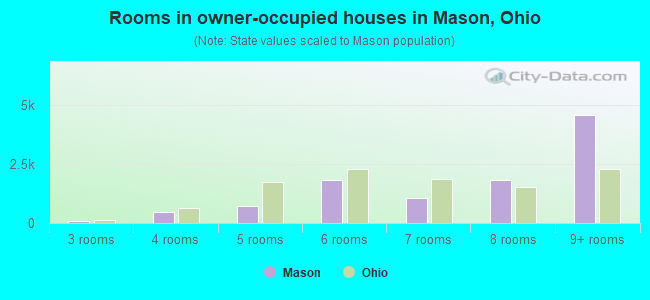
- Rooms in owner-occupied houses in Mason, Ohio
- 01 room
- 02 rooms
- 933 rooms
- 4704 rooms
- 7335 rooms
- 1,8116 rooms
- 1,0427 rooms
- 1,7978 rooms
- 4,5619+ rooms
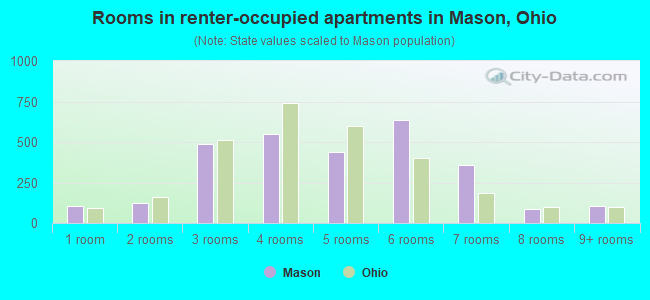
- Rooms in renter-occupied apartments in Mason, Ohio
- 1041 room
- 1232 rooms
- 4873 rooms
- 5514 rooms
- 4415 rooms
- 6346 rooms
- 3597 rooms
- 868 rooms
- 1039+ rooms
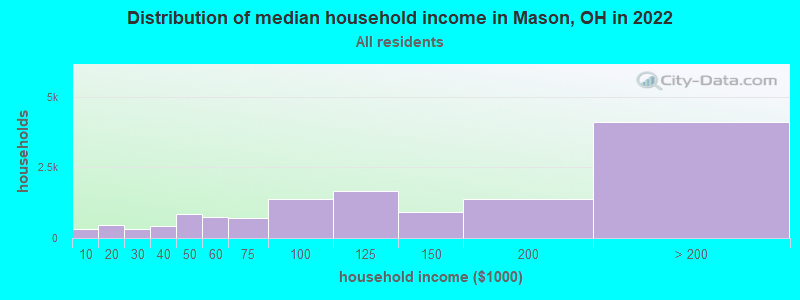
Mason, OH household income distribution

- 314Less than $10,000
- 450$10,000 to $19,999
- 326$20,000 to $29,999
- 442$30,000 to $39,999
- 838$40,000 to $49,999
- 750$50,000 to $59,999
- 704$60,000 to $74,999
- 1,391$75,000 to $99,999
- 1,662$100,000 to $124,999
- 936$125,000 to $149,999
- 1,387$150,000 to $199,999
- 4,111$200,000 or more
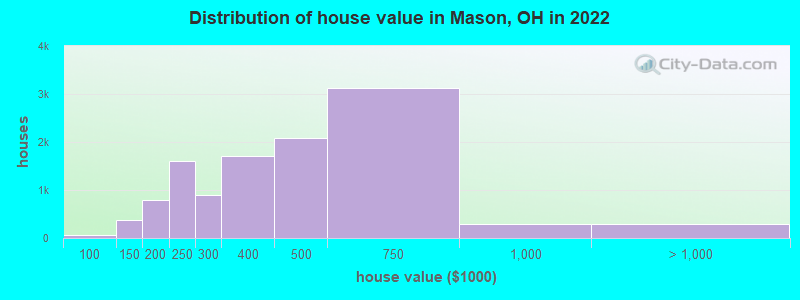
Home value of owner - occupied houses in 2022 in Mason, OH
-
- 12Less than $10,000
- 2$40,000 to $49,999
- 31$80,000 to $89,999
- 37$90,000 to $99,999
- 175$100,000 to $124,999
- 198$125,000 to $149,999
- 419$150,000 to $174,999
- 362$175,000 to $199,999
- 1,605$200,000 to $249,999
- 889$250,000 to $299,999
- 1,701$300,000 to $399,999
- 2,072$400,000 to $499,999
- 3,120$500,000 to $749,999
- 284$750,000 to $999,999
- 82$1,000,000 to $1,499,999
- 218$1,500,000 to $1,999,999
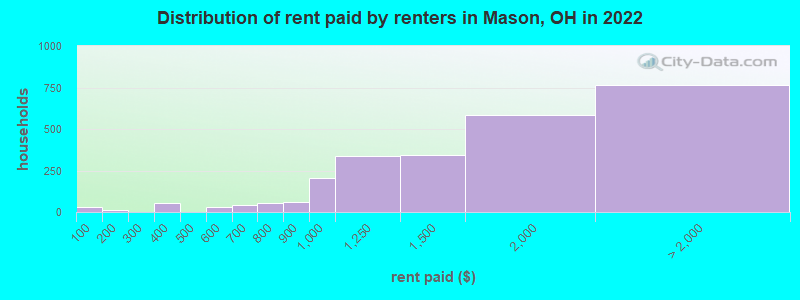
Rent paid by renters in 2022 in Mason, OH
-
- 32Less than $100
- 11$100 to $149
- 55$300 to $349
- 29$550 to $599
- 12$600 to $649
- 28$650 to $699
- 13$700 to $749
- 40$750 to $799
- 63$800 to $899
- 203$900 to $999
- 334$1,000 to $1,249
- 342$1,250 to $1,499
- 582$1,500 to $1,999
- 287$2,000 to $2,499
- 350$2,500 to $2,999
- 34$3,500 or more
- 92No cash rent
Percentage of workers working in this county: 50.9%
Number of people working at home: 4,646 (25.7% of all workers)
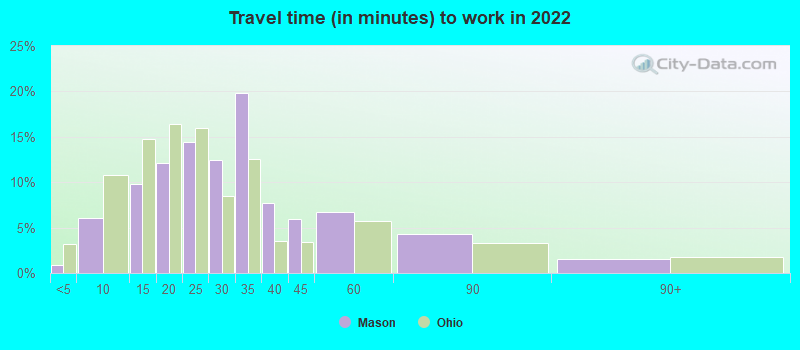
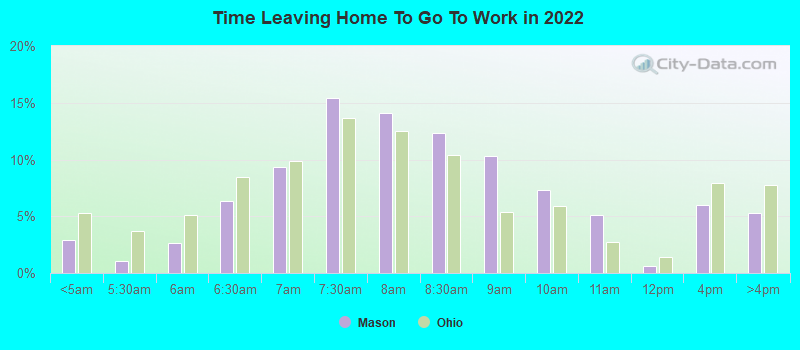
Travel time to work (commute)
- Less than 5 minutes: 138
- 5 to 9 minutes: 773
- 10 to 14 minutes: 2,014
- 15 to 19 minutes: 2,149
- 20 to 24 minutes: 1,957
- 25 to 29 minutes: 1,285
- 30 to 34 minutes: 2,562
- 35 to 39 minutes: 599
- 40 to 44 minutes: 1,043
- 45 to 59 minutes: 1,093
- 60 to 89 minutes: 618
- 90 or more minutes: 384
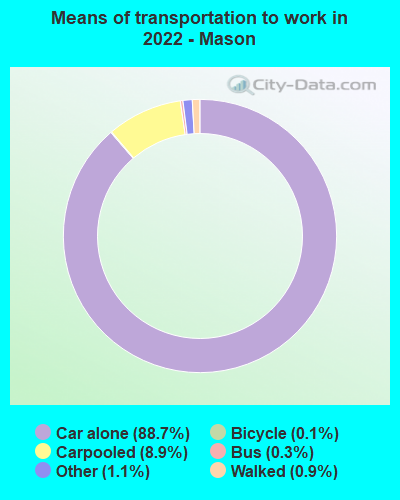
Means of transportation to work:
- Drove a car alone: 22,138 (74.9%)
- Carpooled: 2,388 (8.1%)
- Bus: 64 (0.2%)
- Taxi: 329 (1.1%)
- Bicycle: 37 (0.1%)
- Walked: 215 (0.7%)
- Worked at home: 4,646 (15.7%)
- Unemployment by race in 2022
- Unemployment rate for White non-Hispanic residents
- 0.9%Males
- 1.0%Females
- Unemployment rate for Asian residents
- 5.3%Males
- 0.8%Females
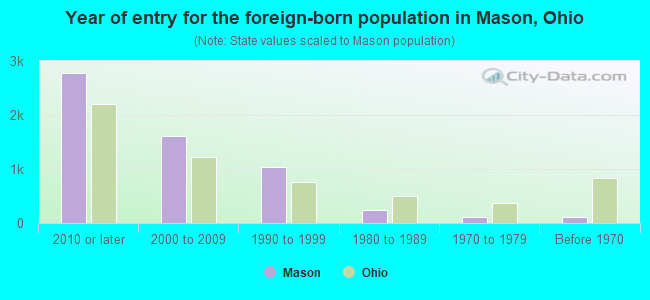
- Year of entry for the foreign-born population in Mason, Ohio
- 2,7802010 or later
- 1,6152000 to 2009
- 1,0351990 to 1999
- 2381980 to 1989
- 1111970 to 1979
- 107Before 1970
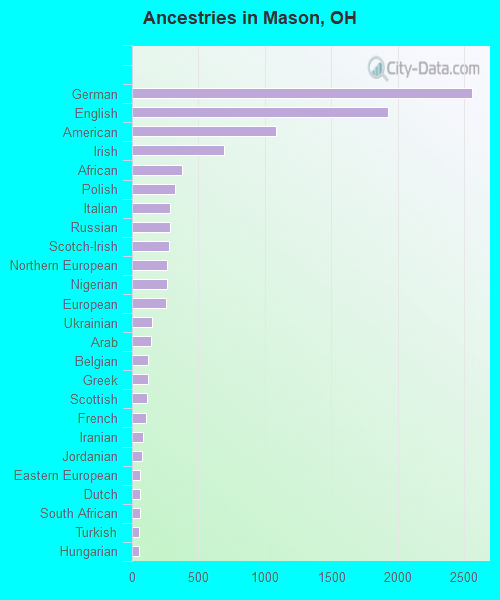
First ancestries reported:
- German: 2,561 (14.2%)
- English: 1,927 (10.7%)
- American: 1,086 (6.0%)
- Irish: 694 (3.9%)
- African: 374 (2.1%)
- Polish: 324 (1.8%)
- Italian: 285 (1.6%)
- Russian: 284 (1.6%)
- Scotch-Irish: 281 (1.6%)
- Northern European: 264 (1.5%)
- Nigerian: 262 (1.5%)
- European: 257 (1.4%)
- Ukrainian: 149 (0.8%)
- Arab: 143 (0.8%)
- Belgian: 120 (0.7%)
- Greek: 119 (0.7%)
- Scottish: 114 (0.6%)
- French: 105 (0.6%)
- Iranian: 84 (0.5%)
- Jordanian: 75 (0.4%)
- Eastern European: 61 (0.3%)
- Dutch: 60 (0.3%)
- South African: 60 (0.3%)
- Turkish: 53 (0.3%)
- Hungarian: 51 (0.3%)
- French Canadian: 45 (0.3%)
- Slovene: 32 (0.2%)
- Ghanaian: 31 (0.2%)
- Swedish: 27 (0.2%)
- Canadian: 26 (0.1%)
- British: 22 (0.1%)
- Slovak: 20 (0.1%)
- Lebanese: 15 (0.08%)
- Yugoslavian: 14 (0.08%)
- Armenian: 10 (0.06%)
- Palestinian: 7 (0.04%)
- Moroccan: 7 (0.04%)
Most common places of birth for foreign-born residents (%):
| Mason: | 33.7% (2,006) |
| Ohio: | 11.6% (66,525) |
| Mason: | 11.1% (661) |
| Ohio: | 6.2% (35,703) |
| Mason: | 5.7% (341) |
| Ohio: | 7.8% (44,796) |
| Mason: | 3.8% (226) |
| Ohio: | 0.1% (700) |
| Mason: | 3.7% (218) |
| Ohio: | 1.5% (8,452) |
| Mason: | 3.3% (197) |
| Ohio: | 2.0% (11,398) |
| Mason: | 3.2% (189) |
| Ohio: | 1.4% (8,101) |
| Mason: | 3.0% (178) |
| Ohio: | 1.0% (5,444) |
| Mason: | 2.4% (141) |
| Ohio: | 1.2% (7,029) |
| Mason: | 2.1% (124) |
| Ohio: | 3.1% (17,818) |
| Mason: | 2.0% (116) |
| Ohio: | 0.2% (1,372) |
| Mason: | 1.9% (113) |
| Ohio: | 0.8% (4,309) |
| Mason: | 1.8% (108) |
| Ohio: | 0.1% (327) |
| Mason: | 1.6% (95) |
| Ohio: | 0.6% (3,552) |
Place of birth for U.S.-born residents:
- This state: 18,079
- Other state: 10,963
- Northeast: 2,950
- Midwest: 3,117
- South: 3,708
- West: 1,103
88.9% of Mason residents lived in the same house 1 years ago.
Out of people who lived in different houses, 20.5% lived in this county.
Out of people who lived in different counties, 64.0% lived in Ohio.
| Mason: | 88.9% |
| State average: | 87.8% |
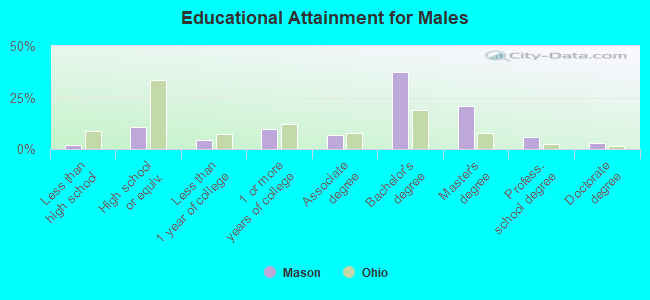
Education attainment for males 25 years and older:
- No schooling: 81
- Nursery to 4th grade: 0
- 5th and 6th grade: 0
- 7th and 8th grade: 20
- 9th grade: 15
- 10th grade: 11
- 11th grade: 78
- 12th grade, no diploma: 38
- High school graduate (or equivalency): 1,232
- Less than 1 year of college: 481
- Some college more than 1 year, no degree: 1,108
- Associate degree: 781
- Bachelor's degree: 4,363
- Master's degree: 2,454
- Professional school degree: 661
- Doctorate degree: 333
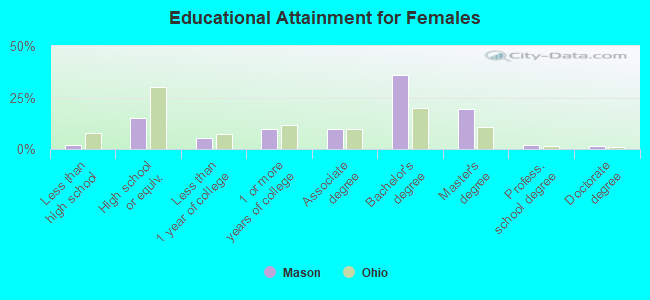
Education attainment for females 25 years and older:
- No schooling: 56
- Nursery to 4th grade: 0
- 5th and 6th grade: 0
- 7th and 8th grade: 37
- 9th grade: 78
- 10th grade: 38
- 11th grade: 19
- 12th grade, no diploma: 48
- High school graduate (or equivalency): 1,927
- Less than 1 year of college: 660
- Some college more than 1 year, no degree: 1,211
- Associate degree: 1,218
- Bachelor's degree: 4,558
- Master's degree: 2,461
- Professional school degree: 241
- Doctorate degree: 213


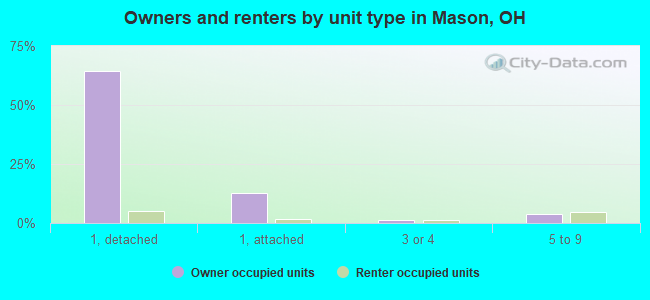
Housing units in structures:
- One, detached: 9,373
- One, attached: 2,276
- Two: 187
- 3 or 4: 473
- 5 to 9: 650
- 10 to 19: 213
- 20 to 49: 14
- 50 or more: 193
- Mobile homes: 54
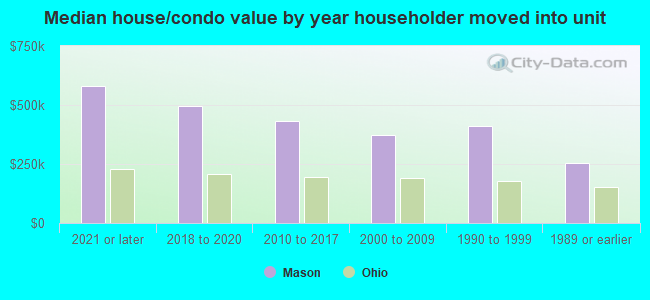
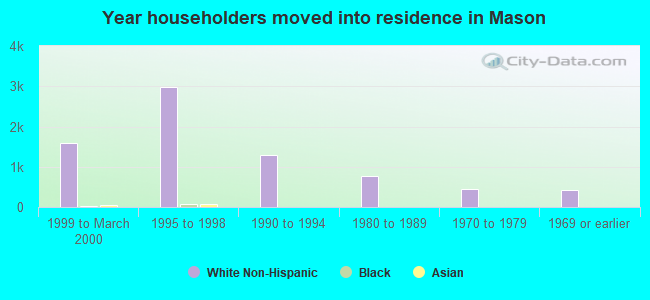
House/condo owner moved in on average 11 years ago
Renter moved in on average 3 years ago
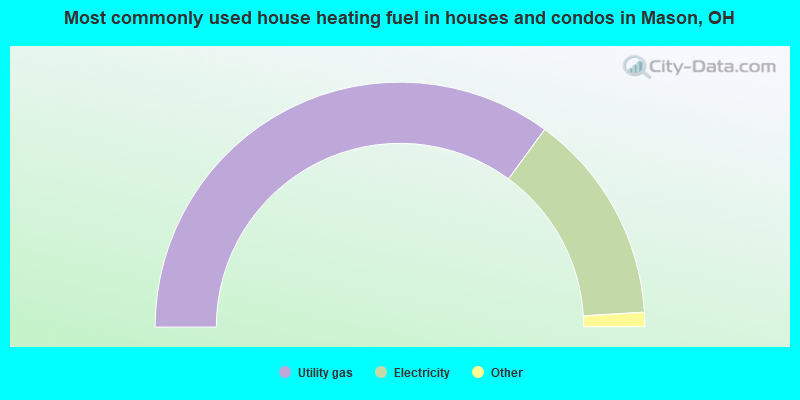
- 70.2%Utility gas
- 28.0%Electricity
- 1.1%Bottled, tank, or LP gas
- 0.5%Fuel oil, kerosene, etc.
- 0.3%Coal or coke
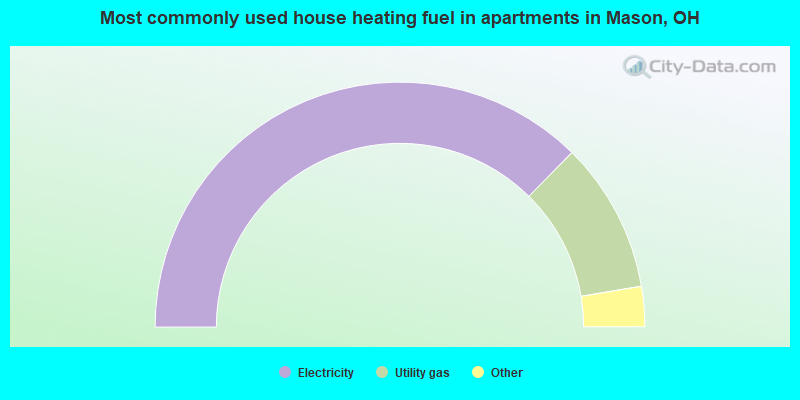
- 74.8%Electricity
- 19.9%Utility gas
- 4.0%No fuel used
- 0.7%Other fuel
- 0.6%Bottled, tank, or LP gas
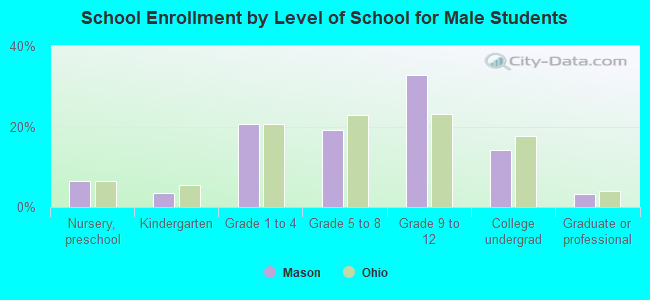
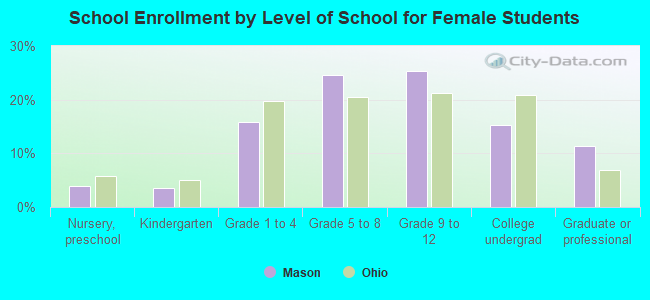
Private vs. public school enrollment:
| Here: | 8.6% |
| Ohio: | 16.0% |
| Here: | 15.8% |
| Ohio: | 13.1% |
| Here: | 8.6% |
| Ohio: | 22.3% |