Melbourne, FL (Florida) Houses and Residents
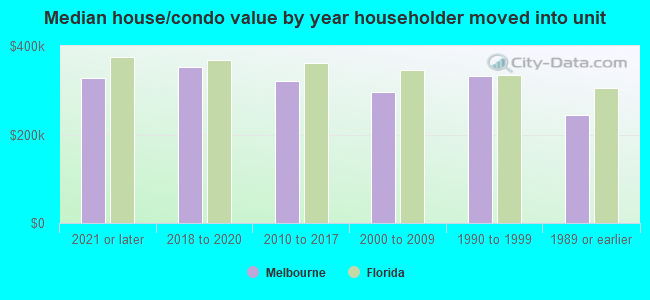
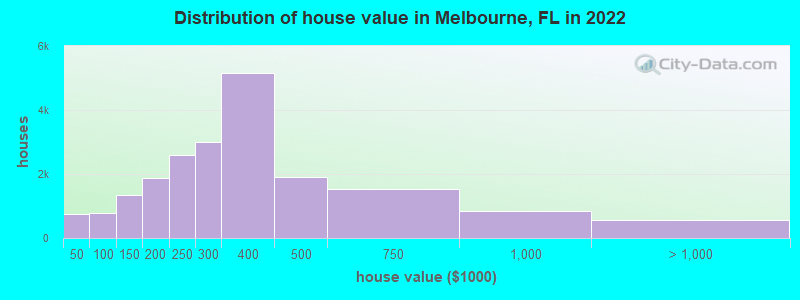
Estimated median house or condo value in 2022: $323,600 (it was $80,300 in 2000 )
Melbourne:
$323,600Florida:
$354,100
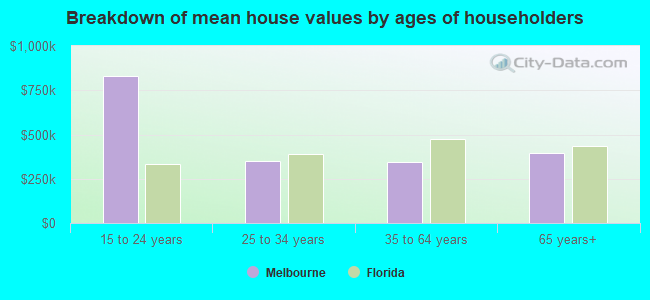
Lower value quartile - upper value quartile: $242,000 - $417,500Mean price in 2022: Detached houses: $357,510 Here:
$357,510State:
$500,941
Townhouses or other attached units: $540,178 Here:
$540,178State:
$370,869
In 2-unit structures: $166,998 Here:
$166,998State:
$423,188
In 3-to-4-unit structures: $213,423 Here:
$213,423State:
$309,944
In 5-or-more-unit structures: $186,948 Here:
$186,948State:
$447,145
Mobile homes: $21,657 Here:
$21,657State:
$113,202
Occupied boats, RVs, vans, etc.: $96,719 Here:
$96,719State:
$73,933
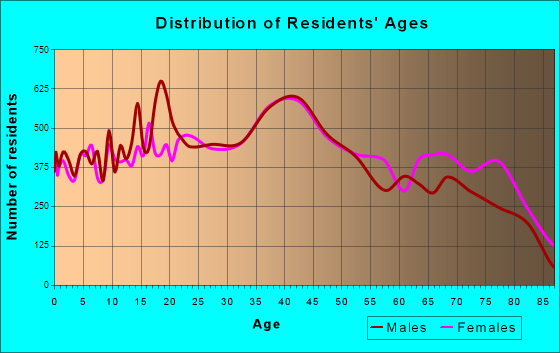
Total population: 78,490 (Urban population: 71,350, Rural population: 21 (all nonfarm) )
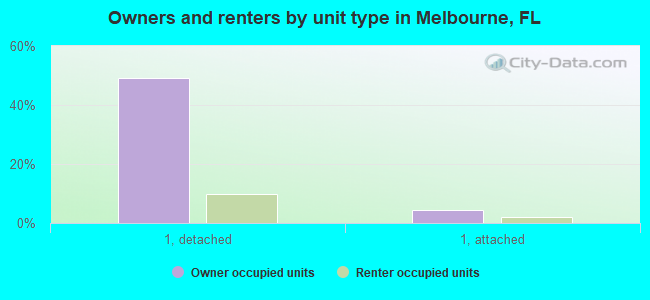
Houses: 40,675 (37,902 occupied: 23,682 owner occupied, 14,220 renter occupied )
% of renters here:
38%State:
33%
Housing density: 1,347 houses/condos per square mile
Median price asked for vacant for-sale houses and condos in 2022: $197,226.
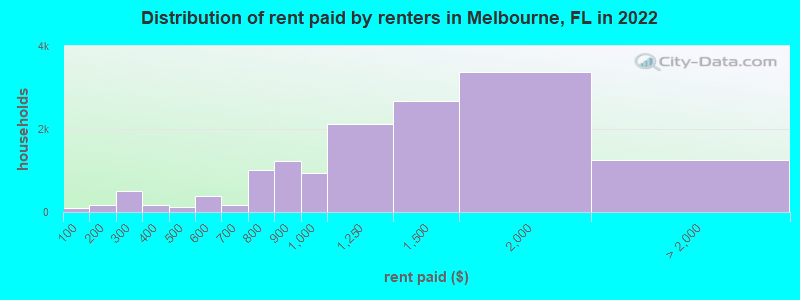
Median contract rent in 2022: $1,251 (lower quartile is $868, upper quartile is $1,619)
Median rent asked for vacant for-rent units in 2022: $726
Median gross rent in Melbourne, FL in 2022: $1,350
Housing units in Melbourne with a mortgage: 14,215 (786 second mortgage, 0 home equity loan, 563 both second mortgage and home equity loan )Houses without a mortgage: 608
Median household income for houses/condos with a mortgage: $105,271
Median household income for apartments without a mortgage: $52,568
Median monthly housing costs: $1,210
Data:
Median house or condo value ($)
Median house or condo value ($ change since 2000)
Median house or condo value ($) - White
Median house or condo value ($) - Black or African American
Median house or condo value ($) - Asian
Median house or condo value ($) - Hispanic or Latino
Median house or condo value ($) - American Indian and Alaska Native
Median house or condo value ($) - Multirace
Median house or condo value ($) - Other Race
Median price asked for mobile homes ($)
Household density (households per square mile)
Mean house or condo value by units in structure - 1, detached ($)
Mean house or condo value by units in structure - 1, attached ($)
Mean house or condo value by units in structure - 2 ($)
Mean house or condo value by units in structure by units in structure - 3 or 4 ($)
Mean house or condo value by units in structure - 5 or more ($)
Mean house or condo value by units in structure - Boat, RV, van, etc. ($)
Mean house or condo value by units in structure - Mobile home ($)
Median contract rent ($)
Median contract rent - Lower quartile ($)
Median contract rent - Upper quartile ($)
Median gross rent ($)
Urban houses (%)
Rural houses (%)
Houses occupied (%)
Houses occupied (% change since 2000)
Houses owner occupied (%)
Houses owner occupied (% change since 2000)
Houses renter occupied (%)
Houses renter occupied (% change since 2000)
Vacant housing units - For rent (%)
Vacant housing units - For rent (% change since 2000)
Vacant housing units - For sale only (%)
Vacant housing units - For sale only (% change since 2000)
Vacant housing units - Rented or sold, not occupied (%)
Vacant housing units - Rented or sold, not occupied (% change since 2000)
Vacant housing units - For seasonal, recreational, or occasional use (%)
Vacant housing units - For seasonal, recreational, or occasional use (% change since 2000)
Vacant housing units - For migrant workers (%)
Vacant housing units - For migrant workers (% change since 2000)
Vacant housing units - Other vacant (%)
Vacant housing units - Other vacant (% change since 2000)
Median monthly housing costs ($)
Median household income for houses/condos with a mortgage ($)
Median household income for houses/condos without a mortgage ($)
Median household income ($)
Median household income ($) - White
Median household income ($) - Black or African American
Median household income ($) - Asian
Median household income ($) - Hispanic or Latino
Median household income ($) - American Indian and Alaska Native
Median household income ($) - Multirace
Median household income ($) - Other Race
Mortgage status - with mortgage (%)
Mortgage status - with second mortgage (%)
Mortgage status - with home equity loan (%)
Mortgage status - with both second mortgage and home equity loan (%)
Mortgage status - without a mortgage (%)
Median year house/condo built
Median year apartment built
Household type by relationship - Male householder living alone (%)
Household type by relationship - Male householder not living alone (%)
Household type by relationship - Female householder living alone (%)
Household type by relationship - Female householder not living alone (%)
Household type by relationship - Opposite-Sex spouse (%)
Household type by relationship - Same-Sex spouse (%)
Household type by relationship - Opposite-Sex unmarried partner (%)
Household type by relationship - Same-Sex unmarried partner (%)
Household type by relationship - In group quarters (%)
Size of family households - 2-person household (%)
Size of family households - 3-person household (%)
Size of family households - 4-person household (%)
Size of family households - 5-person household (%)
Size of family households - 6-person household (%)
Size of family households - 7-or-more-person household (%)
Size of nonfamily households - 1-person household (%)
Size of nonfamily households - 2-person household (%)
Size of nonfamily households - 3-person household (%)
Size of nonfamily households - 4-person household (%)
Size of nonfamily households - 5-person household (%)
Size of nonfamily households - 6-person household (%)
Size of nonfamily households - 7-or-moreperson household (%)
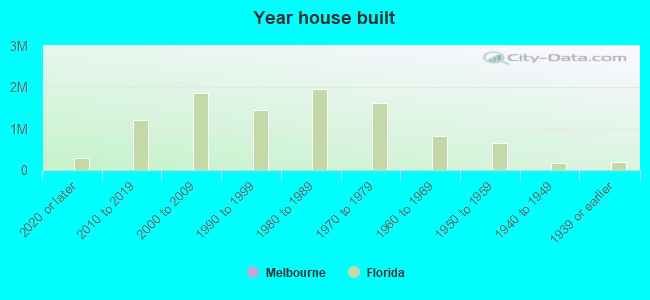
Year house built - Built 2010 or later (%)
Year house built - Built 2000 to 2009 (%)
Year house built - Built 1990 to 1999 (%)
Year house built - Built 1980 to 1989 (%)
Year house built - Built 1970 to 1979 (%)
Year house built - Built 1960 to 1969 (%)
Year house built - Built 1950 to 1959 (%)
Year house built - Built 1940 to 1949 (%)
Year house built - Built 1939 or earlier (%)
Median number of rooms in houses and condos
Median number of rooms in apartments
Median number of bedrooms in owner occupied houses
Mean number of bedrooms in owner occupied houses
Median number of bedrooms in renter occupied houses
Mean number of bedrooms in renter occupied houses
Median number of vehichles in owner occupied houses
Mean number of vehichles in owner occupied houses
Median number of vehichles in renter occupied houses
Mean number of vehichles in renter occupied houses
Rooms in owner-occupied houses - 1 room (%)
Rooms in owner-occupied houses - 2 rooms (%)
Rooms in owner-occupied houses - 3 rooms (%)
Rooms in owner-occupied houses - 4 rooms (%)
Rooms in owner-occupied houses - 5 rooms (%)
Rooms in owner-occupied houses - 6 rooms (%)
Rooms in owner-occupied houses - 7 rooms (%)
Rooms in owner-occupied houses - 8 rooms (%)
Rooms in owner-occupied houses - 9+ rooms (%)
Rooms in renter-occupied houses - 1 room (%)
Rooms in renter-occupied houses - 2 rooms (%)
Rooms in renter-occupied houses - 3 rooms (%)
Rooms in renter-occupied houses - 4 rooms (%)
Rooms in renter-occupied houses - 5 rooms (%)
Rooms in renter-occupied houses - 6 rooms (%)
Rooms in renter-occupied houses - 7 rooms (%)
Rooms in renter-occupied houses - 8 rooms (%)
Rooms in renter-occupied houses - 9+ rooms (%)
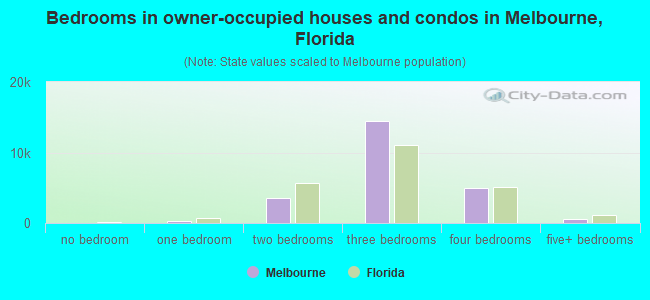
Bedrooms in owner-occupied houses - no bedrooms (%)
Bedrooms in owner-occupied houses - 1 bedroom (%)
Bedrooms in owner-occupied houses - 2 bedrooms (%)
Bedrooms in owner-occupied houses - 3 bedrooms (%)
Bedrooms in owner-occupied houses - 4 bedrooms (%)
Bedrooms in owner-occupied houses - 5+ bedrooms (%)
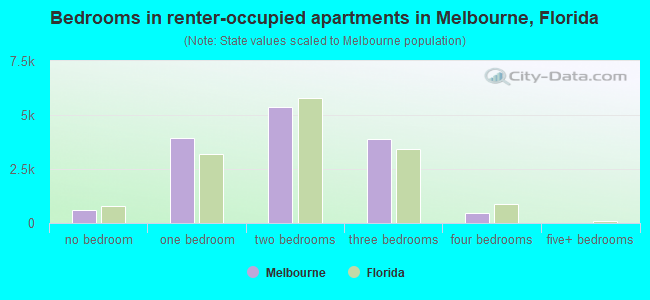
Bedrooms in renter-occupied houses - no bedrooms (%)
Bedrooms in renter-occupied houses - 1 bedroom (%)
Bedrooms in renter-occupied houses - 2 bedrooms (%)
Bedrooms in renter-occupied houses - 3 bedrooms (%)
Bedrooms in renter-occupied houses - 4 bedrooms (%)
Bedrooms in renter-occupied houses - 5+ bedrooms (%)
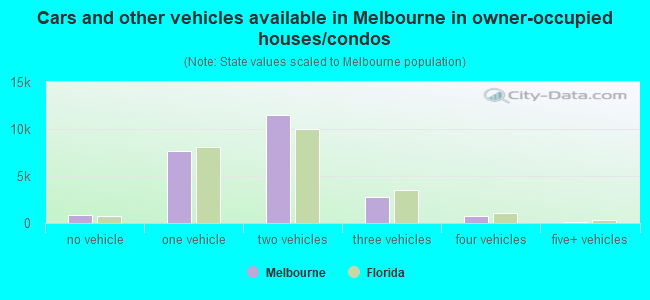
Vehicles available in owner-occupied houses - no vehicle available (%)
Vehicles available in owner-occupied houses - 1 vehicle available(%)
Vehicles available in owner-occupied houses - 2 Vehicles available (%)
Vehicles available in owner-occupied houses - 3 Vehicles available (%)
Vehicles available in owner-occupied houses - 4 Vehicles available (%)
Vehicles available in owner-occupied houses - 5+ Vehicles available (%)
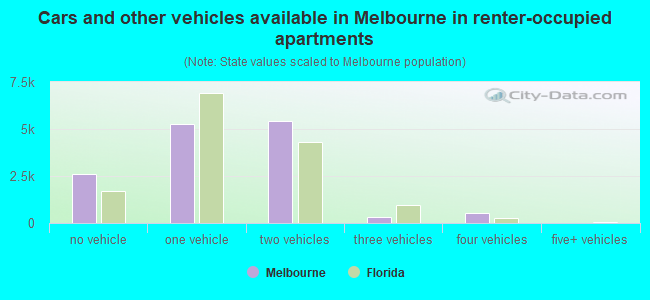
Vehicles available in renter-occupied houses - no vehicle available (%)
Vehicles available in renter-occupied houses - 1 vehicle available (%)
Vehicles available in renter-occupied houses - 2 Vehicles available (%)
Vehicles available in renter-occupied houses - 3 Vehicles available (%)
Vehicles available in renter-occupied houses - 4 Vehicles available (%)
Vehicles available in renter-occupied houses - 5+ Vehicles available (%)
Housing units in structures - 1, detached (%)
Housing units in structures - 1, attached (%)
Housing units in structures - 2 (%)
Housing units in structures - 3 or 4 (%)
Housing units in structures - 5 to 9 (%)
Housing units in structures - 10 to 19 (%)
Housing units in structures - 20 to 49 (%)
Housing units in structures - 50 or more (%)
Housing units in structures - Mobile home (%)
Housing units in structures - Boat, RV, van, etc. (%)
Housing units in structures - Owners - 1, detached (%)
Housing units in structures - Owners - 1, attached (%)
Housing units in structures - Owners - 2 (%)
Housing units in structures - Owners - 3 or 4 (%)
Housing units in structures - Owners - 5 to 9 (%)
Housing units in structures - Owners - 10 to 19 (%)
Housing units in structures - Owners - 20 to 49 (%)
Housing units in structures - Owners - 50 or more (%)
Housing units in structures - Owners - Mobile home (%)
Housing units in structures - Owners - Boat, RV, van, etc. (%)
Housing units in structures - Renters - 1, detached (%)
Housing units in structures - Renters - 1, attached (%)
Housing units in structures - Renters - 2 (%)
Housing units in structures - Renters - 3 or 4 (%)
Housing units in structures - Renters - 5 to 9 (%)
Housing units in structures - Renters - 10 to 19 (%)
Housing units in structures - Renters - 20 to 49 (%)
Housing units in structures - Renters - 50 or more (%)
Housing units in structures - Renters - Mobile home (%)
Housing units in structures - Renters - Boat, RV, van, etc. (%)
House/condo owner moved in on average (years ago)
Renter moved in on average (years ago)
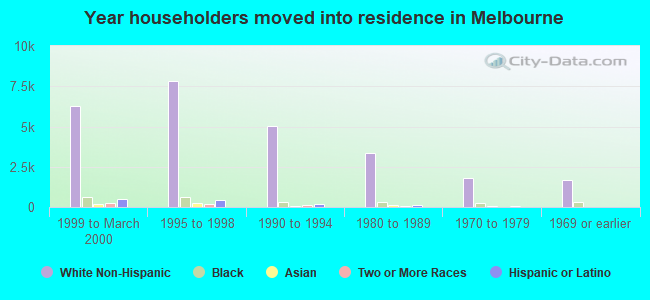
Year householder moved into unit - Moved in 1999 to March 2000 (%)
Year householder moved into unit - Moved in 1999 to March 2000 (%) - White
Year householder moved into unit - Moved in 1999 to March 2000 (%) - Black or African American
Year householder moved into unit - Moved in 1999 to March 2000 (%) - Asian
Year householder moved into unit - Moved in 1999 to March 2000 (%) - Hispanic or Latino
Year householder moved into unit - Moved in 1999 to March 2000 (%) - American Indian and Alaska Native
Year householder moved into unit - Moved in 1999 to March 2000 (%) - Multirace
Year householder moved into unit - Moved in 1999 to March 2000 (%) - Other Race
Year householder moved into unit - Moved in 1995 to 1998 (%)
Year householder moved into unit - Moved in 1995 to 1998 (%) - White
Year householder moved into unit - Moved in 1995 to 1998 (%) - Black or African American
Year householder moved into unit - Moved in 1995 to 1998 (%) - Asian
Year householder moved into unit - Moved in 1995 to 1998 (%) - Hispanic or Latino
Year householder moved into unit - Moved in 1995 to 1998 (%) - American Indian and Alaska Native
Year householder moved into unit - Moved in 1995 to 1998 (%) - Multirace
Year householder moved into unit - Moved in 1995 to 1998 (%) - Other Race
Year householder moved into unit - Moved in 1990 to 1994 (%)
Year householder moved into unit - Moved in 1990 to 1994 (%) - White
Year householder moved into unit - Moved in 1990 to 1994 (%) - Black or African American
Year householder moved into unit - Moved in 1990 to 1994 (%) - Asian
Year householder moved into unit - Moved in 1990 to 1994 (%) - Hispanic or Latino
Year householder moved into unit - Moved in 1990 to 1994 (%) - American Indian and Alaska Native
Year householder moved into unit - Moved in 1990 to 1994 (%) - Multirace
Year householder moved into unit - Moved in 1990 to 1994 (%) - Other Race
Year householder moved into unit - Moved in 1980 to 1989 (%)
Year householder moved into unit - Moved in 1980 to 1989 (%) - White
Year householder moved into unit - Moved in 1980 to 1989 (%) - Black or African American
Year householder moved into unit - Moved in 1980 to 1989 (%) - Asian
Year householder moved into unit - Moved in 1980 to 1989 (%) - Hispanic or Latino
Year householder moved into unit - Moved in 1980 to 1989 (%) - American Indian and Alaska Native
Year householder moved into unit - Moved in 1980 to 1989 (%) - Multirace
Year householder moved into unit - Moved in 1980 to 1989 (%) - Other Race
Year householder moved into unit - Moved in 1970 to 1979 (%)
Year householder moved into unit - Moved in 1970 to 1979 (%) - White
Year householder moved into unit - Moved in 1970 to 1979 (%) - Black or African American
Year householder moved into unit - Moved in 1970 to 1979 (%) - Asian
Year householder moved into unit - Moved in 1970 to 1979 (%) - Hispanic or Latino
Year householder moved into unit - Moved in 1970 to 1979 (%) - American Indian and Alaska Native
Year householder moved into unit - Moved in 1970 to 1979 (%) - Multirace
Year householder moved into unit - Moved in 1970 to 1979 (%) - Other Race
Year householder moved into unit - Moved in 1969 or earlier (%)
Year householder moved into unit - Moved in 1969 or earlier (%) - White
Year householder moved into unit - Moved in 1969 or earlier (%) - Black or African American
Year householder moved into unit - Moved in 1969 or earlier (%) - Asian
Year householder moved into unit - Moved in 1969 or earlier (%) - Hispanic or Latino
Year householder moved into unit - Moved in 1969 or earlier (%) - American Indian and Alaska Native
Year householder moved into unit - Moved in 1969 or earlier (%) - Multirace
Year householder moved into unit - Moved in 1969 or earlier (%) - Other Race
Housing units lacking complete plumbing facilities (%)
Housing units lacking complete kitchen facilities (%)
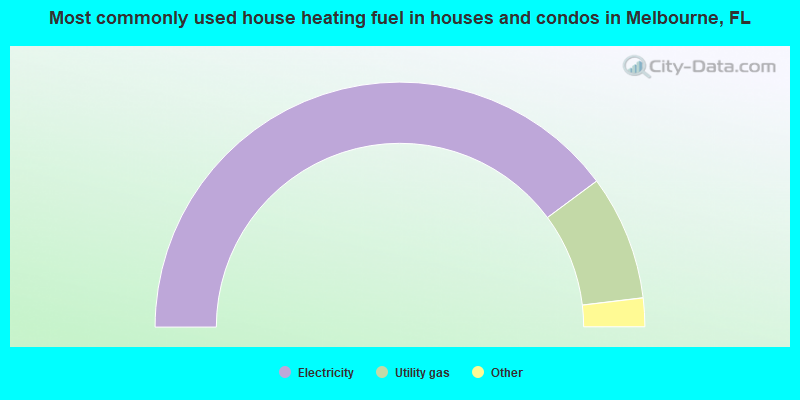
House heating fuel used in houses and condos - Utility gas (%)
House heating fuel used in houses and condos - Bottled, tank, or LP gas (%)
House heating fuel used in houses and condos - Electricity (%)
House heating fuel used in houses and condos - Fuel oil, kerosene, etc. (%)
House heating fuel used in houses and condos - Coal or coke (%)
House heating fuel used in houses and condos - Wood (%)
House heating fuel used in houses and condos - Solar energy (%)
House heating fuel used in houses and condos - Other fuel (%)
House heating fuel used in houses and condos - No fuel used (%)
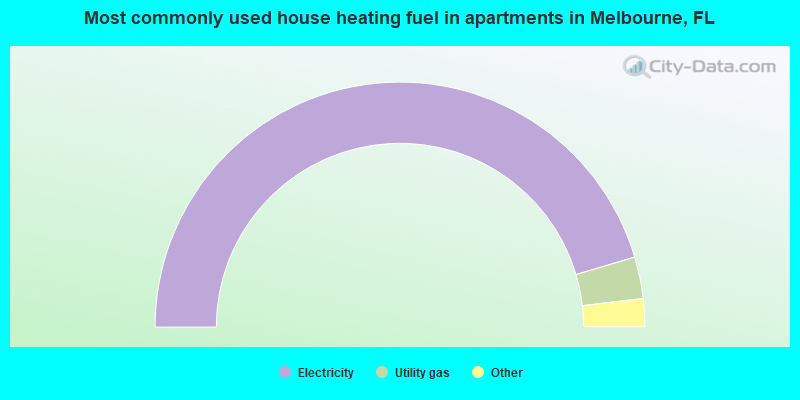
House heating fuel used in apartments - Utility gas (%)
House heating fuel used in apartments - Bottled, tank, or LP gas (%)
House heating fuel used in apartments - Electricity (%)
House heating fuel used in apartments - Fuel oil, kerosene, etc. (%)
House heating fuel used in apartments - Coal or coke (%)
House heating fuel used in apartments - Wood (%)
House heating fuel used in apartments - Solar energy (%)
House heating fuel used in apartments - Other fuel (%)
House heating fuel used in apartments - No fuel used (%)
Latest news about housing in Melbourne, FL collected exclusively by city-data.com from local newspapers, TV, and radio stations
Median year house/condo built: 1985Median year apartment built: 1981Household type by relationship:
Households: 86,439
Male householders: 18,408 (6,586 living alone ), Female householders: 19,494 (7,283 living alone )15,265 spouses (15,053 opposite-sex spouses ), 3,029 unmarried partners , (2,888 opposite-sex unmarried partners ), 18,010 children (17,286 natural , 501 adopted , 223 stepchildren ), 1,606 grandchildren , 1,205 brothers or sisters , 2,236 parents , 0 foster children , 1,143 other relatives , 2,449 non-relatives In group quarters: 3,594
Size of family households: 10,353 2-persons , 5,132 3-persons , 2,524 4-persons , 1,268 5-persons , 591 6-persons , 290 7-or-more-persons .
Size of nonfamily households: 13,000 1-person , 2,988 2-persons , 434 3-persons , 287 4-persons , 25 5-persons .
6,795 married couples with children. single-parent households (712 men , 2,966 women ).
86.4% of residents of Melbourne speak English at home. of residents speak Spanish at home (60% speak English very well , 16% speak English well , 15% speak English not well , 9% don't speak English at all ).of residents speak other Indo-European language at home (74% speak English very well , 12% speak English well , 8% speak English not well , 6% don't speak English at all ).of residents speak Asian or Pacific Island language at home (51% speak English very well , 34% speak English well , 12% speak English not well , 4% don't speak English at all ).of residents speak other language at home (56% speak English very well , 31% speak English well , 7% speak English not well , 7% don't speak English at all ).
Foreign born population: 10,903 (12.6%)of them are naturalized citizens )
Median number of rooms in houses and condos:
Median number of rooms in apartments
Owner-occupied Renter-occupied
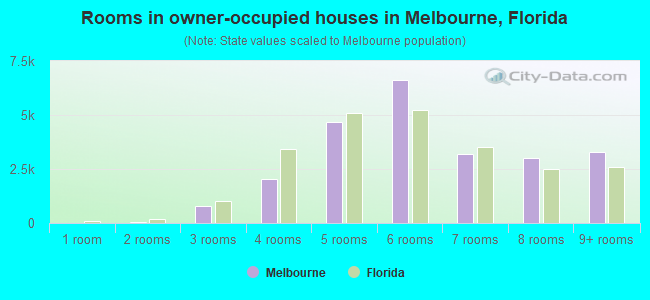
Rooms in owner-occupied houses in Melbourne, Florida
0 1 room 66 2 rooms 786 3 rooms 2,053 4 rooms 4,682 5 rooms 6,643 6 rooms 3,175 7 rooms 2,994 8 rooms 3,283 9+ rooms
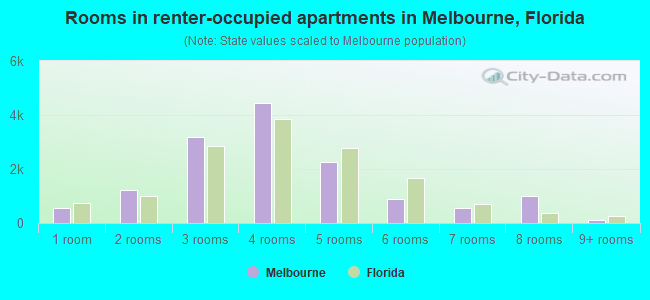
Rooms in renter-occupied apartments in Melbourne, Florida
540 1 room 1,215 2 rooms 3,190 3 rooms 4,449 4 rooms 2,246 5 rooms 907 6 rooms 559 7 rooms 1,008 8 rooms 106 9+ rooms
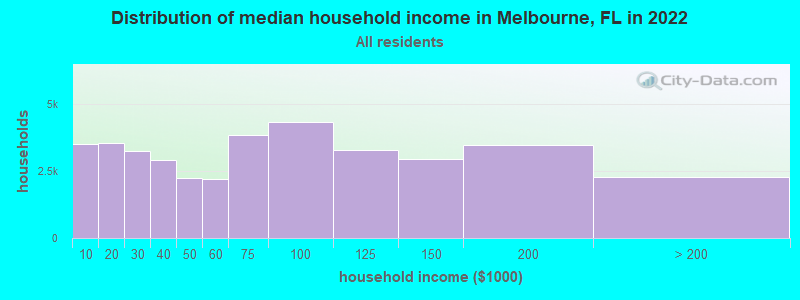
Melbourne, FL household income distribution 3,512 Less than $10,0003,543 $10,000 to $19,9993,247 $20,000 to $29,9992,924 $30,000 to $39,9992,234 $40,000 to $49,9992,195 $50,000 to $59,9993,855 $60,000 to $74,9994,339 $75,000 to $99,9993,310 $100,000 to $124,9992,970 $125,000 to $149,9993,479 $150,000 to $199,9992,294 $200,000 or more
Home value of owner - occupied houses in 2022 in Melbourne, FL 190 Less than $10,00048 $10,000 to $14,999117 $15,000 to $19,99930 $20,000 to $24,999166 $25,000 to $29,99980 $30,000 to $34,99928 $35,000 to $39,99986 $40,000 to $49,999103 $50,000 to $59,99929 $60,000 to $69,999103 $70,000 to $79,999266 $80,000 to $89,999192 $90,000 to $99,999511 $100,000 to $124,999844 $125,000 to $149,999964 $150,000 to $174,999896 $175,000 to $199,9992,603 $200,000 to $249,9993,014 $250,000 to $299,9995,146 $300,000 to $399,9991,912 $400,000 to $499,9991,529 $500,000 to $749,999835 $750,000 to $999,999425 $1,000,000 to $1,499,99947 $1,500,000 to $1,999,99991 $2,000,000 or moreRent paid by renters in 2022 in Melbourne, FL 96 Less than $100168 $150 to $199297 $200 to $249216 $250 to $299172 $350 to $399118 $400 to $449322 $500 to $54964 $550 to $599103 $600 to $64957 $650 to $699852 $700 to $749163 $750 to $7991,232 $800 to $899950 $900 to $9992,112 $1,000 to $1,2492,671 $1,250 to $1,4993,370 $1,500 to $1,999584 $2,000 to $2,49993 $2,500 to $2,999216 $3,500 or more364 No cash rent
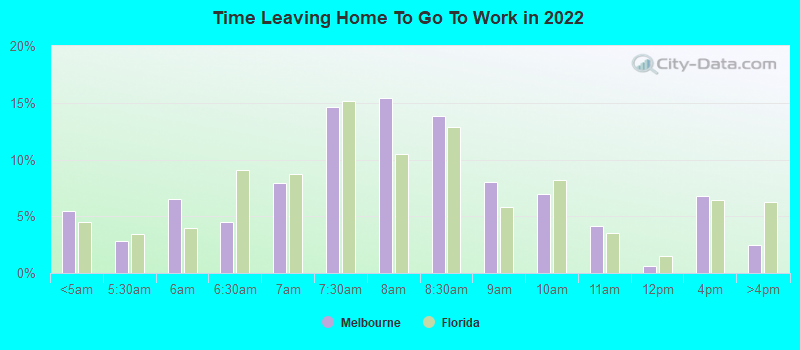
Percentage of workers working in this county: 97.6%Number of people working at home: 6,585 (15.8% of all workers )
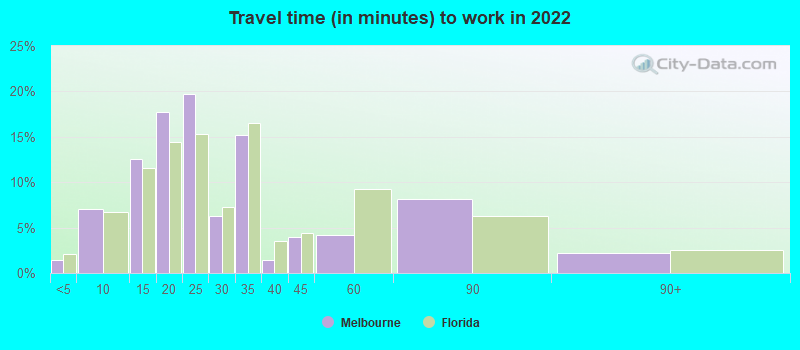
Travel time to work (commute)
Less than 5 minutes: 5885 to 9 minutes: 3,07310 to 14 minutes: 4,39115 to 19 minutes: 8,16320 to 24 minutes: 6,49625 to 29 minutes: 1,64930 to 34 minutes: 5,90035 to 39 minutes: 68740 to 44 minutes: 1,57645 to 59 minutes: 2,11560 to 89 minutes: 84290 or more minutes: 604
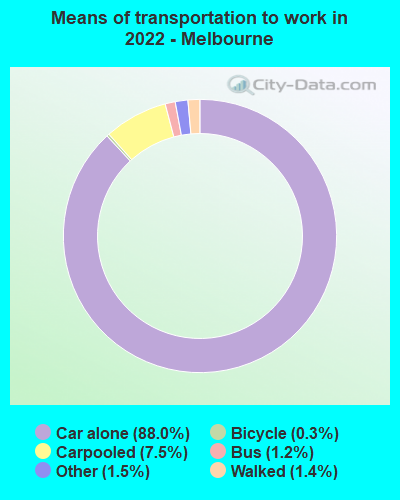
Means of transportation to work:
Drove a car alone: 55,753 (76.6%)Carpooled: 4,932 (6.8%)Bus : 1,190 (1.6%)Subway or elevated rail : 1 (0.0%)Ferryboat: 32 (0.0%)Taxi: 1,348 (1.9%)Bicycle: 203 (0.3%)Walked: 976 (1.3%)Worked at home: 6,585 (9.0%)
Unemployment by race in 2022
Unemployment rate for White non-Hispanic residents 5.9% Males5.3% FemalesUnemployment rate for Black residents 11.1% Males5.4% FemalesUnemployment rate for Asian residents 14.5% Males3.2% FemalesUnemployment rate for other race residents 2.6% FemalesUnemployment rate for two or more race residents 3.1% Males2.5% FemalesUnemployment rate for Hispanic or Latino residents 2.1% Males1.9% Females
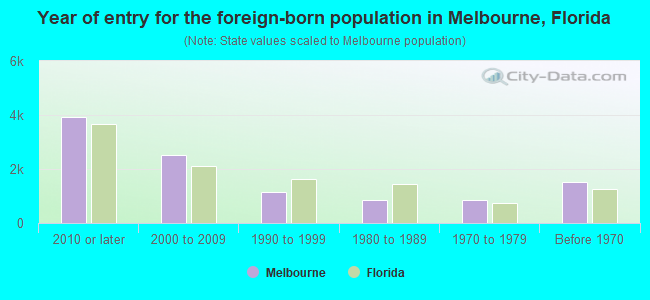
Year of entry for the foreign-born population in Melbourne, Florida
3,939 2010 or later 2,503 2000 to 2009 1,160 1990 to 1999 867 1980 to 1989 847 1970 to 1979 1,506 Before 1970
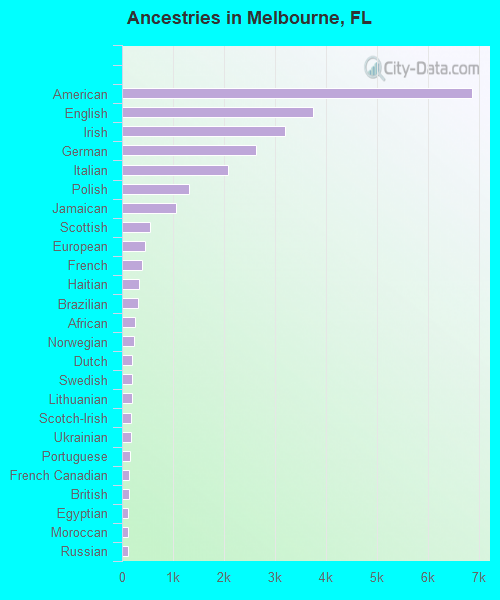
First ancestries reported:
American: 6,861 (16.6%)
English: 3,744 (9.1%)
Irish: 3,204 (7.8%)
German: 2,639 (6.4%)
Italian: 2,071 (5.0%)
Polish: 1,319 (3.2%)
Jamaican: 1,064 (2.6%)
Scottish: 552 (1.3%)
European: 453 (1.1%)
French: 398 (1.0%)
Haitian: 325 (0.8%)
Brazilian: 315 (0.8%)
African: 264 (0.6%)
Norwegian: 234 (0.6%)
Dutch: 202 (0.5%)
Swedish: 199 (0.5%)
Lithuanian: 190 (0.5%)
Scotch-Irish: 185 (0.4%)
Ukrainian: 167 (0.4%)
Portuguese: 155 (0.4%)
French Canadian: 131 (0.3%)
British: 128 (0.3%)
Egyptian: 123 (0.3%)
Moroccan: 122 (0.3%)
Russian: 114 (0.3%)
Greek: 106 (0.3%)
Scandinavian: 105 (0.3%)
Welsh: 100 (0.2%)
Canadian: 92 (0.2%)
Australian: 88 (0.2%)
Danish: 81 (0.2%)
Kenyan: 76 (0.2%)
Czech: 75 (0.2%)
West Indian: 75 (0.2%)
New Zealander: 71 (0.2%)
Lebanese: 69 (0.2%)
Hungarian: 64 (0.2%)
Slovak: 63 (0.2%)
Nigerian: 61 (0.1%)
Eastern European: 60 (0.1%)
Arab: 47 (0.1%)
Finnish: 46 (0.1%)
British West Indian: 45 (0.1%)
Cape Verdean: 44 (0.1%)
Bahamian: 41 (0.10%)
Israeli: 33 (0.08%)
Basque: 32 (0.08%)
Austrian: 30 (0.07%)
Maltese: 27 (0.07%)
Ethiopian: 25 (0.06%)
Turkish: 25 (0.06%)
Czechoslovakian: 16 (0.04%)
Dutch West Indian: 16 (0.04%)
Swiss: 13 (0.03%)
Trinidadian and Tobagonian: 13 (0.03%)
Jordanian: 12 (0.03%)
Northern European: 11 (0.03%)
Croatian: 11 (0.03%)
Pennsylvania German: 8 (0.02%)
Celtic: 8 (0.02%)
Most common places of birth for foreign-born residents (%): Mexico Melbourne:
6.6% (667)Florida:
5.6% (257,152)
Jamaica Melbourne:
5.9% (591)Florida:
5.0% (227,319)
Philippines Melbourne:
5.1% (512)Florida:
1.8% (84,403)
Brazil Melbourne:
4.4% (445)Florida:
2.7% (122,906)
Vietnam Melbourne:
4.4% (444)Florida:
1.3% (60,604)
Colombia Melbourne:
4.4% (439)Florida:
6.5% (298,669)
India Melbourne:
4.3% (429)Florida:
2.1% (94,349)
England Melbourne:
3.6% (357)Florida:
0.8% (37,723)
Germany Melbourne:
3.5% (355)Florida:
1.2% (54,272)
Venezuela Melbourne:
3.3% (331)Florida:
5.7% (262,042)
Guatemala Melbourne:
2.8% (277)Florida:
2.1% (97,632)
Poland Melbourne:
2.6% (258)Florida:
0.6% (25,219)
Canada Melbourne:
2.4% (238)Florida:
2.4% (109,132)
China, excluding Hong Kong and Taiwan Melbourne:
2.3% (229)Florida:
1.2% (56,071)
Honduras Melbourne:
2.3% (227)Florida:
2.3% (107,160)
Cuba Melbourne:
2.1% (215)Florida:
22.0% (1,006,576)
Haiti Melbourne:
2.1% (212)Florida:
7.5% (342,375)
Korea Melbourne:
2.0% (205)Florida:
0.4% (19,445)
Dominican Republic Melbourne:
2.0% (199)Florida:
3.0% (137,727)
Saudi Arabia Melbourne:
1.6% (164)Florida:
0.1% (4,597)
Place of birth for U.S.-born residents:
This state: 24,887Other state: 47,628Northeast: 17,820Midwest: 14,479South: 12,178West: 3,151 79.7% of Melbourne residents lived in the same house 1 years ago.
Out of people who lived in different houses, 31.4% lived in this county.
Out of people who lived in different counties, 26.2% lived in Florida.
Melbourne:
79.7%State average:
86.3%
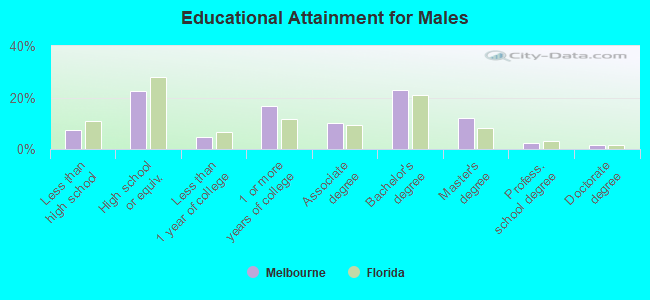
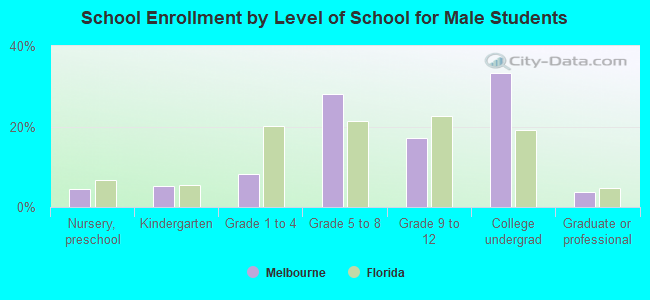
Education attainment for males 25 years and older:
No schooling: 262Nursery to 4th grade: 05th and 6th grade: 2147th and 8th grade: 09th grade: 4410th grade: 58211th grade: 51312th grade, no diploma: 673High school graduate (or equivalency): 7,203Less than 1 year of college: 1,502Some college more than 1 year, no degree: 5,370Associate degree: 3,160Bachelor's degree: 7,232Master's degree: 3,869Professional school degree: 715Doctorate degree: 469
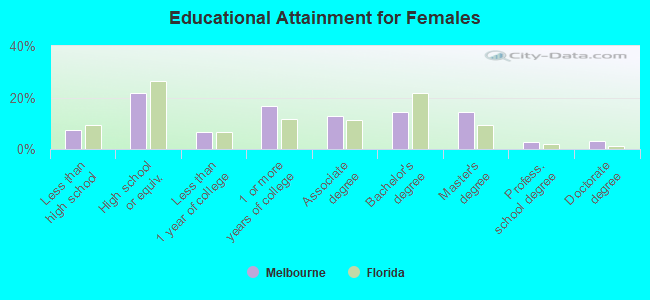
Education attainment for females 25 years and older:
No schooling: 672Nursery to 4th grade: 05th and 6th grade: 1387th and 8th grade: 1749th grade: 29710th grade: 27911th grade: 5212th grade, no diploma: 809High school graduate (or equivalency): 7,178Less than 1 year of college: 2,186Some college more than 1 year, no degree: 5,500Associate degree: 4,145Bachelor's degree: 4,728Master's degree: 4,664Professional school degree: 905Doctorate degree: 1,014
Housing units in structures:
One, detached: 25,088One, attached: 2,222Two: 8413 or 4: 2,4365 to 9: 2,31610 to 19: 2,87320 to 49: 1,46050 or more: 2,060Mobile homes: 1,379Median worth of mobile homes: $27,600
Housing units lacking complete plumbing facilities in 2022: 0.7%Housing units lacking complete kitchen facilities in 2022: 1.0%House/condo owner moved in on average 8 years ago
Renter moved in on average 2 years ago
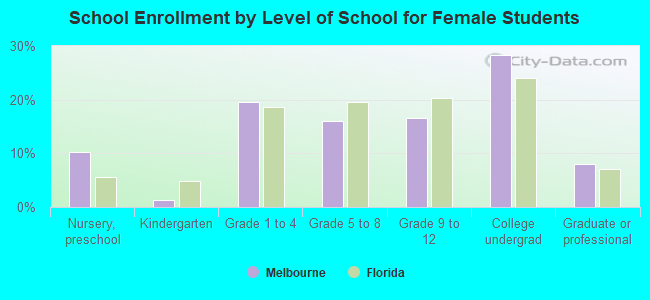
Private vs. public school enrollment:
Students in private schools in grades 1 to 8 (elementary and middle school): 2,000 Students in private schools in grades 9 to 12 (high school): 247 Students in private undergraduate colleges: 3,112