Memphis, TN (Tennessee) Houses and Residents
Estimated median house or condo value in 2022: $173,400 (it was $72,300 in 2000 )
Memphis:
$173,400Tennessee:
$284,800
Lower value quartile - upper value quartile: $95,200 - $295,300Mean price in 2022: Detached houses: $259,313 Here:
$259,313State:
$374,382
Townhouses or other attached units: $295,462 Here:
$295,462State:
$354,101
In 2-unit structures: $308,890 Here:
$308,890State:
$247,693
In 3-to-4-unit structures: $98,763 Here:
$98,763State:
$239,060
In 5-or-more-unit structures: $217,893 Here:
$217,893State:
$317,434
Mobile homes: $156,147 Here:
$156,147State:
$101,421
Occupied boats, RVs, vans, etc.: $570,688 Here:
$570,688State:
$142,822
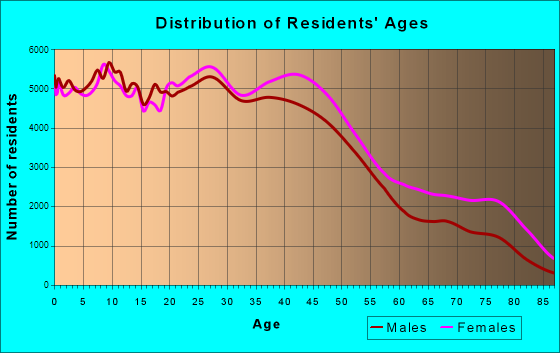
Total population: 656,861 (Urban population: 649,352, Rural population: 493 (all nonfarm) )
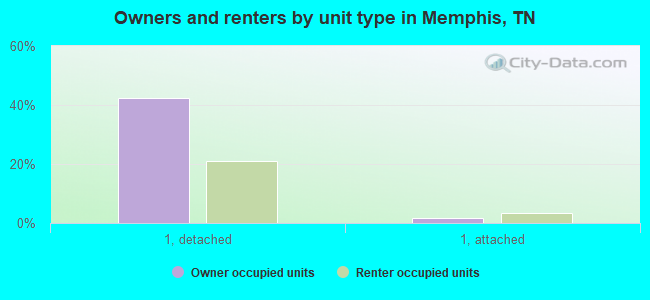
Houses: 290,535 (254,379 occupied: 117,057 owner occupied, 137,322 renter occupied )
% of renters here:
54%State:
33%
Housing density: 1,040 houses/condos per square mile
Median price asked for vacant for-sale houses and condos in 2022: $112,203.
Median contract rent in 2022: $817 (lower quartile is $643, upper quartile is $1,094)
Median rent asked for vacant for-rent units in 2022: $989
Median gross rent in Memphis, TN in 2022: $1,098
Housing units in Memphis with a mortgage: 68,824 (4,847 second mortgage, 135 home equity loan, 3,853 both second mortgage and home equity loan )Houses without a mortgage: 2,086
Median household income for houses/condos with a mortgage: $85,555
Median household income for apartments without a mortgage: $57,558
Median monthly housing costs: $1,058
Data:
Median house or condo value ($)
Median house or condo value ($ change since 2000)
Median house or condo value ($) - White
Median house or condo value ($) - Black or African American
Median house or condo value ($) - Asian
Median house or condo value ($) - Hispanic or Latino
Median house or condo value ($) - American Indian and Alaska Native
Median house or condo value ($) - Multirace
Median house or condo value ($) - Other Race
Median price asked for mobile homes ($)
Household density (households per square mile)
Mean house or condo value by units in structure - 1, detached ($)
Mean house or condo value by units in structure - 1, attached ($)
Mean house or condo value by units in structure - 2 ($)
Mean house or condo value by units in structure by units in structure - 3 or 4 ($)
Mean house or condo value by units in structure - 5 or more ($)
Mean house or condo value by units in structure - Boat, RV, van, etc. ($)
Mean house or condo value by units in structure - Mobile home ($)
Median contract rent ($)
Median contract rent - Lower quartile ($)
Median contract rent - Upper quartile ($)
Median gross rent ($)
Urban houses (%)
Rural houses (%)
Houses occupied (%)
Houses occupied (% change since 2000)
Houses owner occupied (%)
Houses owner occupied (% change since 2000)
Houses renter occupied (%)
Houses renter occupied (% change since 2000)
Vacant housing units - For rent (%)
Vacant housing units - For rent (% change since 2000)
Vacant housing units - For sale only (%)
Vacant housing units - For sale only (% change since 2000)
Vacant housing units - Rented or sold, not occupied (%)
Vacant housing units - Rented or sold, not occupied (% change since 2000)
Vacant housing units - For seasonal, recreational, or occasional use (%)
Vacant housing units - For seasonal, recreational, or occasional use (% change since 2000)
Vacant housing units - For migrant workers (%)
Vacant housing units - For migrant workers (% change since 2000)
Vacant housing units - Other vacant (%)
Vacant housing units - Other vacant (% change since 2000)
Median monthly housing costs ($)
Median household income for houses/condos with a mortgage ($)
Median household income for houses/condos without a mortgage ($)
Median household income ($)
Median household income ($) - White
Median household income ($) - Black or African American
Median household income ($) - Asian
Median household income ($) - Hispanic or Latino
Median household income ($) - American Indian and Alaska Native
Median household income ($) - Multirace
Median household income ($) - Other Race
Mortgage status - with mortgage (%)
Mortgage status - with second mortgage (%)
Mortgage status - with home equity loan (%)
Mortgage status - with both second mortgage and home equity loan (%)
Mortgage status - without a mortgage (%)
Median year house/condo built
Median year apartment built
Household type by relationship - Male householder living alone (%)
Household type by relationship - Male householder not living alone (%)
Household type by relationship - Female householder living alone (%)
Household type by relationship - Female householder not living alone (%)
Household type by relationship - Opposite-Sex spouse (%)
Household type by relationship - Same-Sex spouse (%)
Household type by relationship - Opposite-Sex unmarried partner (%)
Household type by relationship - Same-Sex unmarried partner (%)
Household type by relationship - In group quarters (%)
Size of family households - 2-person household (%)
Size of family households - 3-person household (%)
Size of family households - 4-person household (%)
Size of family households - 5-person household (%)
Size of family households - 6-person household (%)
Size of family households - 7-or-more-person household (%)
Size of nonfamily households - 1-person household (%)
Size of nonfamily households - 2-person household (%)
Size of nonfamily households - 3-person household (%)
Size of nonfamily households - 4-person household (%)
Size of nonfamily households - 5-person household (%)
Size of nonfamily households - 6-person household (%)
Size of nonfamily households - 7-or-moreperson household (%)
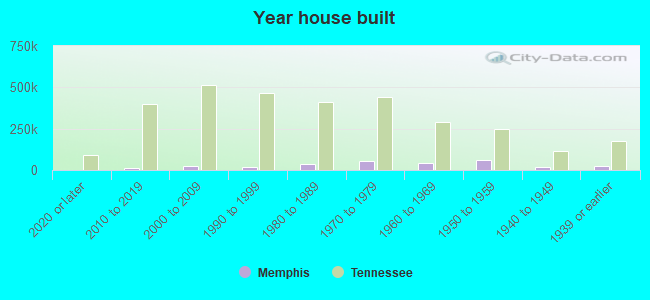
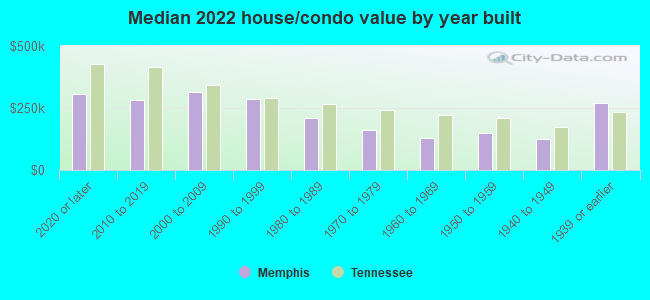
Year house built - Built 2010 or later (%)
Year house built - Built 2000 to 2009 (%)
Year house built - Built 1990 to 1999 (%)
Year house built - Built 1980 to 1989 (%)
Year house built - Built 1970 to 1979 (%)
Year house built - Built 1960 to 1969 (%)
Year house built - Built 1950 to 1959 (%)
Year house built - Built 1940 to 1949 (%)
Year house built - Built 1939 or earlier (%)
Median number of rooms in houses and condos
Median number of rooms in apartments
Median number of bedrooms in owner occupied houses
Mean number of bedrooms in owner occupied houses
Median number of bedrooms in renter occupied houses
Mean number of bedrooms in renter occupied houses
Median number of vehichles in owner occupied houses
Mean number of vehichles in owner occupied houses
Median number of vehichles in renter occupied houses
Mean number of vehichles in renter occupied houses
Rooms in owner-occupied houses - 1 room (%)
Rooms in owner-occupied houses - 2 rooms (%)
Rooms in owner-occupied houses - 3 rooms (%)
Rooms in owner-occupied houses - 4 rooms (%)
Rooms in owner-occupied houses - 5 rooms (%)
Rooms in owner-occupied houses - 6 rooms (%)
Rooms in owner-occupied houses - 7 rooms (%)
Rooms in owner-occupied houses - 8 rooms (%)
Rooms in owner-occupied houses - 9+ rooms (%)
Rooms in renter-occupied houses - 1 room (%)
Rooms in renter-occupied houses - 2 rooms (%)
Rooms in renter-occupied houses - 3 rooms (%)
Rooms in renter-occupied houses - 4 rooms (%)
Rooms in renter-occupied houses - 5 rooms (%)
Rooms in renter-occupied houses - 6 rooms (%)
Rooms in renter-occupied houses - 7 rooms (%)
Rooms in renter-occupied houses - 8 rooms (%)
Rooms in renter-occupied houses - 9+ rooms (%)
Bedrooms in owner-occupied houses - no bedrooms (%)
Bedrooms in owner-occupied houses - 1 bedroom (%)
Bedrooms in owner-occupied houses - 2 bedrooms (%)
Bedrooms in owner-occupied houses - 3 bedrooms (%)
Bedrooms in owner-occupied houses - 4 bedrooms (%)
Bedrooms in owner-occupied houses - 5+ bedrooms (%)
Bedrooms in renter-occupied houses - no bedrooms (%)
Bedrooms in renter-occupied houses - 1 bedroom (%)
Bedrooms in renter-occupied houses - 2 bedrooms (%)
Bedrooms in renter-occupied houses - 3 bedrooms (%)
Bedrooms in renter-occupied houses - 4 bedrooms (%)
Bedrooms in renter-occupied houses - 5+ bedrooms (%)
Vehicles available in owner-occupied houses - no vehicle available (%)
Vehicles available in owner-occupied houses - 1 vehicle available(%)
Vehicles available in owner-occupied houses - 2 Vehicles available (%)
Vehicles available in owner-occupied houses - 3 Vehicles available (%)
Vehicles available in owner-occupied houses - 4 Vehicles available (%)
Vehicles available in owner-occupied houses - 5+ Vehicles available (%)
Vehicles available in renter-occupied houses - no vehicle available (%)
Vehicles available in renter-occupied houses - 1 vehicle available (%)
Vehicles available in renter-occupied houses - 2 Vehicles available (%)
Vehicles available in renter-occupied houses - 3 Vehicles available (%)
Vehicles available in renter-occupied houses - 4 Vehicles available (%)
Vehicles available in renter-occupied houses - 5+ Vehicles available (%)
Housing units in structures - 1, detached (%)
Housing units in structures - 1, attached (%)
Housing units in structures - 2 (%)
Housing units in structures - 3 or 4 (%)
Housing units in structures - 5 to 9 (%)
Housing units in structures - 10 to 19 (%)
Housing units in structures - 20 to 49 (%)
Housing units in structures - 50 or more (%)
Housing units in structures - Mobile home (%)
Housing units in structures - Boat, RV, van, etc. (%)
Housing units in structures - Owners - 1, detached (%)
Housing units in structures - Owners - 1, attached (%)
Housing units in structures - Owners - 2 (%)
Housing units in structures - Owners - 3 or 4 (%)
Housing units in structures - Owners - 5 to 9 (%)
Housing units in structures - Owners - 10 to 19 (%)
Housing units in structures - Owners - 20 to 49 (%)
Housing units in structures - Owners - 50 or more (%)
Housing units in structures - Owners - Mobile home (%)
Housing units in structures - Owners - Boat, RV, van, etc. (%)
Housing units in structures - Renters - 1, detached (%)
Housing units in structures - Renters - 1, attached (%)
Housing units in structures - Renters - 2 (%)
Housing units in structures - Renters - 3 or 4 (%)
Housing units in structures - Renters - 5 to 9 (%)
Housing units in structures - Renters - 10 to 19 (%)
Housing units in structures - Renters - 20 to 49 (%)
Housing units in structures - Renters - 50 or more (%)
Housing units in structures - Renters - Mobile home (%)
Housing units in structures - Renters - Boat, RV, van, etc. (%)
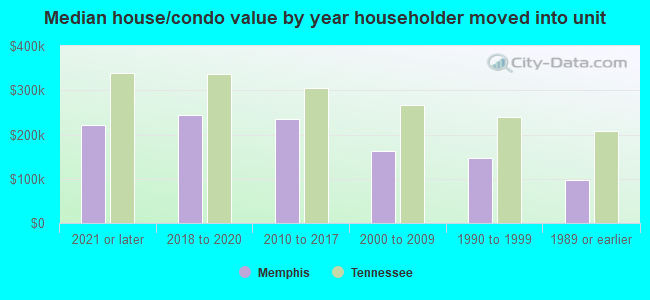
House/condo owner moved in on average (years ago)
Renter moved in on average (years ago)
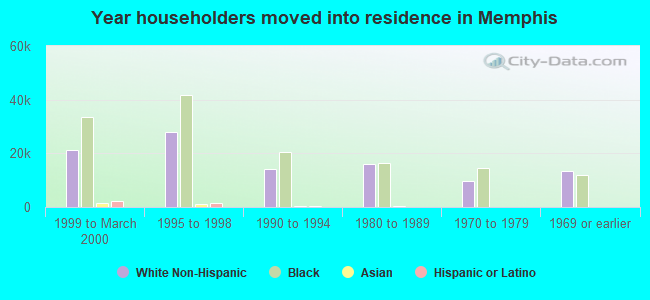
Year householder moved into unit - Moved in 1999 to March 2000 (%)
Year householder moved into unit - Moved in 1999 to March 2000 (%) - White
Year householder moved into unit - Moved in 1999 to March 2000 (%) - Black or African American
Year householder moved into unit - Moved in 1999 to March 2000 (%) - Asian
Year householder moved into unit - Moved in 1999 to March 2000 (%) - Hispanic or Latino
Year householder moved into unit - Moved in 1999 to March 2000 (%) - American Indian and Alaska Native
Year householder moved into unit - Moved in 1999 to March 2000 (%) - Multirace
Year householder moved into unit - Moved in 1999 to March 2000 (%) - Other Race
Year householder moved into unit - Moved in 1995 to 1998 (%)
Year householder moved into unit - Moved in 1995 to 1998 (%) - White
Year householder moved into unit - Moved in 1995 to 1998 (%) - Black or African American
Year householder moved into unit - Moved in 1995 to 1998 (%) - Asian
Year householder moved into unit - Moved in 1995 to 1998 (%) - Hispanic or Latino
Year householder moved into unit - Moved in 1995 to 1998 (%) - American Indian and Alaska Native
Year householder moved into unit - Moved in 1995 to 1998 (%) - Multirace
Year householder moved into unit - Moved in 1995 to 1998 (%) - Other Race
Year householder moved into unit - Moved in 1990 to 1994 (%)
Year householder moved into unit - Moved in 1990 to 1994 (%) - White
Year householder moved into unit - Moved in 1990 to 1994 (%) - Black or African American
Year householder moved into unit - Moved in 1990 to 1994 (%) - Asian
Year householder moved into unit - Moved in 1990 to 1994 (%) - Hispanic or Latino
Year householder moved into unit - Moved in 1990 to 1994 (%) - American Indian and Alaska Native
Year householder moved into unit - Moved in 1990 to 1994 (%) - Multirace
Year householder moved into unit - Moved in 1990 to 1994 (%) - Other Race
Year householder moved into unit - Moved in 1980 to 1989 (%)
Year householder moved into unit - Moved in 1980 to 1989 (%) - White
Year householder moved into unit - Moved in 1980 to 1989 (%) - Black or African American
Year householder moved into unit - Moved in 1980 to 1989 (%) - Asian
Year householder moved into unit - Moved in 1980 to 1989 (%) - Hispanic or Latino
Year householder moved into unit - Moved in 1980 to 1989 (%) - American Indian and Alaska Native
Year householder moved into unit - Moved in 1980 to 1989 (%) - Multirace
Year householder moved into unit - Moved in 1980 to 1989 (%) - Other Race
Year householder moved into unit - Moved in 1970 to 1979 (%)
Year householder moved into unit - Moved in 1970 to 1979 (%) - White
Year householder moved into unit - Moved in 1970 to 1979 (%) - Black or African American
Year householder moved into unit - Moved in 1970 to 1979 (%) - Asian
Year householder moved into unit - Moved in 1970 to 1979 (%) - Hispanic or Latino
Year householder moved into unit - Moved in 1970 to 1979 (%) - American Indian and Alaska Native
Year householder moved into unit - Moved in 1970 to 1979 (%) - Multirace
Year householder moved into unit - Moved in 1970 to 1979 (%) - Other Race
Year householder moved into unit - Moved in 1969 or earlier (%)
Year householder moved into unit - Moved in 1969 or earlier (%) - White
Year householder moved into unit - Moved in 1969 or earlier (%) - Black or African American
Year householder moved into unit - Moved in 1969 or earlier (%) - Asian
Year householder moved into unit - Moved in 1969 or earlier (%) - Hispanic or Latino
Year householder moved into unit - Moved in 1969 or earlier (%) - American Indian and Alaska Native
Year householder moved into unit - Moved in 1969 or earlier (%) - Multirace
Year householder moved into unit - Moved in 1969 or earlier (%) - Other Race
Housing units lacking complete plumbing facilities (%)
Housing units lacking complete kitchen facilities (%)
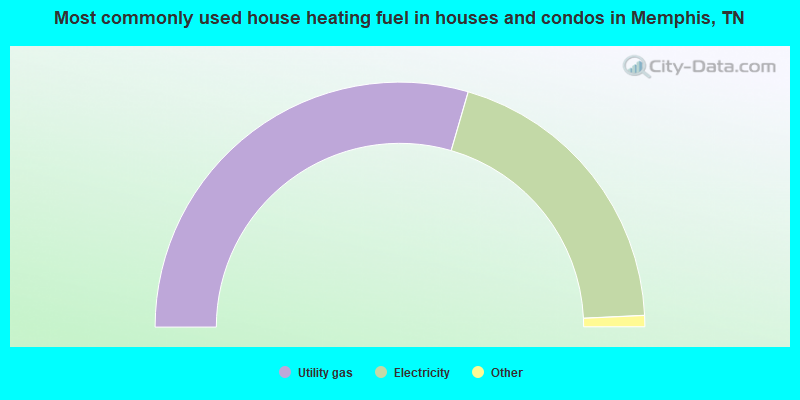
House heating fuel used in houses and condos - Utility gas (%)
House heating fuel used in houses and condos - Bottled, tank, or LP gas (%)
House heating fuel used in houses and condos - Electricity (%)
House heating fuel used in houses and condos - Fuel oil, kerosene, etc. (%)
House heating fuel used in houses and condos - Coal or coke (%)
House heating fuel used in houses and condos - Wood (%)
House heating fuel used in houses and condos - Solar energy (%)
House heating fuel used in houses and condos - Other fuel (%)
House heating fuel used in houses and condos - No fuel used (%)
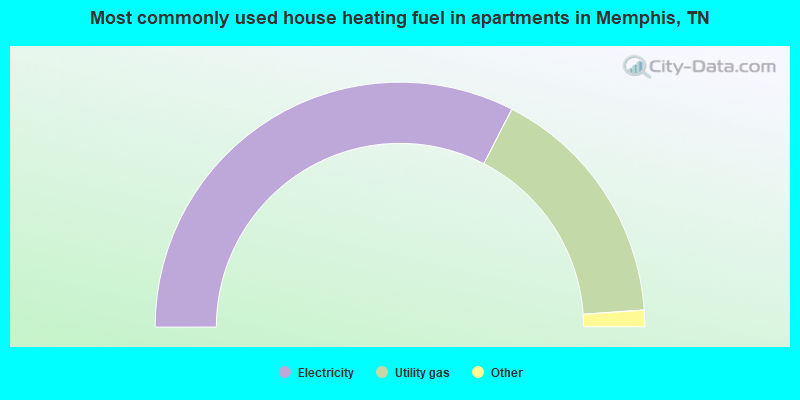
House heating fuel used in apartments - Utility gas (%)
House heating fuel used in apartments - Bottled, tank, or LP gas (%)
House heating fuel used in apartments - Electricity (%)
House heating fuel used in apartments - Fuel oil, kerosene, etc. (%)
House heating fuel used in apartments - Coal or coke (%)
House heating fuel used in apartments - Wood (%)
House heating fuel used in apartments - Solar energy (%)
House heating fuel used in apartments - Other fuel (%)
House heating fuel used in apartments - No fuel used (%)
Latest news about housing in Memphis, TN collected exclusively by city-data.com from local newspapers, TV, and radio stations
Median year house/condo built: 1968Median year apartment built: 1974Household type by relationship:
Households: 621,050
Male householders: 111,453 (47,715 living alone ), Female householders: 142,926 (46,770 living alone )66,872 spouses (66,012 opposite-sex spouses ), 23,476 unmarried partners , (21,897 opposite-sex unmarried partners ), 182,085 children (169,367 natural , 4,142 adopted , 8,576 stepchildren ), 25,548 grandchildren , 12,688 brothers or sisters , 7,000 parents , 799 foster children , 17,098 other relatives , 17,763 non-relatives In group quarters: 13,342
Size of family households: 62,379 2-persons , 35,383 3-persons , 23,364 4-persons , 10,887 5-persons , 5,006 6-persons , 3,632 7-or-more-persons .
Size of nonfamily households: 94,485 1-person , 16,740 2-persons , 1,825 3-persons , 62 4-persons , 411 5-persons , 95 6-persons , 110 7-or-more-persons .
46,469 married couples with children. single-parent households (13,141 men , 63,808 women ).
90.1% of residents of Memphis speak English at home. of residents speak Spanish at home (55% speak English very well , 19% speak English well , 17% speak English not well , 8% don't speak English at all ).of residents speak other Indo-European language at home (85% speak English very well , 12% speak English well , 2% speak English not well ).of residents speak Asian or Pacific Island language at home (57% speak English very well , 15% speak English well , 24% speak English not well , 3% don't speak English at all ).of residents speak other language at home (63% speak English very well , 15% speak English well , 15% speak English not well , 7% don't speak English at all ).
Foreign born population: 44,676 (7.2%)of them are naturalized citizens )
Median number of rooms in houses and condos:
Median number of rooms in apartments
Owner-occupied Renter-occupied
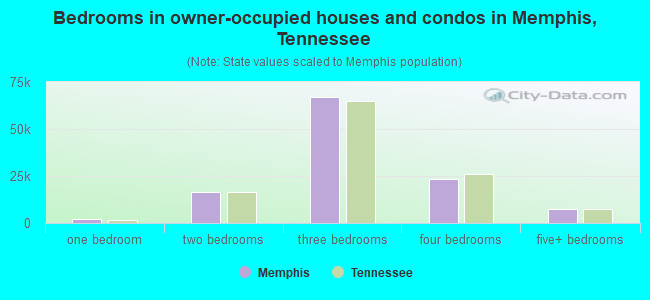
Bedrooms in owner-occupied houses and condos in Memphis, Tennessee
360 no bedroom 2,177 1 bedroom 16,587 2 bedrooms 66,983 3 bedrooms 23,670 4 bedrooms 7,280 5+ bedrooms
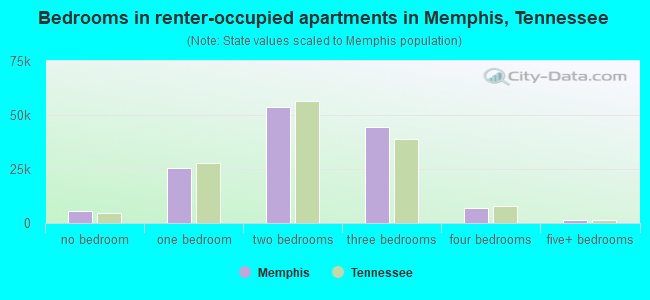
Bedrooms in renter-occupied apartments in Memphis, Tennessee
5,327 no bedroom 25,238 1 bedroom 53,715 2 bedrooms 44,493 3 bedrooms 6,987 4 bedrooms 1,562 5+ bedrooms
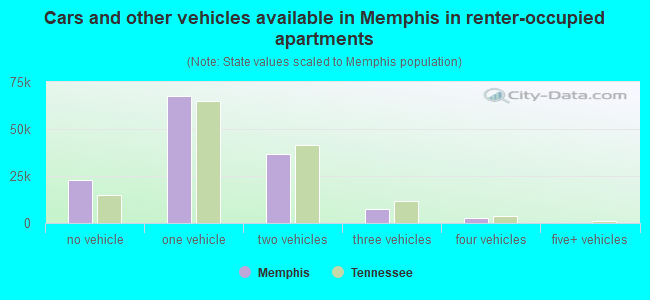
Owner-occupied Renter-occupied
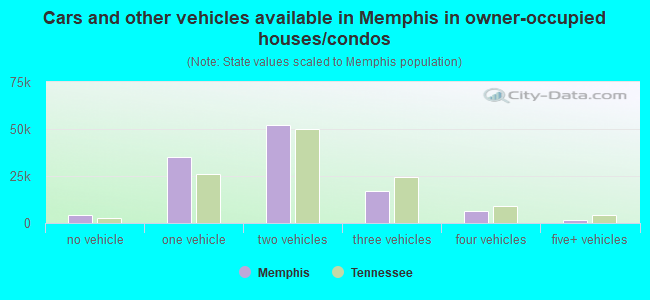
Cars and other vehicles available in Memphis in owner-occupied houses/condos
4,403 no vehicle 35,002 1 vehicle 52,353 2 vehicles 17,109 3 vehicles 6,502 4 vehicles 1,688 5+ vehicles
Cars and other vehicles available in Memphis in renter-occupied apartments
22,941 no vehicle 67,422 1 vehicle 36,730 2 vehicles 7,257 3 vehicles 2,724 4 vehicles 248 5+ vehicles
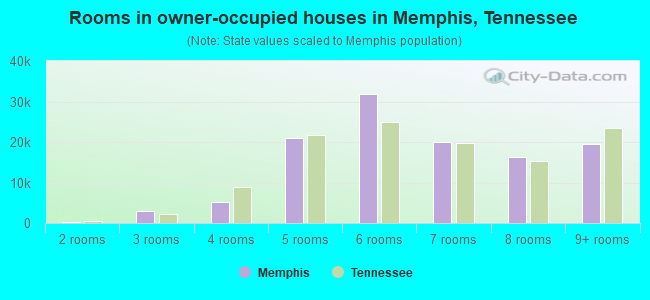
Owner-occupied Renter-occupied
Rooms in owner-occupied houses in Memphis, Tennessee
262 1 room 175 2 rooms 2,856 3 rooms 5,191 4 rooms 21,018 5 rooms 31,745 6 rooms 19,885 7 rooms 16,362 8 rooms 19,563 9+ rooms
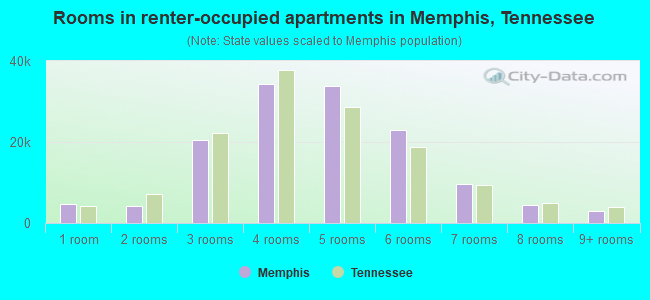
Rooms in renter-occupied apartments in Memphis, Tennessee
4,768 1 room 4,166 2 rooms 20,417 3 rooms 34,332 4 rooms 33,843 5 rooms 22,897 6 rooms 9,576 7 rooms 4,330 8 rooms 2,993 9+ rooms
Memphis, TN household income distribution 21,493 Less than $10,00026,054 $10,000 to $19,99929,051 $20,000 to $29,99924,013 $30,000 to $39,99924,930 $40,000 to $49,99918,512 $50,000 to $59,99925,896 $60,000 to $74,99927,251 $75,000 to $99,99915,997 $100,000 to $124,99915,558 $125,000 to $149,99912,662 $150,000 to $199,99912,962 $200,000 or more
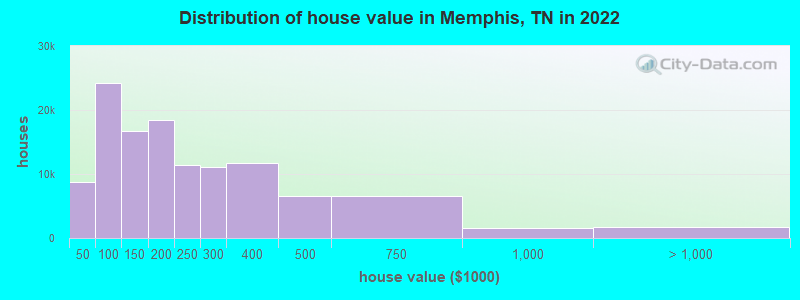
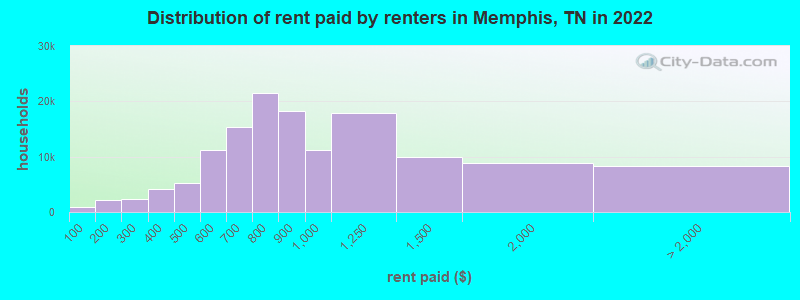
Home value of owner - occupied houses in 2022 in Memphis, TN 1,567 Less than $10,0001,039 $10,000 to $14,999494 $15,000 to $19,9991,260 $20,000 to $24,999865 $25,000 to $29,9991,113 $30,000 to $34,999481 $35,000 to $39,9991,923 $40,000 to $49,9993,117 $50,000 to $59,9995,605 $60,000 to $69,9994,266 $70,000 to $79,9995,532 $80,000 to $89,9993,836 $90,000 to $99,9999,695 $100,000 to $124,9996,965 $125,000 to $149,99911,503 $150,000 to $174,9996,942 $175,000 to $199,99911,483 $200,000 to $249,99911,167 $250,000 to $299,99911,768 $300,000 to $399,9996,622 $400,000 to $499,9996,596 $500,000 to $749,9991,487 $750,000 to $999,9991,057 $1,000,000 to $1,499,999226 $1,500,000 to $1,999,999448 $2,000,000 or moreRent paid by renters in 2022 in Memphis, TN 826 Less than $1001,217 $100 to $1491,010 $150 to $1991,344 $200 to $2491,056 $250 to $2992,074 $300 to $3492,042 $350 to $3992,550 $400 to $4492,743 $450 to $4995,896 $500 to $5495,233 $550 to $5998,081 $600 to $6497,299 $650 to $6999,871 $700 to $74911,651 $750 to $79918,221 $800 to $89911,173 $900 to $99917,912 $1,000 to $1,2499,957 $1,250 to $1,4998,809 $1,500 to $1,9991,702 $2,000 to $2,499880 $2,500 to $2,999297 $3,000 to $3,499223 $3,500 or more5,255 No cash rent
Percentage of workers working in this county: 93.7%Number of people working at home: 30,376 (10.7% of all workers )
Travel time to work (commute)
Less than 5 minutes: 3,8575 to 9 minutes: 29,57510 to 14 minutes: 32,96015 to 19 minutes: 47,80720 to 24 minutes: 66,28825 to 29 minutes: 19,59730 to 34 minutes: 31,07735 to 39 minutes: 4,55240 to 44 minutes: 5,78445 to 59 minutes: 5,67960 to 89 minutes: 2,19090 or more minutes: 3,339
Means of transportation to work:
Drove a car alone: 314,405 (78.7%)Carpooled: 37,958 (9.5%)Bus : 1,751 (0.4%)Taxi: 7,243 (1.8%)Bicycle: 779 (0.2%)Walked: 7,028 (1.8%)Worked at home: 30,376 (7.6%)
Unemployment by race in 2022
Unemployment rate for White non-Hispanic residents 2.8% Males3.6% FemalesUnemployment rate for Black residents 7.4% Males7.4% FemalesUnemployment rate for American Indian and Alaska Native residents 14.1% Males31.9% FemalesUnemployment rate for Asian residents 1.4% Males4.3% FemalesUnemployment rate for other race residents 3.3% Males10.5% FemalesUnemployment rate for two or more race residents 4.2% Males3.3% FemalesUnemployment rate for Hispanic or Latino residents 3.8% Males10.0% Females
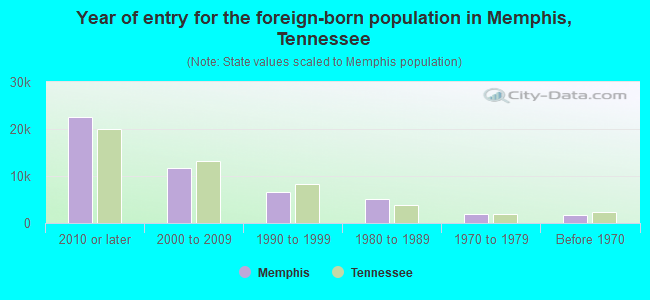
Year of entry for the foreign-born population in Memphis, Tennessee
22,472 2010 or later 11,658 2000 to 2009 6,687 1990 to 1999 5,026 1980 to 1989 1,989 1970 to 1979 1,747 Before 1970
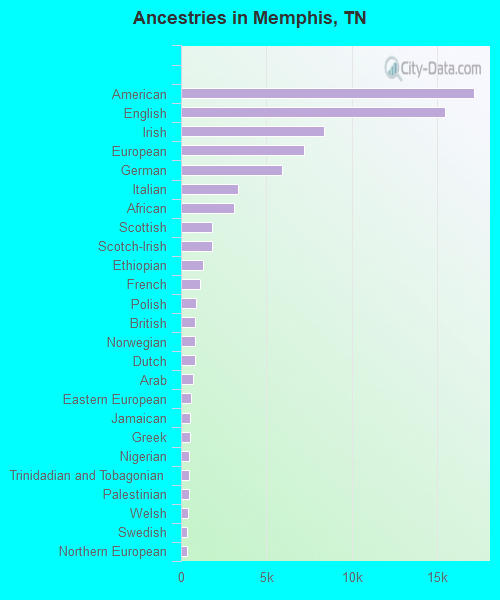
First ancestries reported:
American: 17,193 (3.7%)
English: 15,471 (3.4%)
Irish: 8,381 (1.8%)
European: 7,201 (1.6%)
German: 5,932 (1.3%)
Italian: 3,327 (0.7%)
African: 3,078 (0.7%)
Scottish: 1,846 (0.4%)
Scotch-Irish: 1,798 (0.4%)
Ethiopian: 1,315 (0.3%)
French: 1,097 (0.2%)
Polish: 876 (0.2%)
British: 811 (0.2%)
Norwegian: 807 (0.2%)
Dutch: 806 (0.2%)
Arab: 721 (0.2%)
Eastern European: 569 (0.1%)
Jamaican: 539 (0.1%)
Greek: 517 (0.1%)
Nigerian: 495 (0.1%)
Trinidadian and Tobagonian: 481 (0.1%)
Palestinian: 460 (0.10%)
Welsh: 383 (0.08%)
Swedish: 370 (0.08%)
Northern European: 323 (0.07%)
Scandinavian: 288 (0.06%)
Russian: 287 (0.06%)
Portuguese: 277 (0.06%)
Czech: 253 (0.05%)
Sudanese: 220 (0.05%)
Egyptian: 219 (0.05%)
Lebanese: 217 (0.05%)
French Canadian: 211 (0.05%)
Lithuanian: 156 (0.03%)
Iranian: 144 (0.03%)
Syrian: 142 (0.03%)
Brazilian: 134 (0.03%)
Turkish: 132 (0.03%)
Danish: 120 (0.03%)
Canadian: 108 (0.02%)
Romanian: 104 (0.02%)
Austrian: 94 (0.02%)
Slavic: 94 (0.02%)
Kenyan: 85 (0.02%)
Hungarian: 81 (0.02%)
Ukrainian: 80 (0.02%)
Yugoslavian: 79 (0.02%)
Swiss: 60 (0.01%)
Ghanaian: 56 (0.01%)
Cape Verdean: 53 (0.01%)
Israeli: 53 (0.01%)
Senegalese: 45 (0.01%)
British West Indian: 42 (0.01%)
Czechoslovakian: 41 (0.01%)
Somali: 34 (0.01%)
West Indian: 32 (0.01%)
Iraqi: 31 (0.01%)
Haitian: 27 (0.01%)
Serbian: 25 (0.01%)
Australian: 25 (0.01%)
Bulgarian: 24 (0.01%)
Most common places of birth for foreign-born residents (%): Mexico Memphis:
27.3% (11,369)Tennessee:
23.0% (86,435)
Honduras Memphis:
10.4% (4,324)Tennessee:
4.6% (17,433)
Guatemala Memphis:
8.8% (3,646)Tennessee:
5.7% (21,286)
Venezuela Memphis:
5.4% (2,244)Tennessee:
1.6% (5,936)
Vietnam Memphis:
5.0% (2,067)Tennessee:
2.4% (8,894)
China, excluding Hong Kong and Taiwan Memphis:
3.3% (1,383)Tennessee:
3.3% (12,582)
Ethiopia Memphis:
2.8% (1,173)Tennessee:
1.4% (5,265)
El Salvador Memphis:
2.8% (1,170)Tennessee:
2.7% (10,313)
India Memphis:
2.5% (1,045)Tennessee:
6.1% (23,079)
Nigeria Memphis:
2.0% (818)Tennessee:
1.2% (4,662)
Congo Memphis:
1.7% (722)Tennessee:
0.3% (1,075)
Other Western Africa Memphis:
1.6% (678)Tennessee:
0.3% (1,173)
Philippines Memphis:
1.6% (667)Tennessee:
3.1% (11,640)
Place of birth for U.S.-born residents:
This state: 399,014Other state: 172,854Northeast: 11,576Midwest: 34,443South: 114,622West: 12,213 86.1% of Memphis residents lived in the same house 1 years ago.
Out of people who lived in different houses, 39.5% lived in this county.
Out of people who lived in different counties, 35.4% lived in Tennessee.
Memphis:
86.1%State average:
87.0%
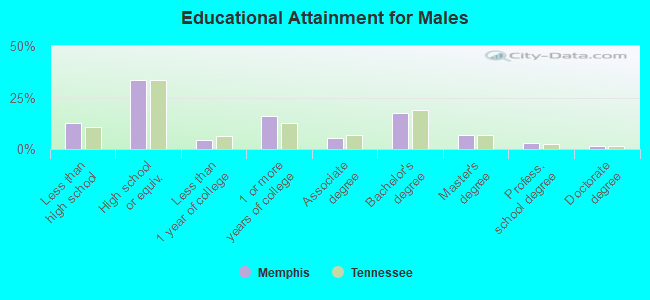
Education attainment for males 25 years and older:
No schooling: 3,527Nursery to 4th grade: 7485th and 6th grade: 2,7297th and 8th grade: 2,8609th grade: 1,97710th grade: 3,13711th grade: 4,20312th grade, no diploma: 4,579High school graduate (or equivalency): 63,686Less than 1 year of college: 8,106Some college more than 1 year, no degree: 30,619Associate degree: 10,630Bachelor's degree: 33,047Master's degree: 12,562Professional school degree: 5,350Doctorate degree: 3,212
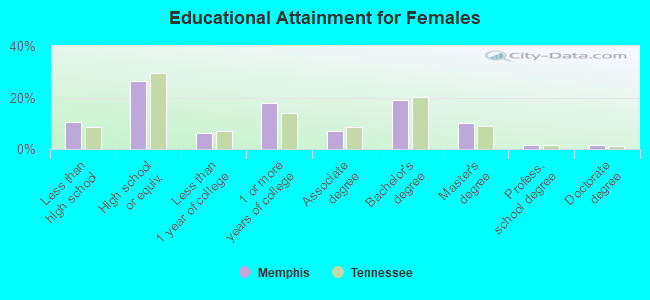
Education attainment for females 25 years and older:
No schooling: 2,828Nursery to 4th grade: 7665th and 6th grade: 1,9987th and 8th grade: 2,5499th grade: 2,52110th grade: 2,80611th grade: 5,69912th grade, no diploma: 3,665High school graduate (or equivalency): 58,255Less than 1 year of college: 14,013Some college more than 1 year, no degree: 38,970Associate degree: 15,065Bachelor's degree: 41,838Master's degree: 22,389Professional school degree: 3,553Doctorate degree: 3,425
Housing units in structures:
One, detached: 175,537One, attached: 14,494Two: 6,2533 or 4: 18,0925 to 9: 25,24810 to 19: 18,38120 to 49: 7,94550 or more: 20,330Mobile homes: 3,940Boats, RVs, vans, etc.: 315Median worth of mobile homes: $73,117
Housing units lacking complete plumbing facilities in 2022: 3.5%Housing units lacking complete kitchen facilities in 2022: 5.3%House/condo owner moved in on average 16 years ago
Renter moved in on average 2 years ago
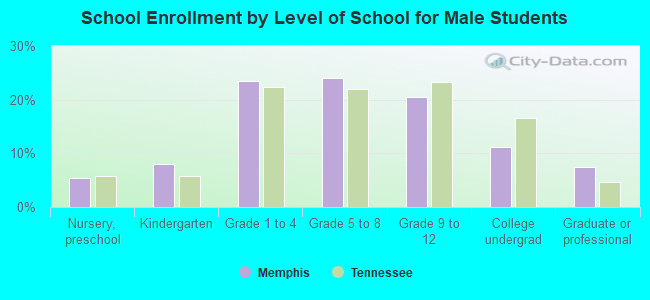
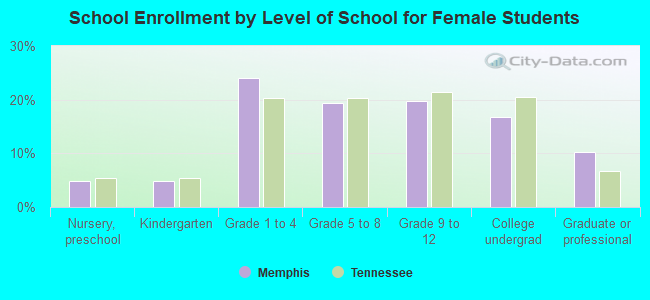
Private vs. public school enrollment:
Students in private schools in grades 1 to 8 (elementary and middle school): 6,489 Students in private schools in grades 9 to 12 (high school): 4,046 Here:
13.5%Tennessee:
16.2%
Students in private undergraduate colleges: 5,431 Here:
26.1%Tennessee:
23.5%