Meridian, MS (Mississippi) Houses and Residents
Estimated median house or condo value in 2022: $98,362 (it was $58,400 in 2000 )
Meridian:
$98,362Mississippi:
$162,500
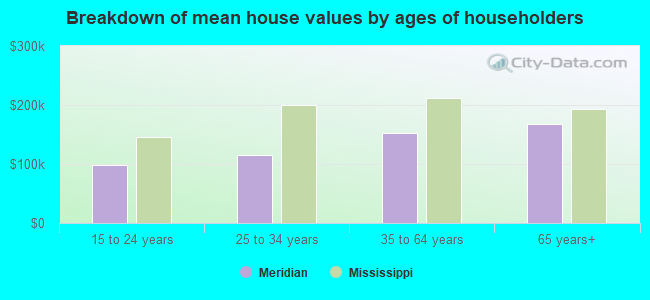
Lower value quartile - upper value quartile: $68,738 - $169,908Mean price in 2022: Detached houses: $165,726 Here:
$165,726State:
$226,494
Townhouses or other attached units: $135,243 Here:
$135,243State:
$254,198
In 2-unit structures: $73,960 Here:
$73,960State:
$195,375
Mobile homes: $122,714 Here:
$122,714State:
$73,695
Total population: 40,196 (Urban population: 38,135 (all inside urban clusters), Rural population: 1,900 (all nonfarm) )
Houses: 17,802 (14,764 occupied: 7,057 owner occupied, 8,305 renter occupied )
% of renters here:
54%State:
30%
Housing density: 395 houses/condos per square mile
Median price asked for vacant for-sale houses and condos in 2022: $186,890.
Median contract rent in 2022: $639 (lower quartile is $498, upper quartile is $788)
Median rent asked for vacant for-rent units in 2022: $468
Median gross rent in Meridian, MS in 2022: $838
Housing units in Meridian with a mortgage: 3,793 (539 second mortgage, 21 home equity loan, 234 both second mortgage and home equity loan )Houses without a mortgage: 37
Median household income for houses/condos with a mortgage: $65,125
Median household income for apartments without a mortgage: $38,701
Median monthly housing costs: $815
Data:
Median house or condo value ($)
Median house or condo value ($ change since 2000)
Median house or condo value ($) - White
Median house or condo value ($) - Black or African American
Median house or condo value ($) - Asian
Median house or condo value ($) - Hispanic or Latino
Median house or condo value ($) - American Indian and Alaska Native
Median house or condo value ($) - Multirace
Median house or condo value ($) - Other Race
Median price asked for mobile homes ($)
Household density (households per square mile)
Mean house or condo value by units in structure - 1, detached ($)
Mean house or condo value by units in structure - 1, attached ($)
Mean house or condo value by units in structure - 2 ($)
Mean house or condo value by units in structure by units in structure - 3 or 4 ($)
Mean house or condo value by units in structure - 5 or more ($)
Mean house or condo value by units in structure - Boat, RV, van, etc. ($)
Mean house or condo value by units in structure - Mobile home ($)
Median contract rent ($)
Median contract rent - Lower quartile ($)
Median contract rent - Upper quartile ($)
Median gross rent ($)
Urban houses (%)
Rural houses (%)
Houses occupied (%)
Houses occupied (% change since 2000)
Houses owner occupied (%)
Houses owner occupied (% change since 2000)
Houses renter occupied (%)
Houses renter occupied (% change since 2000)
Vacant housing units - For rent (%)
Vacant housing units - For rent (% change since 2000)
Vacant housing units - For sale only (%)
Vacant housing units - For sale only (% change since 2000)
Vacant housing units - Rented or sold, not occupied (%)
Vacant housing units - Rented or sold, not occupied (% change since 2000)
Vacant housing units - For seasonal, recreational, or occasional use (%)
Vacant housing units - For seasonal, recreational, or occasional use (% change since 2000)
Vacant housing units - For migrant workers (%)
Vacant housing units - For migrant workers (% change since 2000)
Vacant housing units - Other vacant (%)
Vacant housing units - Other vacant (% change since 2000)
Median monthly housing costs ($)
Median household income for houses/condos with a mortgage ($)
Median household income for houses/condos without a mortgage ($)
Median household income ($)
Median household income ($) - White
Median household income ($) - Black or African American
Median household income ($) - Asian
Median household income ($) - Hispanic or Latino
Median household income ($) - American Indian and Alaska Native
Median household income ($) - Multirace
Median household income ($) - Other Race
Mortgage status - with mortgage (%)
Mortgage status - with second mortgage (%)
Mortgage status - with home equity loan (%)
Mortgage status - with both second mortgage and home equity loan (%)
Mortgage status - without a mortgage (%)
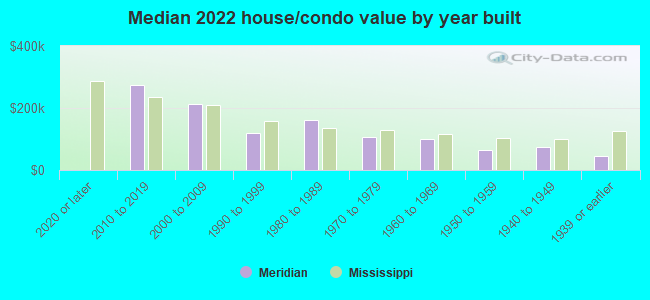
Median year house/condo built
Median year apartment built
Household type by relationship - Male householder living alone (%)
Household type by relationship - Male householder not living alone (%)
Household type by relationship - Female householder living alone (%)
Household type by relationship - Female householder not living alone (%)
Household type by relationship - Opposite-Sex spouse (%)
Household type by relationship - Same-Sex spouse (%)
Household type by relationship - Opposite-Sex unmarried partner (%)
Household type by relationship - Same-Sex unmarried partner (%)
Household type by relationship - In group quarters (%)
Size of family households - 2-person household (%)
Size of family households - 3-person household (%)
Size of family households - 4-person household (%)
Size of family households - 5-person household (%)
Size of family households - 6-person household (%)
Size of family households - 7-or-more-person household (%)
Size of nonfamily households - 1-person household (%)
Size of nonfamily households - 2-person household (%)
Size of nonfamily households - 3-person household (%)
Size of nonfamily households - 4-person household (%)
Size of nonfamily households - 5-person household (%)
Size of nonfamily households - 6-person household (%)
Size of nonfamily households - 7-or-moreperson household (%)
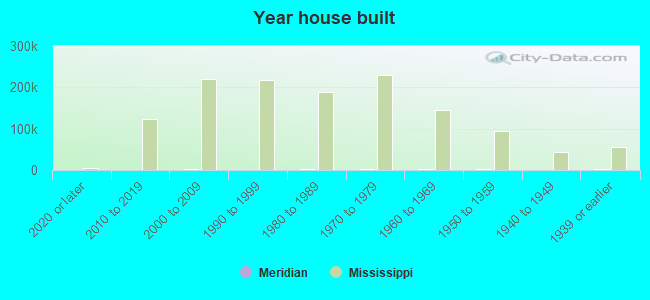
Year house built - Built 2010 or later (%)
Year house built - Built 2000 to 2009 (%)
Year house built - Built 1990 to 1999 (%)
Year house built - Built 1980 to 1989 (%)
Year house built - Built 1970 to 1979 (%)
Year house built - Built 1960 to 1969 (%)
Year house built - Built 1950 to 1959 (%)
Year house built - Built 1940 to 1949 (%)
Year house built - Built 1939 or earlier (%)
Median number of rooms in houses and condos
Median number of rooms in apartments
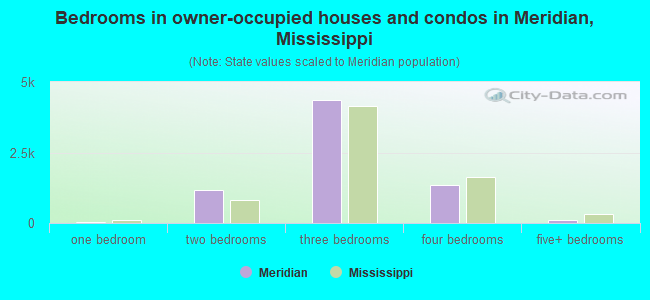
Median number of bedrooms in owner occupied houses
Mean number of bedrooms in owner occupied houses
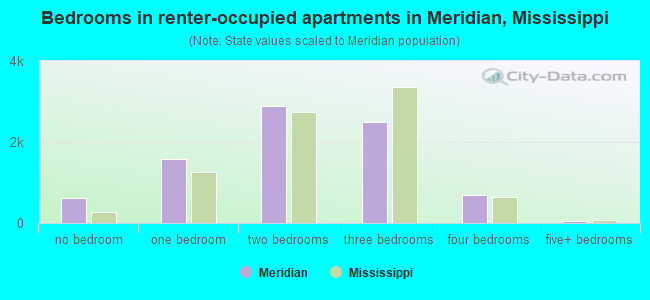
Median number of bedrooms in renter occupied houses
Mean number of bedrooms in renter occupied houses
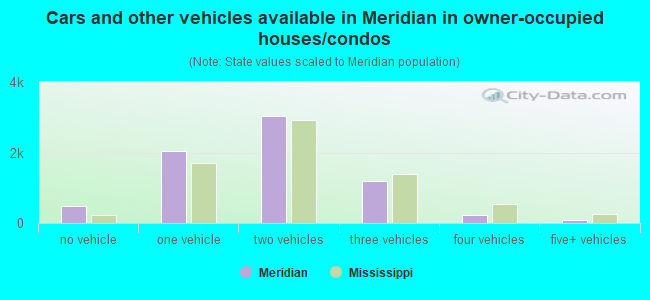
Median number of vehichles in owner occupied houses
Mean number of vehichles in owner occupied houses
Median number of vehichles in renter occupied houses
Mean number of vehichles in renter occupied houses
Rooms in owner-occupied houses - 1 room (%)
Rooms in owner-occupied houses - 2 rooms (%)
Rooms in owner-occupied houses - 3 rooms (%)
Rooms in owner-occupied houses - 4 rooms (%)
Rooms in owner-occupied houses - 5 rooms (%)
Rooms in owner-occupied houses - 6 rooms (%)
Rooms in owner-occupied houses - 7 rooms (%)
Rooms in owner-occupied houses - 8 rooms (%)
Rooms in owner-occupied houses - 9+ rooms (%)
Rooms in renter-occupied houses - 1 room (%)
Rooms in renter-occupied houses - 2 rooms (%)
Rooms in renter-occupied houses - 3 rooms (%)
Rooms in renter-occupied houses - 4 rooms (%)
Rooms in renter-occupied houses - 5 rooms (%)
Rooms in renter-occupied houses - 6 rooms (%)
Rooms in renter-occupied houses - 7 rooms (%)
Rooms in renter-occupied houses - 8 rooms (%)
Rooms in renter-occupied houses - 9+ rooms (%)
Bedrooms in owner-occupied houses - no bedrooms (%)
Bedrooms in owner-occupied houses - 1 bedroom (%)
Bedrooms in owner-occupied houses - 2 bedrooms (%)
Bedrooms in owner-occupied houses - 3 bedrooms (%)
Bedrooms in owner-occupied houses - 4 bedrooms (%)
Bedrooms in owner-occupied houses - 5+ bedrooms (%)
Bedrooms in renter-occupied houses - no bedrooms (%)
Bedrooms in renter-occupied houses - 1 bedroom (%)
Bedrooms in renter-occupied houses - 2 bedrooms (%)
Bedrooms in renter-occupied houses - 3 bedrooms (%)
Bedrooms in renter-occupied houses - 4 bedrooms (%)
Bedrooms in renter-occupied houses - 5+ bedrooms (%)
Vehicles available in owner-occupied houses - no vehicle available (%)
Vehicles available in owner-occupied houses - 1 vehicle available(%)
Vehicles available in owner-occupied houses - 2 Vehicles available (%)
Vehicles available in owner-occupied houses - 3 Vehicles available (%)
Vehicles available in owner-occupied houses - 4 Vehicles available (%)
Vehicles available in owner-occupied houses - 5+ Vehicles available (%)
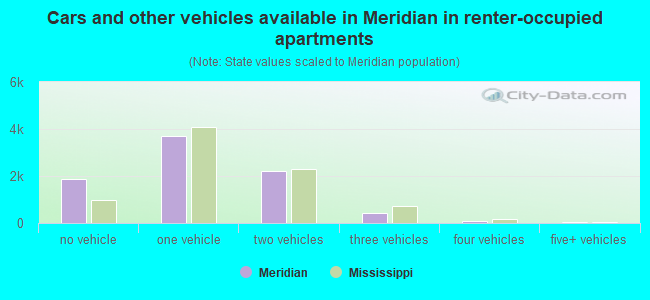
Vehicles available in renter-occupied houses - no vehicle available (%)
Vehicles available in renter-occupied houses - 1 vehicle available (%)
Vehicles available in renter-occupied houses - 2 Vehicles available (%)
Vehicles available in renter-occupied houses - 3 Vehicles available (%)
Vehicles available in renter-occupied houses - 4 Vehicles available (%)
Vehicles available in renter-occupied houses - 5+ Vehicles available (%)
Housing units in structures - 1, detached (%)
Housing units in structures - 1, attached (%)
Housing units in structures - 2 (%)
Housing units in structures - 3 or 4 (%)
Housing units in structures - 5 to 9 (%)
Housing units in structures - 10 to 19 (%)
Housing units in structures - 20 to 49 (%)
Housing units in structures - 50 or more (%)
Housing units in structures - Mobile home (%)
Housing units in structures - Boat, RV, van, etc. (%)
Housing units in structures - Owners - 1, detached (%)
Housing units in structures - Owners - 1, attached (%)
Housing units in structures - Owners - 2 (%)
Housing units in structures - Owners - 3 or 4 (%)
Housing units in structures - Owners - 5 to 9 (%)
Housing units in structures - Owners - 10 to 19 (%)
Housing units in structures - Owners - 20 to 49 (%)
Housing units in structures - Owners - 50 or more (%)
Housing units in structures - Owners - Mobile home (%)
Housing units in structures - Owners - Boat, RV, van, etc. (%)
Housing units in structures - Renters - 1, detached (%)
Housing units in structures - Renters - 1, attached (%)
Housing units in structures - Renters - 2 (%)
Housing units in structures - Renters - 3 or 4 (%)
Housing units in structures - Renters - 5 to 9 (%)
Housing units in structures - Renters - 10 to 19 (%)
Housing units in structures - Renters - 20 to 49 (%)
Housing units in structures - Renters - 50 or more (%)
Housing units in structures - Renters - Mobile home (%)
Housing units in structures - Renters - Boat, RV, van, etc. (%)
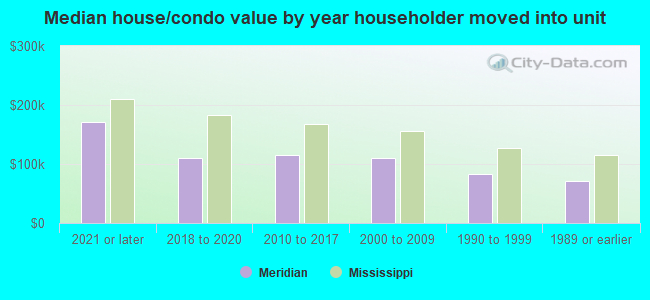
House/condo owner moved in on average (years ago)
Renter moved in on average (years ago)
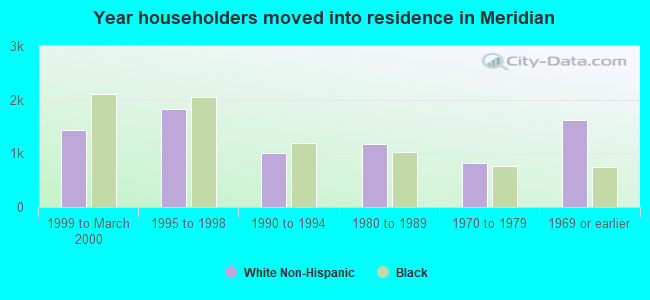
Year householder moved into unit - Moved in 1999 to March 2000 (%)
Year householder moved into unit - Moved in 1999 to March 2000 (%) - White
Year householder moved into unit - Moved in 1999 to March 2000 (%) - Black or African American
Year householder moved into unit - Moved in 1999 to March 2000 (%) - Asian
Year householder moved into unit - Moved in 1999 to March 2000 (%) - Hispanic or Latino
Year householder moved into unit - Moved in 1999 to March 2000 (%) - American Indian and Alaska Native
Year householder moved into unit - Moved in 1999 to March 2000 (%) - Multirace
Year householder moved into unit - Moved in 1999 to March 2000 (%) - Other Race
Year householder moved into unit - Moved in 1995 to 1998 (%)
Year householder moved into unit - Moved in 1995 to 1998 (%) - White
Year householder moved into unit - Moved in 1995 to 1998 (%) - Black or African American
Year householder moved into unit - Moved in 1995 to 1998 (%) - Asian
Year householder moved into unit - Moved in 1995 to 1998 (%) - Hispanic or Latino
Year householder moved into unit - Moved in 1995 to 1998 (%) - American Indian and Alaska Native
Year householder moved into unit - Moved in 1995 to 1998 (%) - Multirace
Year householder moved into unit - Moved in 1995 to 1998 (%) - Other Race
Year householder moved into unit - Moved in 1990 to 1994 (%)
Year householder moved into unit - Moved in 1990 to 1994 (%) - White
Year householder moved into unit - Moved in 1990 to 1994 (%) - Black or African American
Year householder moved into unit - Moved in 1990 to 1994 (%) - Asian
Year householder moved into unit - Moved in 1990 to 1994 (%) - Hispanic or Latino
Year householder moved into unit - Moved in 1990 to 1994 (%) - American Indian and Alaska Native
Year householder moved into unit - Moved in 1990 to 1994 (%) - Multirace
Year householder moved into unit - Moved in 1990 to 1994 (%) - Other Race
Year householder moved into unit - Moved in 1980 to 1989 (%)
Year householder moved into unit - Moved in 1980 to 1989 (%) - White
Year householder moved into unit - Moved in 1980 to 1989 (%) - Black or African American
Year householder moved into unit - Moved in 1980 to 1989 (%) - Asian
Year householder moved into unit - Moved in 1980 to 1989 (%) - Hispanic or Latino
Year householder moved into unit - Moved in 1980 to 1989 (%) - American Indian and Alaska Native
Year householder moved into unit - Moved in 1980 to 1989 (%) - Multirace
Year householder moved into unit - Moved in 1980 to 1989 (%) - Other Race
Year householder moved into unit - Moved in 1970 to 1979 (%)
Year householder moved into unit - Moved in 1970 to 1979 (%) - White
Year householder moved into unit - Moved in 1970 to 1979 (%) - Black or African American
Year householder moved into unit - Moved in 1970 to 1979 (%) - Asian
Year householder moved into unit - Moved in 1970 to 1979 (%) - Hispanic or Latino
Year householder moved into unit - Moved in 1970 to 1979 (%) - American Indian and Alaska Native
Year householder moved into unit - Moved in 1970 to 1979 (%) - Multirace
Year householder moved into unit - Moved in 1970 to 1979 (%) - Other Race
Year householder moved into unit - Moved in 1969 or earlier (%)
Year householder moved into unit - Moved in 1969 or earlier (%) - White
Year householder moved into unit - Moved in 1969 or earlier (%) - Black or African American
Year householder moved into unit - Moved in 1969 or earlier (%) - Asian
Year householder moved into unit - Moved in 1969 or earlier (%) - Hispanic or Latino
Year householder moved into unit - Moved in 1969 or earlier (%) - American Indian and Alaska Native
Year householder moved into unit - Moved in 1969 or earlier (%) - Multirace
Year householder moved into unit - Moved in 1969 or earlier (%) - Other Race
Housing units lacking complete plumbing facilities (%)
Housing units lacking complete kitchen facilities (%)
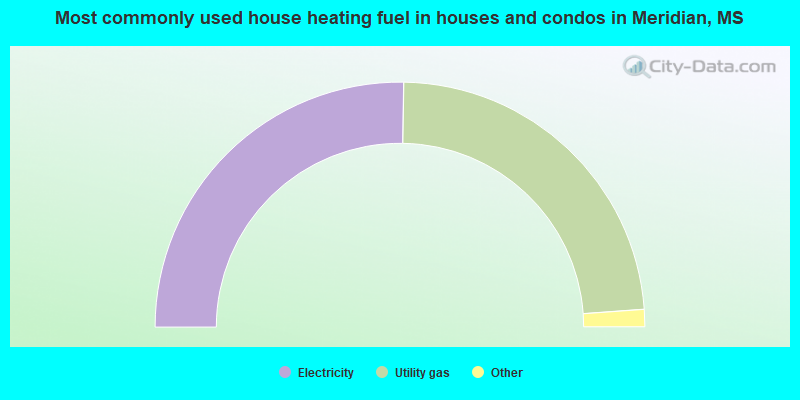
House heating fuel used in houses and condos - Utility gas (%)
House heating fuel used in houses and condos - Bottled, tank, or LP gas (%)
House heating fuel used in houses and condos - Electricity (%)
House heating fuel used in houses and condos - Fuel oil, kerosene, etc. (%)
House heating fuel used in houses and condos - Coal or coke (%)
House heating fuel used in houses and condos - Wood (%)
House heating fuel used in houses and condos - Solar energy (%)
House heating fuel used in houses and condos - Other fuel (%)
House heating fuel used in houses and condos - No fuel used (%)
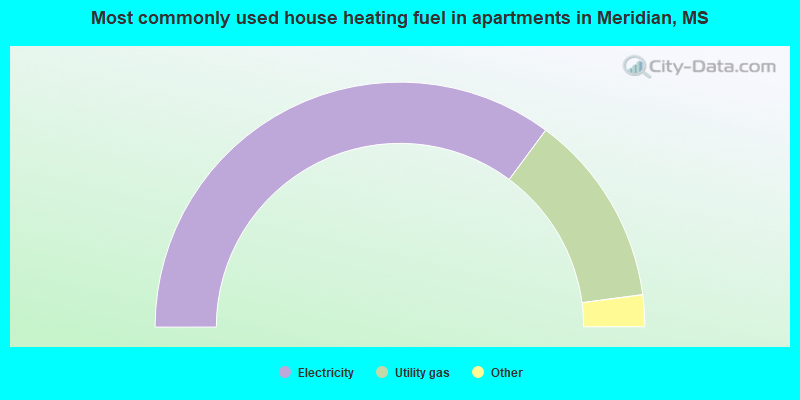
House heating fuel used in apartments - Utility gas (%)
House heating fuel used in apartments - Bottled, tank, or LP gas (%)
House heating fuel used in apartments - Electricity (%)
House heating fuel used in apartments - Fuel oil, kerosene, etc. (%)
House heating fuel used in apartments - Coal or coke (%)
House heating fuel used in apartments - Wood (%)
House heating fuel used in apartments - Solar energy (%)
House heating fuel used in apartments - Other fuel (%)
House heating fuel used in apartments - No fuel used (%)
Latest news about housing in Meridian, MS collected exclusively by city-data.com from local newspapers, TV, and radio stations
Median year house/condo built: 1968Median year apartment built: 1974Household type by relationship:
Households: 34,106
Male householders: 6,054 (2,548 living alone ), Female householders: 8,346 (2,957 living alone )4,333 spouses (4,271 opposite-sex spouses ), 544 unmarried partners , (531 opposite-sex unmarried partners ), 9,976 children (9,380 natural , 265 adopted , 330 stepchildren ), 1,310 grandchildren , 452 brothers or sisters , 397 parents , 26 foster children , 605 other relatives , 848 non-relatives In group quarters: 1,210
Size of family households: 3,757 2-persons , 2,086 3-persons , 776 4-persons , 779 5-persons , 529 6-persons , 75 7-or-more-persons .
Size of nonfamily households: 6,754 1-person , 558 2-persons , 132 3-persons , 23 4-persons , 10 5-persons .
2,535 married couples with children. single-parent households (331 men , 2,154 women ).
97.3% of residents of Meridian speak English at home. of residents speak Spanish at home (69% speak English very well , 28% speak English well , 3% don't speak English at all ).of residents speak other Indo-European language at home (95% speak English very well , 5% speak English well ).of residents speak Asian or Pacific Island language at home (60% speak English very well , 10% speak English well , 30% speak English not well ).of residents speak other language at home (53% speak English very well , 47% speak English well ).
Foreign born population: 1,031 (3.0%)of them are naturalized citizens )
Median number of rooms in houses and condos:
Median number of rooms in apartments
Owner-occupied Renter-occupied
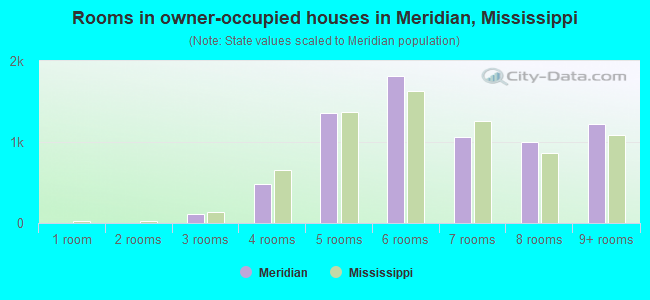
Rooms in owner-occupied houses in Meridian, Mississippi
6 1 room 0 2 rooms 113 3 rooms 476 4 rooms 1,363 5 rooms 1,811 6 rooms 1,059 7 rooms 1,000 8 rooms 1,228 9+ rooms
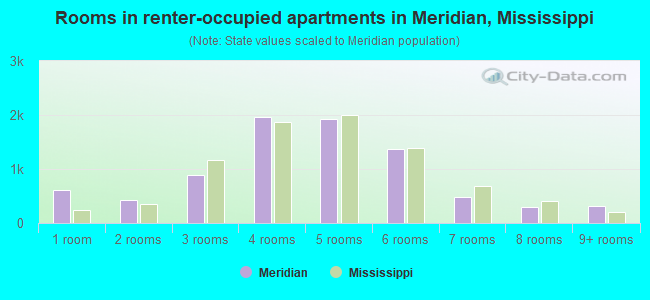
Rooms in renter-occupied apartments in Meridian, Mississippi
617 1 room 432 2 rooms 898 3 rooms 1,961 4 rooms 1,924 5 rooms 1,372 6 rooms 488 7 rooms 305 8 rooms 310 9+ rooms
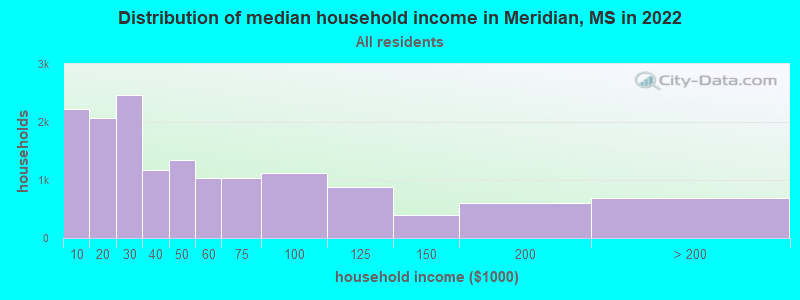
Meridian, MS household income distribution 2,217 Less than $10,0002,064 $10,000 to $19,9992,474 $20,000 to $29,9991,164 $30,000 to $39,9991,353 $40,000 to $49,9991,027 $50,000 to $59,9991,043 $60,000 to $74,9991,121 $75,000 to $99,999875 $100,000 to $124,999398 $125,000 to $149,999600 $150,000 to $199,999696 $200,000 or more
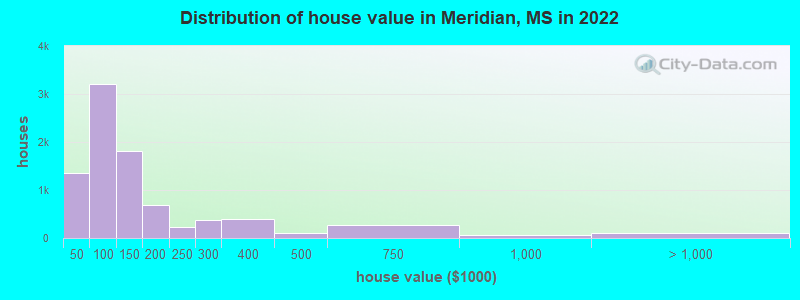
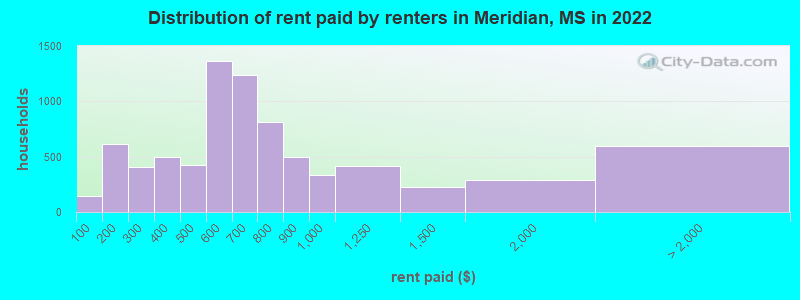
Home value of owner - occupied houses in 2022 in Meridian, MS 381 Less than $10,00021 $10,000 to $14,99937 $15,000 to $19,999101 $20,000 to $24,99954 $25,000 to $29,999233 $30,000 to $34,99999 $35,000 to $39,999422 $40,000 to $49,999278 $50,000 to $59,999456 $60,000 to $69,999565 $70,000 to $79,999680 $80,000 to $89,999801 $90,000 to $99,999710 $100,000 to $124,9991,104 $125,000 to $149,999450 $150,000 to $174,999238 $175,000 to $199,999235 $200,000 to $249,999380 $250,000 to $299,999402 $300,000 to $399,999107 $400,000 to $499,999265 $500,000 to $749,99958 $750,000 to $999,99928 $1,000,000 to $1,499,99926 $1,500,000 to $1,999,99957 $2,000,000 or moreRent paid by renters in 2022 in Meridian, MS 146 Less than $100477 $100 to $149138 $150 to $199278 $200 to $249130 $250 to $299288 $300 to $349208 $350 to $399164 $400 to $449261 $450 to $499773 $500 to $549593 $550 to $599644 $600 to $649593 $650 to $699409 $700 to $749399 $750 to $799498 $800 to $899334 $900 to $999413 $1,000 to $1,249226 $1,250 to $1,499285 $1,500 to $1,999594 No cash rent
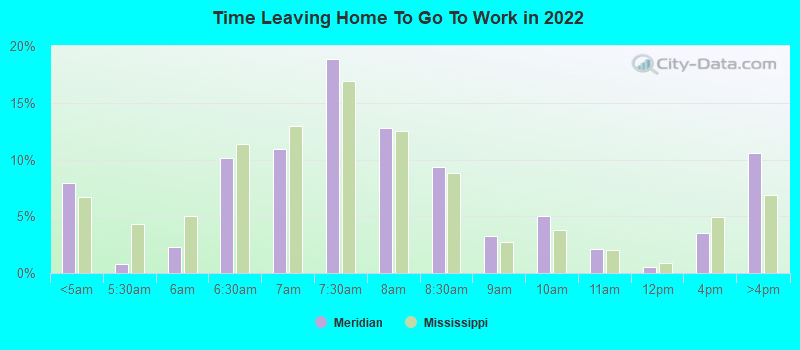
Percentage of workers working in this county: 91.6%Number of people working at home: 619 (4.6% of all workers )
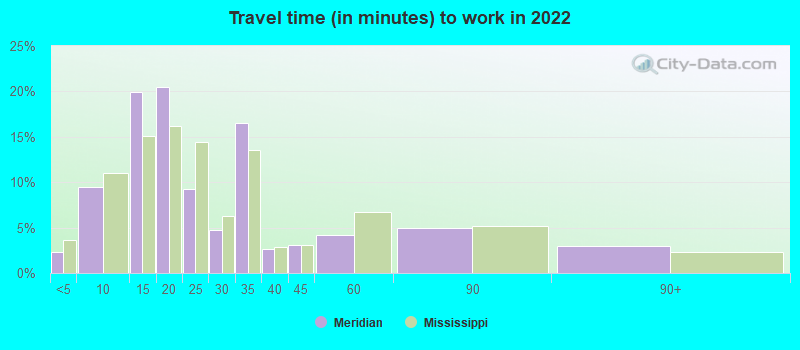
Travel time to work (commute)
Less than 5 minutes: 4815 to 9 minutes: 2,07210 to 14 minutes: 4,51615 to 19 minutes: 3,10320 to 24 minutes: 1,03125 to 29 minutes: 10930 to 34 minutes: 76035 to 39 minutes: 4240 to 44 minutes: 16445 to 59 minutes: 29460 to 89 minutes: 86290 or more minutes: 222
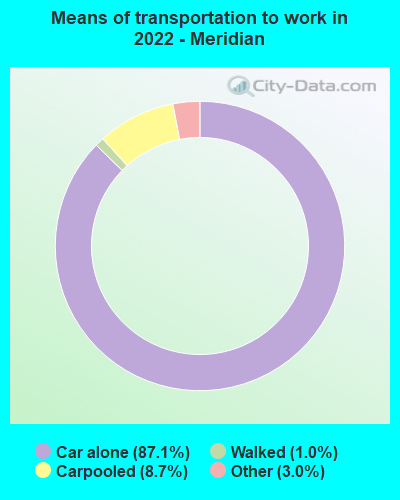
Means of transportation to work:
Drove a car alone: 22,177 (83.5%)Carpooled: 2,479 (9.3%)Ferryboat: 30 (0.1%)Taxi: 629 (2.4%)Bicycle: 17 (0.1%)Walked: 310 (1.2%)Worked at home: 619 (2.3%)
Unemployment by race in 2022
Unemployment rate for White non-Hispanic residents 11.1% Males7.3% FemalesUnemployment rate for Black residents 7.7% Males9.1% FemalesUnemployment rate for two or more race residents 13.0% Females
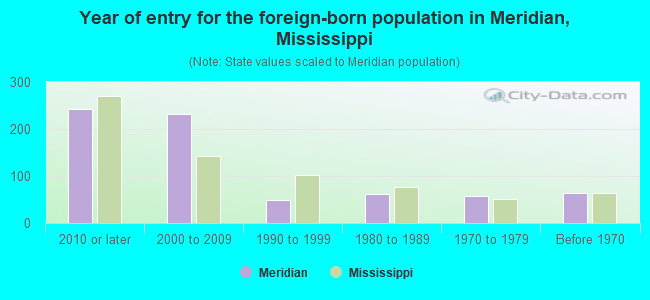
Year of entry for the foreign-born population in Meridian, Mississippi
243 2010 or later 231 2000 to 2009 49 1990 to 1999 61 1980 to 1989 58 1970 to 1979 63 Before 1970
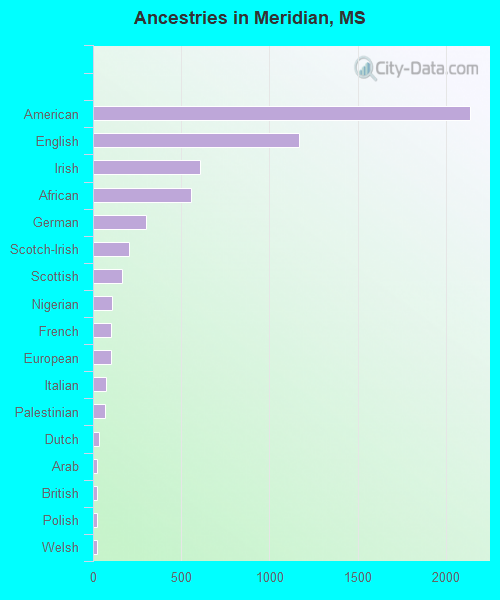
First ancestries reported:
American: 2,138 (9.2%)
English: 1,167 (5.0%)
Irish: 609 (2.6%)
African: 556 (2.4%)
German: 299 (1.3%)
Scotch-Irish: 205 (0.9%)
Scottish: 165 (0.7%)
Nigerian: 107 (0.5%)
French: 103 (0.4%)
European: 102 (0.4%)
Italian: 72 (0.3%)
Palestinian: 68 (0.3%)
Dutch: 32 (0.1%)
Arab: 21 (0.09%)
British: 20 (0.09%)
Polish: 20 (0.09%)
Welsh: 20 (0.09%)
Norwegian: 19 (0.08%)
Greek: 18 (0.08%)
Romanian: 17 (0.07%)
Czech: 15 (0.06%)
Swedish: 15 (0.06%)
Austrian: 12 (0.05%)
Northern European: 9 (0.04%)
Danish: 8 (0.03%)
Hungarian: 8 (0.03%)
French Canadian: 2 (0.01%) Most common places of birth for foreign-born residents (%): India Meridian:
13.9% (99)Mississippi:
6.3% (4,325)
Mexico Meridian:
12.0% (86)Mississippi:
25.4% (17,354)
Honduras Meridian:
10.5% (75)Mississippi:
5.1% (3,475)
Venezuela Meridian:
8.5% (61)Mississippi:
0.3% (200)
China, excluding Hong Kong and Taiwan Meridian:
6.0% (43)Mississippi:
4.3% (2,948)
Nigeria Meridian:
6.0% (43)Mississippi:
1.1% (718)
Scotland Meridian:
5.9% (42)Mississippi:
0.4% (242)
Asia, n.e.c. Meridian:
5.7% (41)Mississippi:
0.2% (144)
Philippines Meridian:
4.5% (32)Mississippi:
4.7% (3,211)
Jamaica Meridian:
4.5% (32)Mississippi:
1.3% (899)
Yemen Meridian:
3.8% (27)Mississippi:
1.0% (680)
Georgia Meridian:
3.5% (25)Mississippi:
0.0% (24)
Dominican Republic Meridian:
2.8% (20)Mississippi:
1.9% (1,324)
Nicaragua Meridian:
2.4% (17)Mississippi:
0.5% (325)
Ethiopia Meridian:
2.0% (14)Mississippi:
0.5% (314)
Cambodia Meridian:
1.8% (13)Mississippi:
0.2% (149)
El Salvador Meridian:
1.7% (12)Mississippi:
0.9% (646)
Korea Meridian:
1.5% (11)Mississippi:
1.5% (1,043)
Place of birth for U.S.-born residents:
This state: 26,143Other state: 6,705Northeast: 532Midwest: 652South: 4,446West: 1,015 85.9% of Meridian residents lived in the same house 1 years ago.
Out of people who lived in different houses, 34.0% lived in this county.
Out of people who lived in different counties, 57.6% lived in Mississippi.
Meridian:
85.9%State average:
88.9%
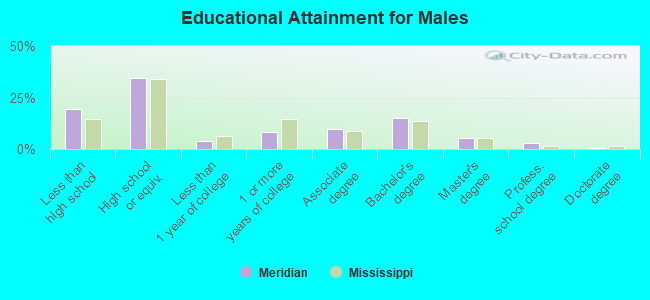
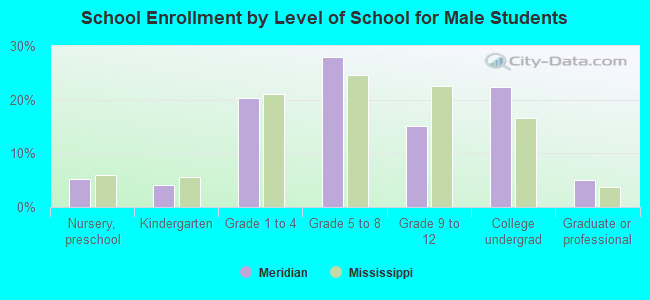
Education attainment for males 25 years and older:
No schooling: 198Nursery to 4th grade: 1015th and 6th grade: 1147th and 8th grade: 2269th grade: 21310th grade: 21811th grade: 72512th grade, no diploma: 261High school graduate (or equivalency): 3,608Less than 1 year of college: 402Some college more than 1 year, no degree: 885Associate degree: 1,037Bachelor's degree: 1,572Master's degree: 573Professional school degree: 302Doctorate degree: 44
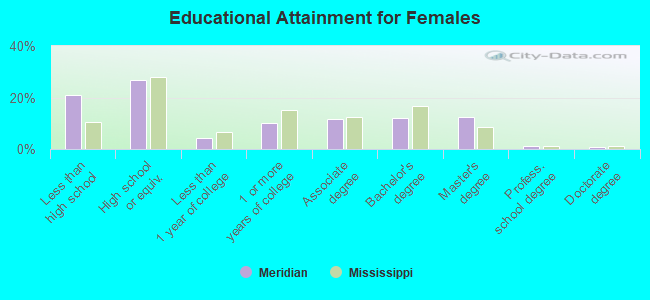
Education attainment for females 25 years and older:
No schooling: 488Nursery to 4th grade: 295th and 6th grade: 1877th and 8th grade: 1959th grade: 11710th grade: 52411th grade: 53012th grade, no diploma: 637High school graduate (or equivalency): 3,458Less than 1 year of college: 549Some college more than 1 year, no degree: 1,290Associate degree: 1,493Bachelor's degree: 1,559Master's degree: 1,578Professional school degree: 137Doctorate degree: 76
Housing units in structures:
One, detached: 10,824One, attached: 293Two: 9523 or 4: 1,9845 to 9: 1,71010 to 19: 60620 to 49: 52550 or more: 666Mobile homes: 237Median worth of mobile homes: $41,145
Housing units lacking complete plumbing facilities in 2022: 6.5%Housing units lacking complete kitchen facilities in 2022: 9.5%House/condo owner moved in on average 16 years ago
Renter moved in on average 3 years ago
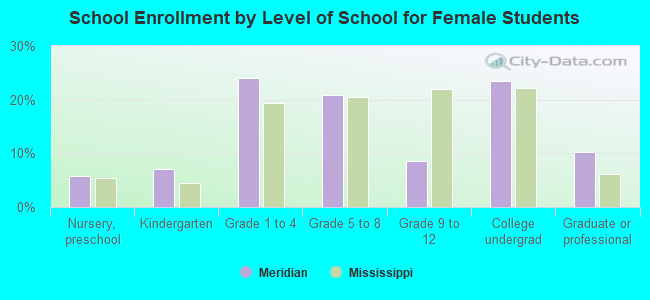
Private vs. public school enrollment:
Students in private schools in grades 1 to 8 (elementary and middle school): 496 Here:
12.5%Mississippi:
16.1%
Students in private schools in grades 9 to 12 (high school): 100 Here:
9.3%Mississippi:
14.6%
Students in private undergraduate colleges: 68 Here:
3.2%Mississippi:
12.8%