Merrimac, VA (Virginia) Houses and Residents
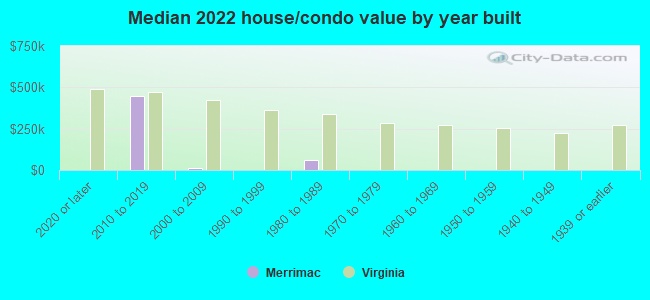
| Merrimac: | $131,222 |
| Virginia: | $365,700 |
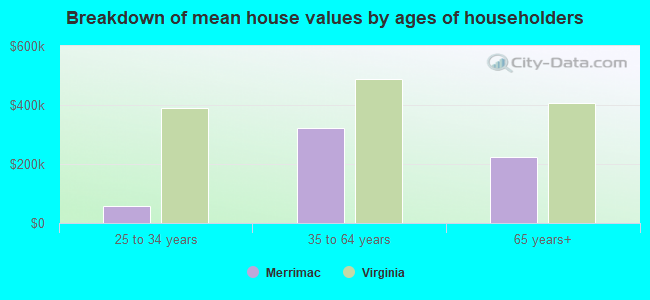
Mean price in 2022:
Detached houses: $335,195
Here: $335,195 State: $472,865 Townhouses or other attached units: $238,573
Here: $238,573 State: $457,437 Mobile homes: $34,382
Here: $34,382 State: $100,736
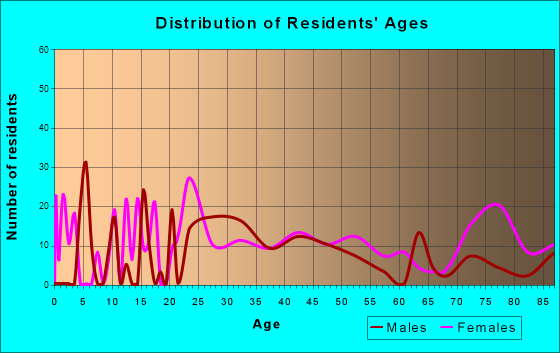
Total population: 2,133 (Urban population: 1,705, Rural population: 111 (all nonfarm))
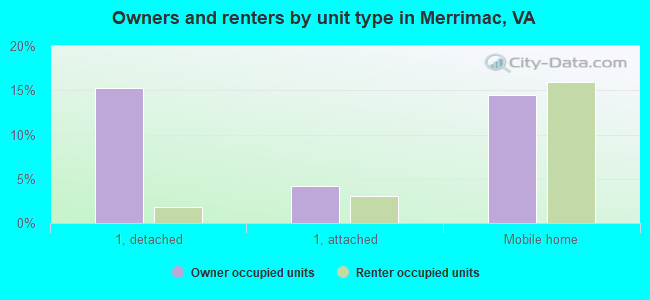
Houses: 1,712 (1,509 occupied: 482 owner occupied, 998 renter occupied)
| % of renters here: | 67% |
| State: | 33% |
Housing density: 942 houses/condos per square mile
Median price asked for vacant for-sale houses and condos in 2022 in this county: $270,543.
Median contract rent in 2022: $829 (lower quartile is $527, upper quartile is $1,309)
Median rent asked for vacant for-rent units in 2022: $1,809
Median gross rent in Merrimac, VA in 2022: $968
Housing units in Merrimac with a mortgage: 65 (0 second mortgage, 0 home equity loan, 0 both second mortgage and home equity loan)
Houses without a mortgage: 0
Median household income for houses/condos with a mortgage: $103,186
Median household income for apartments without a mortgage: $77,999
Median monthly housing costs: $823
Compare current foreclosures near Merrimac, VA:
| Photo | Address | Area | Beds / Baths | Price | Details |
|---|---|---|---|---|---|

|
#1
Bow Hill Rd
Christiansburg, VA 24073
|
934 sq. feet
|
1 baths 2 beds |
$36,800
|
show details |

|
#2
Peppers Ferry Blvd
Radford, VA 24141
|
840 sq. feet
|
1 baths 2 beds |
show details | |

|
#3
Martins Creek Rd
Roanoke, VA 24018
|
1,962 sq. feet
|
2 baths 3 beds |
show details | |

|
#4
Flick Dr
Shawsville, VA 24162
|
982 sq. feet
|
1 baths 2 beds |
show details | |

|
#5
Walton Rd
Radford, VA 24141
|
1,836 sq. feet
|
2 baths 3 beds |
show details | |

|
#6
Springview Dr
Christiansburg, VA 24073
|
960 sq. feet
|
1 baths 3 beds |
show details | |

|
#7
Leather Rd
Christiansburg, VA 24073
|
2,352 sq. feet
|
2 baths 3 beds |
show details | |

|
#8
Mud Pike
Christiansburg, VA 24073
|
1,457 sq. feet
|
1 baths 3 beds |
show details | |

|
#9
Whitethorne Rd
Blacksburg, VA 24060
|
1,232 sq. feet
|
1 baths 2 beds |
show details | |

|
#10
Union Valley Rd
Riner, VA 24149
|
1,440 sq. feet
|
2 baths 2 beds |
show details |
| Photo | Address | Area | Beds / Baths | Price | Details |
|---|---|---|---|---|---|

|
#11
Union Valley Rd
Riner, VA 24149
|
1,120 sq. feet
|
1 baths 3 beds |
show details | |

|
#12
Schoolhouse Dr
Riner, VA 24149
|
1,984 sq. feet
|
3 baths 4 beds |
show details | |

|
#13
Helm Dr
Elliston, VA 24087
|
1,896 sq. feet
|
2 baths 3 beds |
show details | |

|
#14
Mahone St # 1
Christiansburg, VA 24073
|
1,272 sq. feet
|
2 baths 4 beds |
show details | |

|
#15
Divine Dr
Christiansburg, VA 24073
|
3,339 sq. feet
|
3 baths 4 beds |
show details | |

|
#16
Weston Rd
Riner, VA 24149
|
1,488 sq. feet
|
2 baths 3 beds |
show details | |

|
#17
Catawba Rd
Catawba, VA 24070
|
2,284 sq. feet
|
2 baths 4 beds |
show details | |

|
#18
Eggleston Rd
Pembroke, VA 24136
|
1,152 sq. feet
|
2 baths 3 beds |
show details | |

|
#19
Big Branch Rd
Riner, VA 24149
|
1,296 sq. feet
|
2 baths 3 beds |
show details | |

|
#20
Horseshoe Farm Rd
Pembroke, VA 24136
|
3,678 sq. feet
|
3 baths 4 beds |
show details |
| Photo | Address | Area | Beds / Baths | Price | Details |
|---|---|---|---|---|---|

|
#21
Dolphus Ave
Dublin, VA 24084
|
- sq. feet
|
1 baths 3 beds |
show details | |

|
#22
Eppling Ln # And
Pembroke, VA 24136
|
748 sq. feet
|
1 baths 2 beds |
show details | |

|
#23
Eppling L 6
Pembroke, VA 24136
|
748 sq. feet
|
1 baths 2 beds |
show details | |

|
#24
Cherokee Hills Dr
Salem, VA 24153
|
1,827 sq. feet
|
4 baths 4 beds |
show details | |

|
#25
Rocky Rd
Bent Mountain, VA 24059
|
1,000 sq. feet
|
1 baths 3 beds |
show details | |

|
#26
Mccoy Rd
Blacksburg, VA 24060
|
1,600 sq. feet
|
1 baths 3 beds |
show details | |

|
#27
Duluth Rd
Blacksburg, VA 24060
|
1,512 sq. feet
|
2 baths 3 beds |
show details | |

|
#28
Harding Rd
Blacksburg, VA 24060
|
2,236 sq. feet
|
1 baths 3 beds |
show details | |

|
#29
Cambria St NE
Christiansburg, VA 24073
|
2,196 sq. feet
|
1 baths 3 beds |
show details | |

|
#30
Cambria St NW
Christiansburg, VA 24073
|
2,261 sq. feet
|
2 baths 3 beds |
show details |
| Photo | Address | Area | Beds / Baths | Price | Details |
|---|---|---|---|---|---|

|
#31
Victory Hts
Christiansburg, VA 24073
|
910 sq. feet
|
1 baths 2 beds |
show details | |

|
#32
Overlook Dr
Christiansburg, VA 24073
|
1,408 sq. feet
|
2 baths 3 beds |
show details | |

|
#33
Hutcheson Dr
Blacksburg, VA 24060
|
2,889 sq. feet
|
3 baths 3 beds |
show details | |

|
#34
Prices Fork Rd
Blacksburg, VA 24060
|
1,504 sq. feet
|
1 baths 3 beds |
show details | |

|
#35
Huckleberry St
Christiansburg, VA 24073
|
720 sq. feet
|
1 baths 2 beds |
show details | |

|
#36
Brown St
Christiansburg, VA 24073
|
846 sq. feet
|
1 baths 2 beds |
show details | |

|
#37
Calico Ln
Blacksburg, VA 24060
|
1,608 sq. feet
|
2 baths 3 beds |
show details | |

|
#38
Huff Ln
Blacksburg, VA 24060
|
1,296 sq. feet
|
2 baths 3 beds |
show details | |

|
#39
Madison Ave
Christiansburg, VA 24073
|
2,060 sq. feet
|
3 baths - beds |
show details | |

|
#40
Riner Rd
Riner, VA 24149
|
- sq. feet
|
- baths - beds |
show details |
| Photo | Address | Area | Beds / Baths | Price | Details |
|---|---|---|---|---|---|

|
#41
Old Route 11
Dublin, VA 24084
|
- sq. feet
|
- baths - beds |
show details | |

|
#42
Blossom Trl E
Blacksburg, VA 24060
|
- sq. feet
|
- baths - beds |
show details | |

|
#43
Helm Dr
Elliston, VA 24087
|
- sq. feet
|
- baths - beds |
show details | |

|
#44
Kelsey Ln
Blacksburg, VA 24060
|
- sq. feet
|
- baths - beds |
show details | |

|
#45
Pin Oak Dr NW
Christiansburg, VA 24073
|
- sq. feet
|
- baths - beds |
show details | |

|
#46
Via Liberty
Christiansburg, VA 24073
|
- sq. feet
|
- baths - beds |
show details | |

|
#47
Bunting Ln
Pembroke, VA 24136
|
- sq. feet
|
- baths - beds |
show details | |

|
#48
Crest Mountain Cir
Elliston, VA 24087
|
- sq. feet
|
- baths - beds |
show details | |

|
#49
Sons Dr NW
Riner, VA 24149
|
- sq. feet
|
- baths - beds |
show details | |

|
Check over 1 million property listings on Foreclosure.com!
|
browse all offers | |||

Latest news about housing in Merrimac, VA collected exclusively by city-data.com from local newspapers, TV, and radio stations

 | Suffolk: New Development to bring New Homes and Businesses in One Community (3 replies) |
| need rental home in suffolk help! (3 replies) |
| Gorgeous Houses/Neighborhood - HELP! (10 replies) |
| Work in Newport News, live....? (6 replies) |
| Virginia Beach in the winter? (59 replies) |
| If my husband works in Newport News for Riverside, would this work? (12 replies) |
Median year apartment built: 1988
Household type by relationship:
Households: 2,706- Male householders: 764 (317 living alone), Female householders: 689 (434 living alone)
223 spouses (223 opposite-sex spouses), 184 unmarried partners, (176 opposite-sex unmarried partners), 320 children (297 natural, 0 adopted, 22 stepchildren), 25 grandchildren, 48 brothers or sisters, 97 parents, 0 foster children, 42 other relatives, 159 non-relatives
- In group quarters: 149
Size of family households: 227 2-persons, 64 3-persons, 72 4-persons, 95 5-persons.
Size of nonfamily households: 639 1-person, 307 2-persons, 5 3-persons.
157 married couples with children.
68 single-parent households (0 men, 68 women).
86.1% of residents of Merrimac speak English at home.
8.8% of residents speak Spanish at home (87% speak English very well, 6% speak English well, 6% speak English not well).
2.4% of residents speak other Indo-European language at home (100% speak English very well).
2.8% of residents speak Asian or Pacific Island language at home (65% speak English very well, 23% speak English well, 12% speak English not well).
0.6% of residents speak other language at home (100% speak English very well).
Foreign born population: 408 (15.1%)
(23.5% of them are naturalized citizens)
| Here: | 5.0 |
| State: | 7.0 |
| Here: | 3.2 |
| State: | 4.3 |
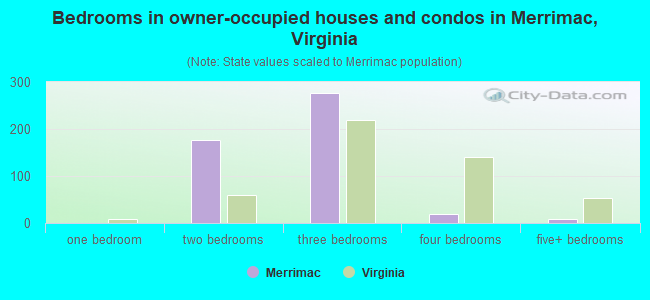
- Bedrooms in owner-occupied houses and condos in Merrimac, Virginia
- 0no bedroom
- 01 bedroom
- 1772 bedrooms
- 2773 bedrooms
- 194 bedrooms
- 95+ bedrooms
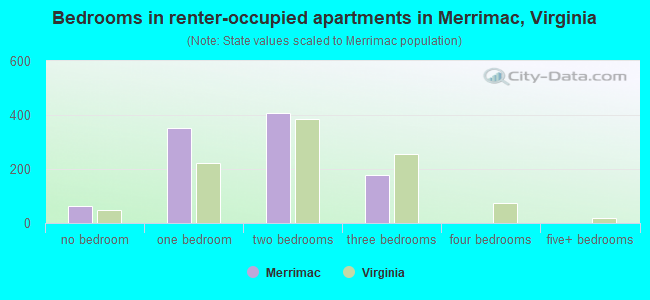
- Bedrooms in renter-occupied apartments in Merrimac, Virginia
- 62no bedroom
- 3511 bedroom
- 4082 bedrooms
- 1773 bedrooms
- 04 bedrooms
- 05+ bedrooms
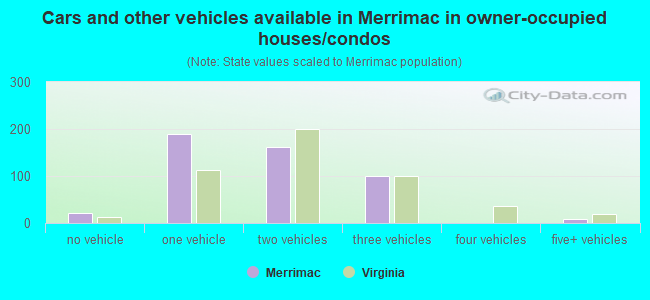
- Cars and other vehicles available in Merrimac in owner-occupied houses/condos
- 21no vehicle
- 1891 vehicle
- 1622 vehicles
- 1003 vehicles
- 04 vehicles
- 95+ vehicles
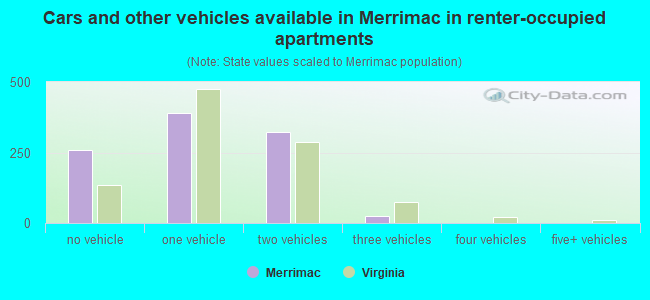
- Cars and other vehicles available in Merrimac in renter-occupied apartments
- 259no vehicle
- 3911 vehicle
- 3212 vehicles
- 263 vehicles
- 04 vehicles
- 05+ vehicles
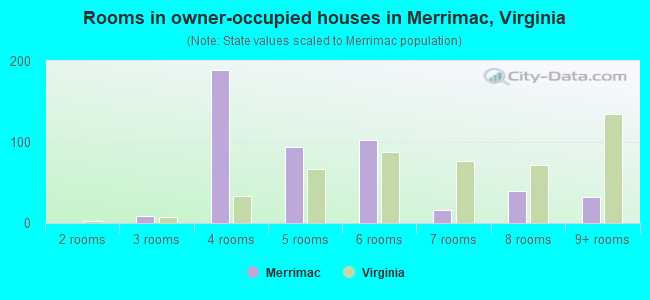
- Rooms in owner-occupied houses in Merrimac, Virginia
- 01 room
- 02 rooms
- 93 rooms
- 1894 rooms
- 945 rooms
- 1026 rooms
- 167 rooms
- 398 rooms
- 329+ rooms
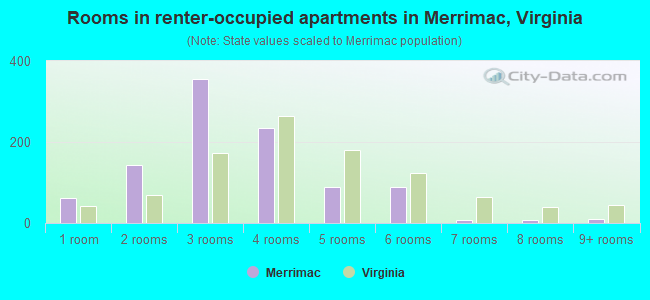
- Rooms in renter-occupied apartments in Merrimac, Virginia
- 621 room
- 1432 rooms
- 3553 rooms
- 2344 rooms
- 895 rooms
- 906 rooms
- 87 rooms
- 88 rooms
- 99+ rooms
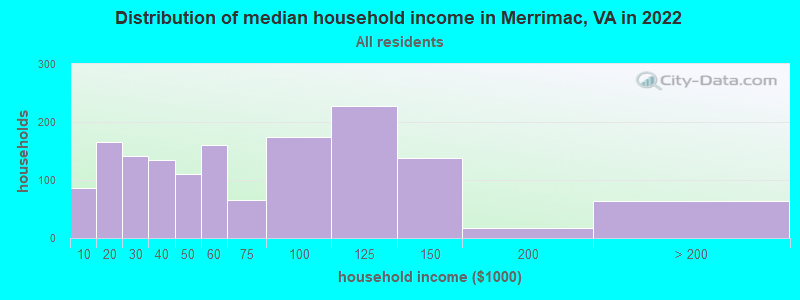
Merrimac, VA household income distribution

- 86Less than $10,000
- 165$10,000 to $19,999
- 142$20,000 to $29,999
- 135$30,000 to $39,999
- 110$40,000 to $49,999
- 161$50,000 to $59,999
- 66$60,000 to $74,999
- 175$75,000 to $99,999
- 228$100,000 to $124,999
- 138$125,000 to $149,999
- 18$150,000 to $199,999
- 64$200,000 or more
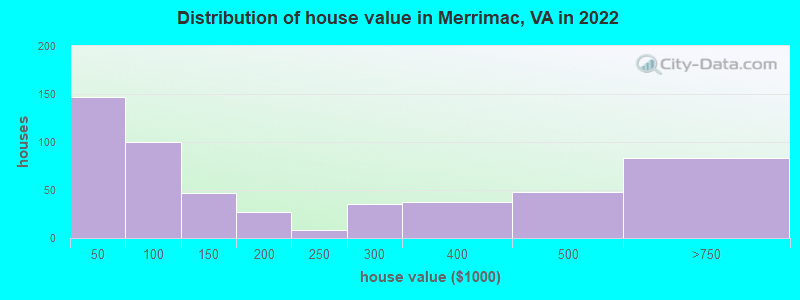
Home value of owner - occupied houses in 2022 in Merrimac, VA
-
- 51Less than $10,000
- 20$10,000 to $14,999
- 13$15,000 to $19,999
- 13$35,000 to $39,999
- 47$40,000 to $49,999
- 52$60,000 to $69,999
- 43$100,000 to $124,999
- 4$125,000 to $149,999
- 26$175,000 to $199,999
- 8$200,000 to $249,999
- 35$250,000 to $299,999
- 36$300,000 to $399,999
- 47$400,000 to $499,999
- 83$500,000 to $749,999
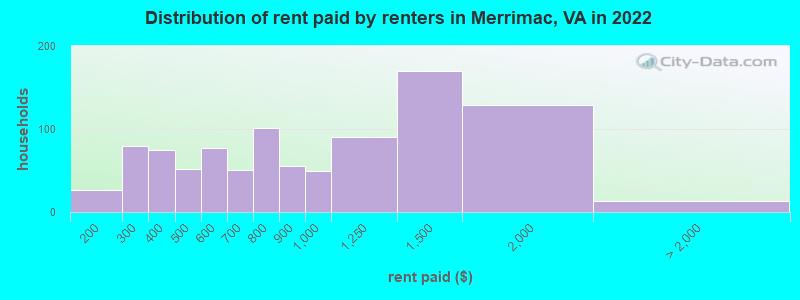
Rent paid by renters in 2022 in Merrimac, VA
-
- 26$150 to $199
- 79$250 to $299
- 17$300 to $349
- 58$350 to $399
- 52$400 to $449
- 65$500 to $549
- 11$550 to $599
- 23$600 to $649
- 27$650 to $699
- 67$700 to $749
- 33$750 to $799
- 56$800 to $899
- 50$900 to $999
- 89$1,000 to $1,249
- 170$1,250 to $1,499
- 128$1,500 to $1,999
- 13$3,500 or more
Percentage of workers working in this county: 93.0%
Number of people working at home: 77 (6.9% of all workers)
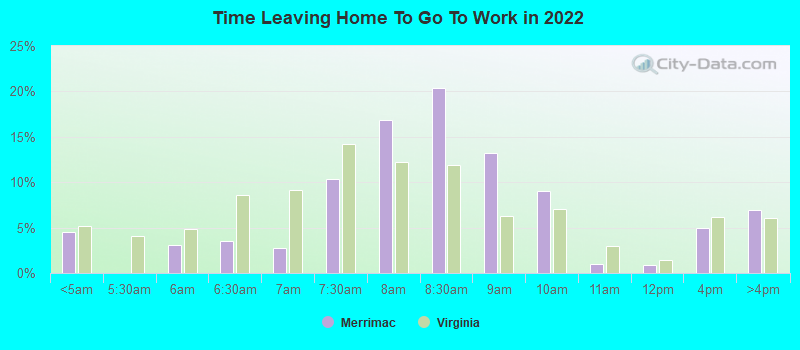
Travel time to work (commute)
- Less than 5 minutes: 0
- 5 to 9 minutes: 270
- 10 to 14 minutes: 434
- 15 to 19 minutes: 163
- 20 to 24 minutes: 96
- 25 to 29 minutes: 0
- 30 to 34 minutes: 27
- 35 to 39 minutes: 0
- 40 to 44 minutes: 0
- 45 to 59 minutes: 58
- 60 to 89 minutes: 5
- 90 or more minutes: 0
Means of transportation to work:
- Drove a car alone: 573 (80.6%)
- Carpooled: 90 (12.7%)
- Walked: 13 (1.8%)
- Other means: 22 (3.1%)
- Worked at home: 13 (1.8%)

- Unemployment by race in 2022
- Unemployment rate for White non-Hispanic residents
- 8.9%Males
- Unemployment rate for two or more race residents
- 37.8%Males
- Unemployment rate for Hispanic or Latino residents
- 19.2%Males
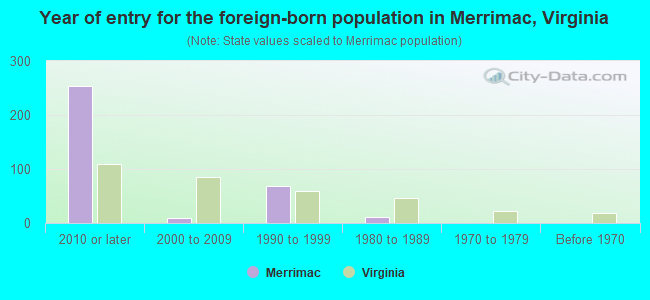
- Year of entry for the foreign-born population in Merrimac, Virginia
- 2542010 or later
- 92000 to 2009
- 681990 to 1999
- 121980 to 1989
- 01970 to 1979
- 0Before 1970
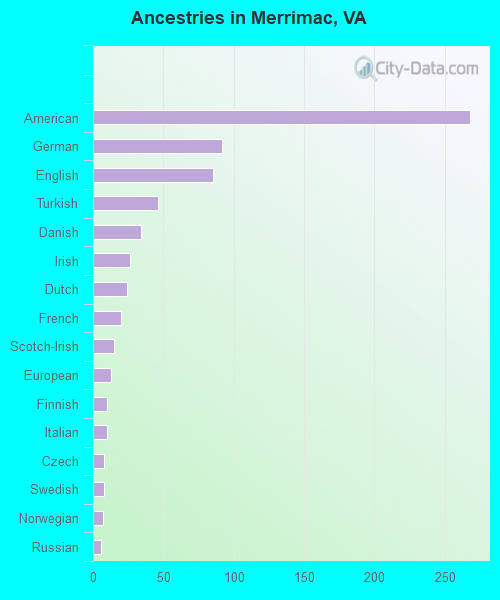
First ancestries reported:
- American: 268 (20.0%)
- German: 92 (6.9%)
- English: 85 (6.3%)
- Turkish: 46 (3.4%)
- Danish: 34 (2.5%)
- Irish: 26 (1.9%)
- Dutch: 24 (1.8%)
- French: 20 (1.5%)
- Scotch-Irish: 15 (1.1%)
- European: 13 (1.0%)
- Finnish: 10 (0.7%)
- Italian: 10 (0.7%)
- Czech: 8 (0.6%)
- Swedish: 8 (0.6%)
- Norwegian: 7 (0.5%)
- Russian: 6 (0.4%)
Most common places of birth for foreign-born residents (%):
| Merrimac: | 27.2% (104) |
| Virginia: | 5.3% (57,498) |
| Merrimac: | 18.3% (70) |
| Virginia: | 0.2% (1,681) |
| Merrimac: | 18.0% (69) |
| Virginia: | 9.0% (97,830) |
| Merrimac: | 8.4% (32) |
| Virginia: | 3.9% (42,989) |
| Merrimac: | 6.8% (26) |
| Virginia: | 1.1% (12,049) |
| Merrimac: | 4.4% (17) |
| Virginia: | 0.2% (2,246) |
| Merrimac: | 4.2% (16) |
| Virginia: | 0.8% (8,805) |
| Merrimac: | 4.2% (16) |
| Virginia: | 9.9% (107,534) |
| Merrimac: | 2.1% (8) |
| Virginia: | 0.1% (1,170) |
| Merrimac: | 1.8% (7) |
| Virginia: | 0.9% (9,440) |
| Merrimac: | 1.6% (6) |
| Virginia: | 0.1% (1,368) |
| Merrimac: | 1.6% (6) |
| Virginia: | 1.7% (18,227) |
| Merrimac: | 1.6% (6) |
| Virginia: | 0.1% (1,002) |
Place of birth for U.S.-born residents:
- This state: 1,152
- Other state: 1,040
- Northeast: 274
- Midwest: 64
- South: 678
- West: 49
81.4% of Merrimac residents lived in the same house 1 years ago.
Out of people who lived in different houses, 26.5% lived in this county.
Out of people who lived in different counties, 55.1% lived in Virginia.
| Merrimac: | 81.4% |
| State average: | 86.6% |
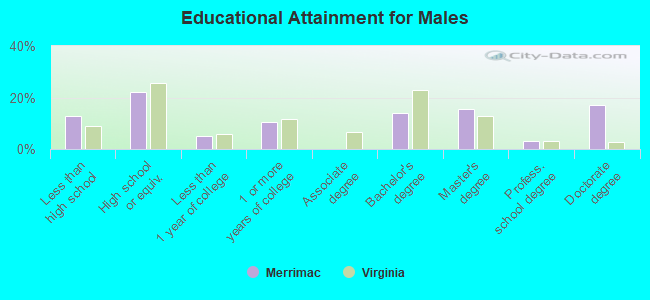
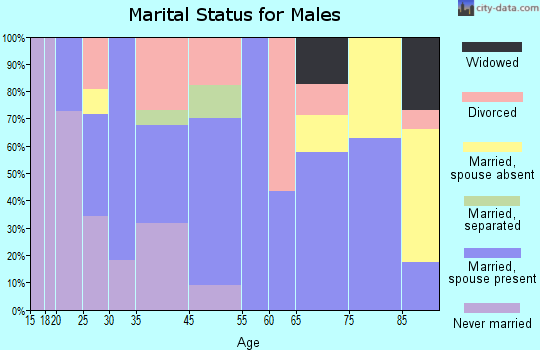
Education attainment for males 25 years and older:
- No schooling: 27
- Nursery to 4th grade: 17
- 5th and 6th grade: 0
- 7th and 8th grade: 22
- 9th grade: 0
- 10th grade: 0
- 11th grade: 39
- 12th grade, no diploma: 16
- High school graduate (or equivalency): 210
- Less than 1 year of college: 48
- Some college more than 1 year, no degree: 99
- Associate degree: 0
- Bachelor's degree: 132
- Master's degree: 149
- Professional school degree: 30
- Doctorate degree: 161
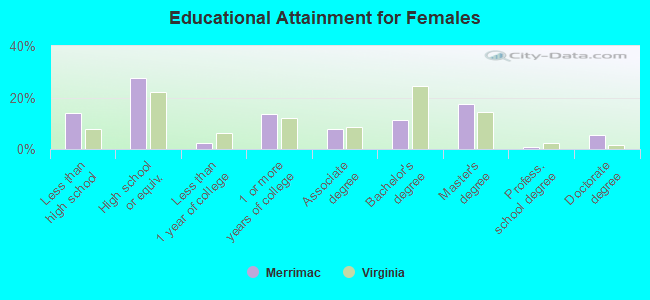
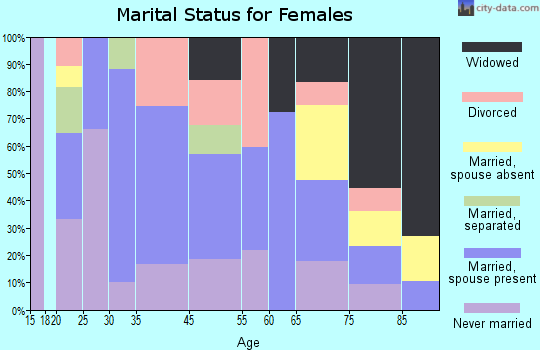
Education attainment for females 25 years and older:
- No schooling: 0
- Nursery to 4th grade: 0
- 5th and 6th grade: 48
- 7th and 8th grade: 4
- 9th grade: 39
- 10th grade: 51
- 11th grade: 0
- 12th grade, no diploma: 17
- High school graduate (or equivalency): 311
- Less than 1 year of college: 27
- Some college more than 1 year, no degree: 152
- Associate degree: 86
- Bachelor's degree: 127
- Master's degree: 195
- Professional school degree: 8
- Doctorate degree: 63
Housing units in structures:
- One, detached: 314
- One, attached: 43
- Two: 9
- 3 or 4: 55
- 5 to 9: 79
- 10 to 19: 336
- 20 to 49: 155
- 50 or more: 222
- Mobile homes: 496
Housing units lacking complete kitchen facilities in 2022: 6.2%
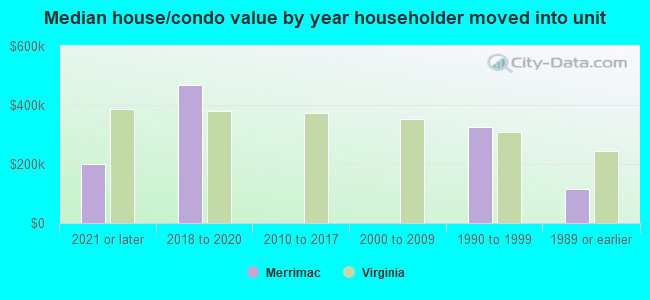
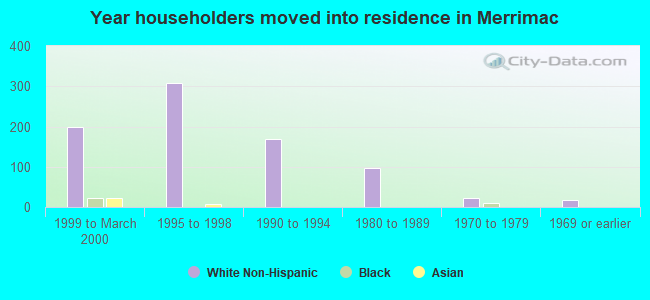
House/condo owner moved in on average 8 years ago
Renter moved in on average -1 years ago
- 89.9%Electricity
- 10.1%Utility gas
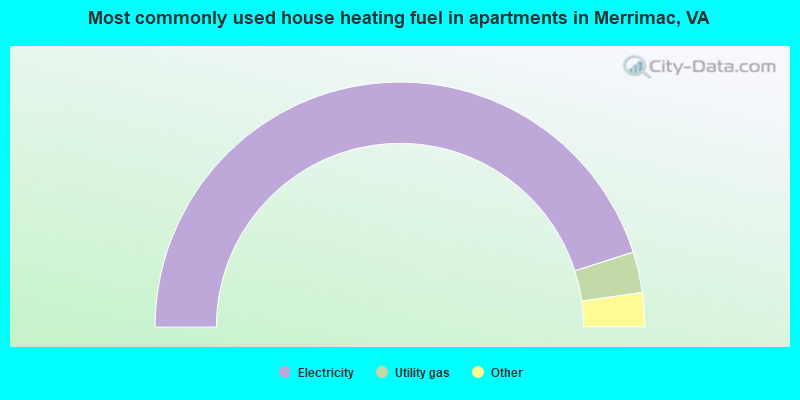
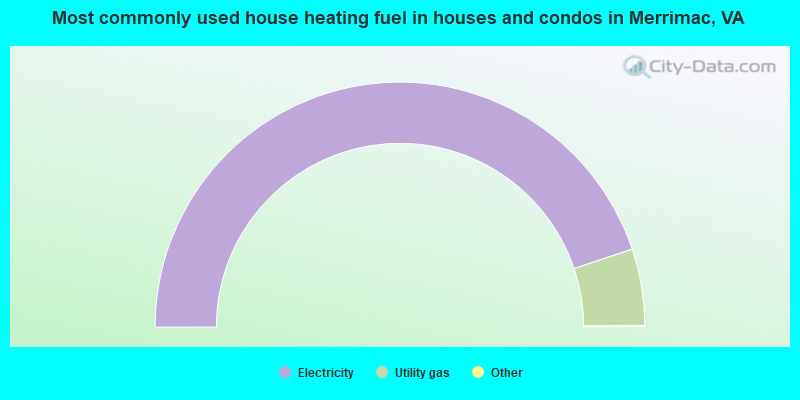
- 90.3%Electricity
- 5.4%Utility gas
- 2.7%Fuel oil, kerosene, etc.
- 0.9%Bottled, tank, or LP gas
- 0.7%No fuel used
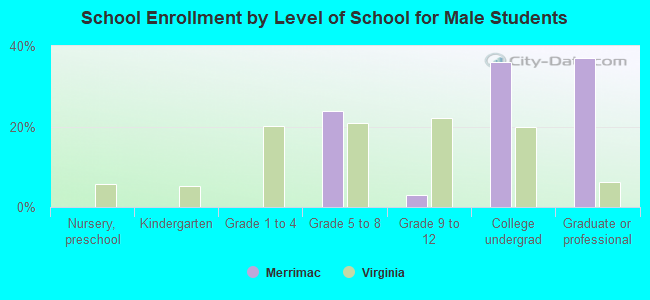
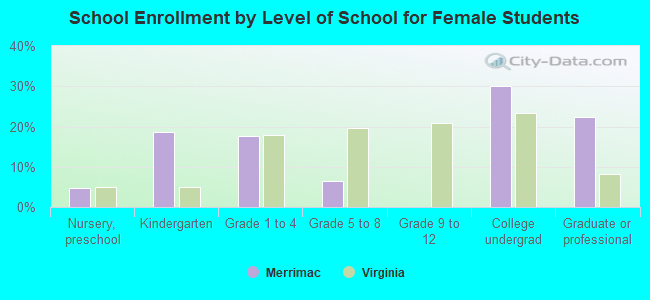
Private vs. public school enrollment:
| Here: | 0.0% |
| Virginia: | 13.2% |
| Here: | 0.0% |
| Virginia: | 10.2% |
| Here: | 0.0% |
| Virginia: | 18.7% |