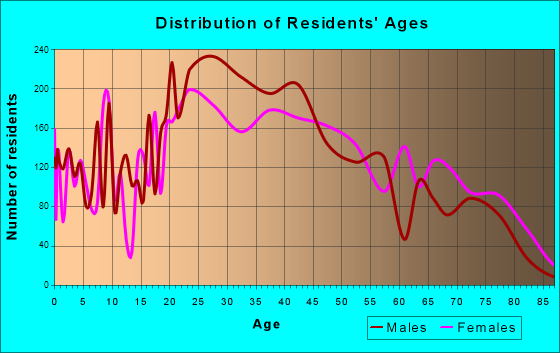
Myrtle Beach, SC (South Carolina) Houses and Residents
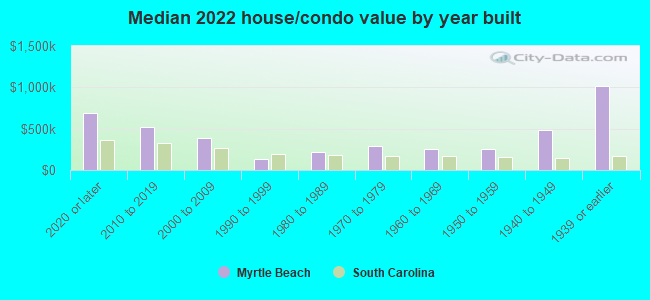
| Myrtle Beach: | $349,400 |
| South Carolina: | $254,600 |
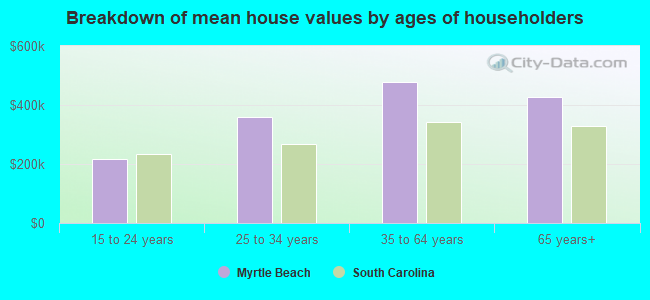
Mean price in 2022:
Detached houses: $517,738
Here: $517,738 State: $368,255 Townhouses or other attached units: $288,994
Here: $288,994 State: $292,023 In 2-unit structures: $187,464
Here: $187,464 State: $358,283 In 3-to-4-unit structures: $250,449
Here: $250,449 State: $230,702 In 5-or-more-unit structures: $189,644
Here: $189,644 State: $326,361 Mobile homes: $99,112
Here: $99,112 State: $102,531
Total population: 29,992 (Urban population: 22,575, Rural population: 32 (all nonfarm))
Houses: 25,418 (17,027 occupied: 11,177 owner occupied, 7,270 renter occupied)
| % of renters here: | 39% |
| State: | 28% |
Housing density: 1,515 houses/condos per square mile
Median price asked for vacant for-sale houses and condos in 2022: $355,476.
Median contract rent in 2022: $986 (lower quartile is $733, upper quartile is $1,347)
Median rent asked for vacant for-rent units in 2022: $2,995
Median gross rent in Myrtle Beach, SC in 2022: $1,144
Housing units in Myrtle Beach with a mortgage: 5,789 (661 second mortgage, 0 home equity loan, 671 both second mortgage and home equity loan)
Houses without a mortgage: 161
Median household income for houses/condos with a mortgage: $93,587
Median household income for apartments without a mortgage: $50,814
Median monthly housing costs: $1,026
Compare current foreclosures in Myrtle Beach, SC:
| Photo | Address | Area | Beds / Baths | Price | Details |
|---|---|---|---|---|---|

|
#1
Hitchcock Way Apt 836
Myrtle Beach, SC 29577
|
1,211 sq. feet
|
2 baths 3 beds |
show details | |

|
#2
Highway 814
Myrtle Beach, SC 29588
|
3,208 sq. feet
|
1 baths 3 beds |
show details | |

|
#3
River Oaks Dr Unit 3a
Myrtle Beach, SC 29579
|
606 sq. feet
|
1 baths 1 beds |
show details | |

|
#4
13th Ave S
Myrtle Beach, SC 29577
|
1,811 sq. feet
|
2 baths 3 beds |
show details | |

|
#5
Hunters Trl
Myrtle Beach, SC 29588
|
1,602 sq. feet
|
2 baths 3 beds |
show details | |

|
#6
Ambrosia Loop
Myrtle Beach, SC 29579
|
1,464 sq. feet
|
2 baths 3 beds |
show details | |

|
#7
Hunters Trl
Myrtle Beach, SC 29588
|
2,350 sq. feet
|
2 baths 3 beds |
show details | |

|
#8
Antler Ridge Cv
Myrtle Beach, SC 29588
|
1,554 sq. feet
|
2 baths 3 beds |
show details | |

|
#9
Eagle Terrace Ct
Myrtle Beach, SC 29579
|
1,066 sq. feet
|
2 baths 3 beds |
show details | |

|
#10
Seneca Ridge Dr
Myrtle Beach, SC 29579
|
2,812 sq. feet
|
2 baths 4 beds |
show details |
| Photo | Address | Area | Beds / Baths | Price | Details |
|---|---|---|---|---|---|

|
#11
Circle Ln
Myrtle Beach, SC 29588
|
2,170 sq. feet
|
1 baths 3 beds |
show details | |

|
#12
Blackwolf Dr
Myrtle Beach, SC 29579
|
1,582 sq. feet
|
2 baths 3 beds |
show details | |

|
#13
Lochview Dr
Myrtle Beach, SC 29588
|
1,746 sq. feet
|
2 baths 3 beds |
show details | |

|
#14
Gullane Ct
Myrtle Beach, SC 29575
|
1,877 sq. feet
|
2 baths 3 beds |
show details | |

|
#15
Brighton Ave
Myrtle Beach, SC 29588
|
2,042 sq. feet
|
2 baths 4 beds |
show details | |

|
#16
Panola Ln
Myrtle Beach, SC 29588
|
2,466 sq. feet
|
2 baths 4 beds |
show details | |

|
#17
Indianola Ct
Myrtle Beach, SC 29579
|
3,111 sq. feet
|
2 baths 4 beds |
show details | |

|
#18
Berkshire Dr
Myrtle Beach, SC 29588
|
1,332 sq. feet
|
2 baths 3 beds |
show details | |

|
#19
Churchill Downs Dr
Myrtle Beach, SC 29579
|
1,644 sq. feet
|
2 baths 3 beds |
show details | |

|
#20
Royal Pine Dr
Myrtle Beach, SC 29588
|
1,436 sq. feet
|
2 baths 3 beds |
show details |
| Photo | Address | Area | Beds / Baths | Price | Details |
|---|---|---|---|---|---|

|
#21
Farm Lake Dr
Myrtle Beach, SC 29579
|
1,355 sq. feet
|
2 baths 3 beds |
show details | |

|
#22
Kindred Dr
Myrtle Beach, SC 29588
|
2,302 sq. feet
|
2 baths 3 beds |
show details | |

|
#23
Brookgate Dr
Myrtle Beach, SC 29579
|
1,606 sq. feet
|
2 baths 3 beds |
show details | |

|
#24
Sea Turtle Dr
Myrtle Beach, SC 29588
|
1,747 sq. feet
|
2 baths 3 beds |
show details | |

|
#25
Seneca Ridge Dr
Myrtle Beach, SC 29579
|
2,056 sq. feet
|
2 baths 4 beds |
show details | |

|
#26
Fairwood Ter
Myrtle Beach, SC 29588
|
1,264 sq. feet
|
2 baths 3 beds |
show details | |

|
#27
Sandringham Ct
Myrtle Beach, SC 29588
|
1,924 sq. feet
|
2 baths 3 beds |
show details | |

|
#28
Ambrosia Loop
Myrtle Beach, SC 29579
|
1,452 sq. feet
|
2 baths 3 beds |
show details | |

|
#29
Barn Owl Ct
Myrtle Beach, SC 29579
|
1,582 sq. feet
|
3 baths 3 beds |
show details | |

|
#30
Hunting Bow Trl
Myrtle Beach, SC 29579
|
1,416 sq. feet
|
2 baths 3 beds |
show details |
| Photo | Address | Area | Beds / Baths | Price | Details |
|---|---|---|---|---|---|

|
#31
Viking Dr
Myrtle Beach, SC 29577
|
2,198 sq. feet
|
2 baths 3 beds |
show details | |

|
#32
Stonebrook Dr
Myrtle Beach, SC 29588
|
1,128 sq. feet
|
2 baths 3 beds |
show details | |

|
#33
Overcrest St
Myrtle Beach, SC 29579
|
1,856 sq. feet
|
2 baths 4 beds |
show details | |

|
#34
Southern Trl
Myrtle Beach, SC 29579
|
1,956 sq. feet
|
2 baths 3 beds |
show details | |

|
#35
Abingdon Dr
Myrtle Beach, SC 29579
|
2,414 sq. feet
|
2 baths 3 beds |
show details | |

|
#36
Isabel Ct
Myrtle Beach, SC 29579
|
1,478 sq. feet
|
2 baths 3 beds |
show details | |

|
#37
Whaler Harbour
Myrtle Beach, SC 29577
|
1,305 sq. feet
|
2 baths 3 beds |
show details | |

|
#38
Delta Cir
Myrtle Beach, SC 29577
|
1,662 sq. feet
|
2 baths 3 beds |
show details | |

|
#39
Olde Towne Way Unit 2
Myrtle Beach, SC 29588
|
1,520 sq. feet
|
3 baths 3 beds |
show details | |

|
#40
Coldwater Cir
Myrtle Beach, SC 29588
|
1,954 sq. feet
|
2 baths 3 beds |
show details |
| Photo | Address | Area | Beds / Baths | Price | Details |
|---|---|---|---|---|---|

|
#41
Weeping Willow Dr
Myrtle Beach, SC 29579
|
2,239 sq. feet
|
2 baths 3 beds |
show details | |

|
#42
Arundel Rd
Myrtle Beach, SC 29577
|
2,472 sq. feet
|
2 baths 3 beds |
show details | |

|
#43
Coteswood Dr
Myrtle Beach, SC 29572
|
1,620 sq. feet
|
1 baths 3 beds |
show details | |

|
#44
Corn Pile Rd
Myrtle Beach, SC 29588
|
1,482 sq. feet
|
2 baths 3 beds |
show details | |

|
#45
Bellegrove Dr
Myrtle Beach, SC 29579
|
1,410 sq. feet
|
2 baths 3 beds |
show details | |

|
#46
Waterway Village Blvd Apt 15a
Myrtle Beach, SC 29579
|
894 sq. feet
|
2 baths 2 beds |
show details | |

|
#47
Waterway Village Blvd Apt 18b
Myrtle Beach, SC 29579
|
894 sq. feet
|
2 baths 2 beds |
show details | |

|
#48
Stoney Falls Blvd
Myrtle Beach, SC 29579
|
1,319 sq. feet
|
2 baths 3 beds |
show details | |

|
#49
Callalily Ct
Myrtle Beach, SC 29579
|
1,852 sq. feet
|
2 baths 4 beds |
show details | |

|
Check over 1 million property listings on Foreclosure.com!
|
browse all offers | |||


 | Myrtle Beach Condos / Hoas / Special Assessments (6 replies) |
| Las Vegas to Surfside Beach/Myrtle Beach (4 replies) |
| Apartments in Myrtle Beach (2 replies) |
| Beach view apartments Myrtle Beach (16 replies) |
| As a homeowner in Myrtle Beach (area) what do you wish you did differently? (11 replies) |
| The Myrtle Beach Resort Condos for sale (2 replies) |
Median year apartment built: 1990
Household type by relationship:
Households: 38,746- Male householders: 8,202 (2,703 living alone), Female householders: 9,203 (3,771 living alone)
7,276 spouses (7,209 opposite-sex spouses), 969 unmarried partners, (926 opposite-sex unmarried partners), 8,705 children (8,034 natural, 511 adopted, 160 stepchildren), 367 grandchildren, 682 brothers or sisters, 330 parents, 15 foster children, 661 other relatives, 2,157 non-relatives
- In group quarters: 174
Size of family households: 6,644 2-persons, 2,697 3-persons, 745 4-persons, 471 5-persons, 69 6-persons, 42 7-or-more-persons.
Size of nonfamily households: 6,519 1-person, 1,038 2-persons, 126 3-persons, 95 4-persons, 13 5-persons.
3,243 married couples with children.
2,318 single-parent households (192 men, 2,126 women).
86.4% of residents of Myrtle Beach speak English at home.
9.0% of residents speak Spanish at home (70% speak English very well, 13% speak English well, 16% speak English not well, 1% don't speak English at all).
3.3% of residents speak other Indo-European language at home (79% speak English very well, 16% speak English well, 5% speak English not well).
0.8% of residents speak Asian or Pacific Island language at home (67% speak English very well, 3% speak English well, 26% speak English not well, 4% don't speak English at all).
0.6% of residents speak other language at home (78% speak English very well, 22% speak English well).
Foreign born population: 4,597 (11.9%)
(33.4% of them are naturalized citizens)
| Here: | 5.9 |
| State: | 6.4 |
| Here: | 4.0 |
| State: | 4.5 |
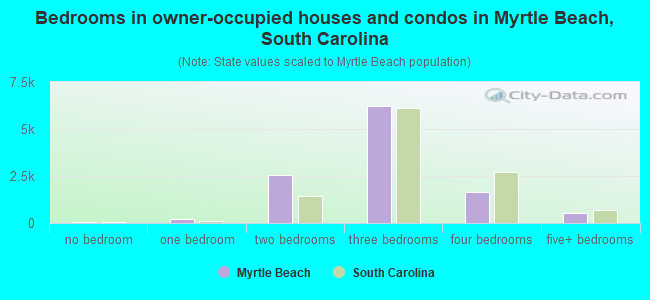
- Bedrooms in owner-occupied houses and condos in Myrtle Beach, South Carolina
- 77no bedroom
- 2001 bedroom
- 2,5552 bedrooms
- 6,2123 bedrooms
- 1,6254 bedrooms
- 5085+ bedrooms
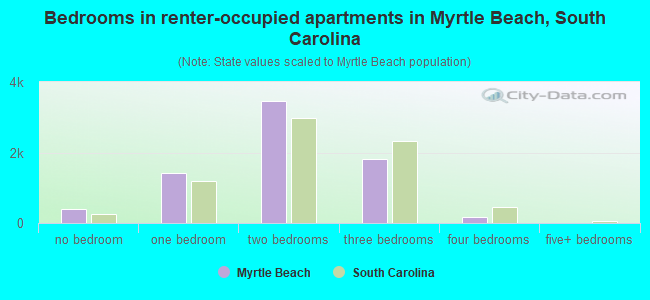
- Bedrooms in renter-occupied apartments in Myrtle Beach, South Carolina
- 387no bedroom
- 1,4231 bedroom
- 3,4742 bedrooms
- 1,8063 bedrooms
- 1744 bedrooms
- 65+ bedrooms
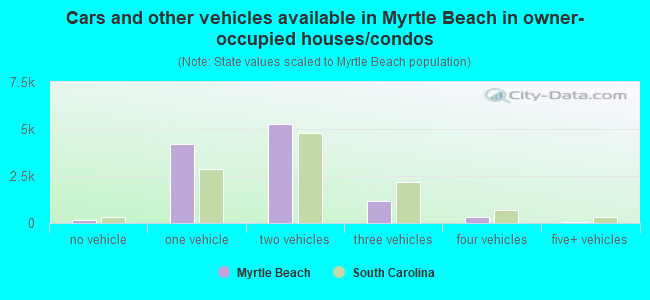
- Cars and other vehicles available in Myrtle Beach in owner-occupied houses/condos
- 181no vehicle
- 4,2101 vehicle
- 5,2652 vehicles
- 1,1483 vehicles
- 3014 vehicles
- 735+ vehicles
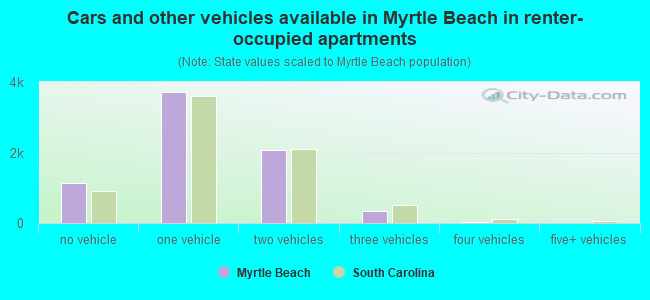
- Cars and other vehicles available in Myrtle Beach in renter-occupied apartments
- 1,135no vehicle
- 3,7071 vehicle
- 2,0742 vehicles
- 3313 vehicles
- 184 vehicles
- 65+ vehicles
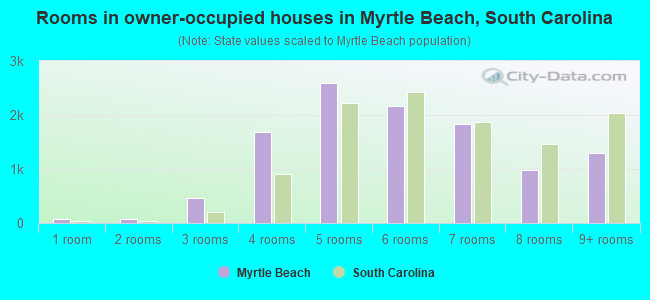
- Rooms in owner-occupied houses in Myrtle Beach, South Carolina
- 771 room
- 712 rooms
- 4663 rooms
- 1,6824 rooms
- 2,5965 rooms
- 2,1686 rooms
- 1,8377 rooms
- 9888 rooms
- 1,2929+ rooms
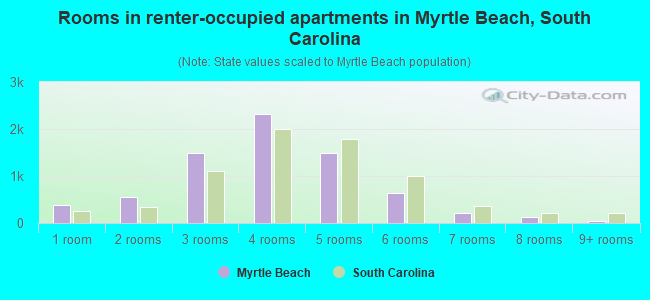
- Rooms in renter-occupied apartments in Myrtle Beach, South Carolina
- 3801 room
- 5592 rooms
- 1,4833 rooms
- 2,3284 rooms
- 1,4885 rooms
- 6486 rooms
- 2237 rooms
- 1248 rooms
- 389+ rooms
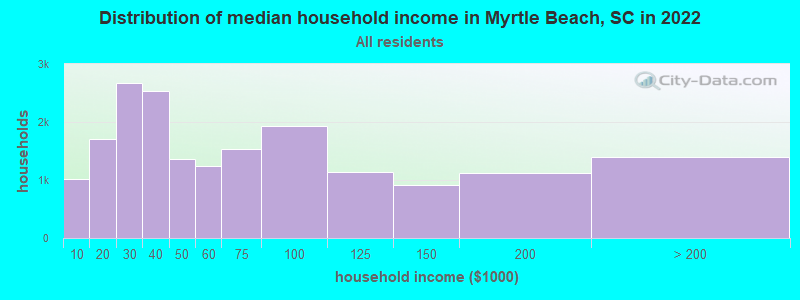
Myrtle Beach, SC household income distribution

- 1,013Less than $10,000
- 1,711$10,000 to $19,999
- 2,678$20,000 to $29,999
- 2,539$30,000 to $39,999
- 1,368$40,000 to $49,999
- 1,236$50,000 to $59,999
- 1,536$60,000 to $74,999
- 1,927$75,000 to $99,999
- 1,136$100,000 to $124,999
- 907$125,000 to $149,999
- 1,121$150,000 to $199,999
- 1,391$200,000 or more
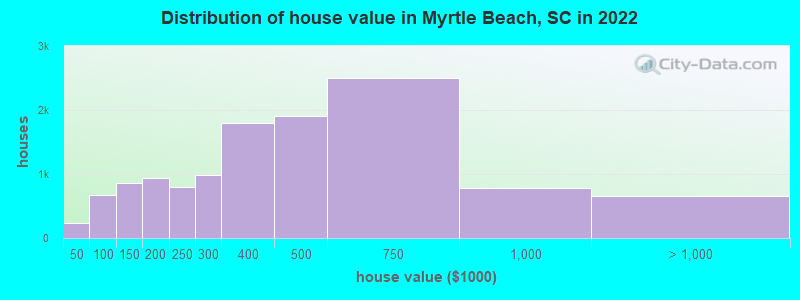
Home value of owner - occupied houses in 2022 in Myrtle Beach, SC
-
- 40Less than $10,000
- 16$10,000 to $14,999
- 30$15,000 to $19,999
- 31$20,000 to $24,999
- 55$25,000 to $29,999
- 12$35,000 to $39,999
- 41$40,000 to $49,999
- 162$50,000 to $59,999
- 99$60,000 to $69,999
- 133$70,000 to $79,999
- 77$80,000 to $89,999
- 153$90,000 to $99,999
- 633$100,000 to $124,999
- 232$125,000 to $149,999
- 519$150,000 to $174,999
- 425$175,000 to $199,999
- 793$200,000 to $249,999
- 984$250,000 to $299,999
- 1,798$300,000 to $399,999
- 1,906$400,000 to $499,999
- 2,502$500,000 to $749,999
- 786$750,000 to $999,999
- 317$1,000,000 to $1,499,999
- 100$1,500,000 to $1,999,999
- 237$2,000,000 or more
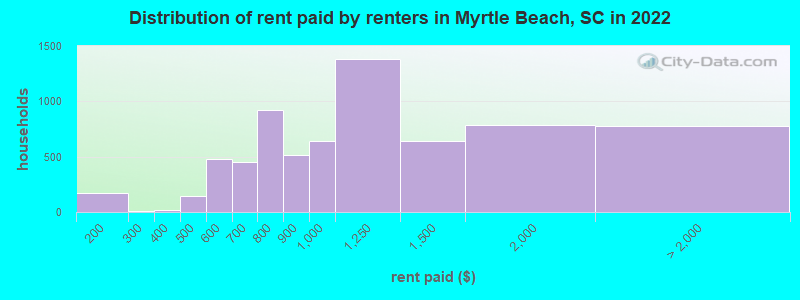
Rent paid by renters in 2022 in Myrtle Beach, SC
-
- 9Less than $100
- 127$100 to $149
- 48$150 to $199
- 12$200 to $249
- 13$300 to $349
- 4$350 to $399
- 92$400 to $449
- 55$450 to $499
- 194$500 to $549
- 282$550 to $599
- 221$600 to $649
- 233$650 to $699
- 722$700 to $749
- 195$750 to $799
- 515$800 to $899
- 645$900 to $999
- 1,384$1,000 to $1,249
- 643$1,250 to $1,499
- 783$1,500 to $1,999
- 257$2,000 to $2,499
- 40$2,500 to $2,999
- 14$3,000 to $3,499
- 237$3,500 or more
- 230No cash rent
Percentage of workers working in this county: 92.6%
Number of people working at home: 2,679 (13.6% of all workers)
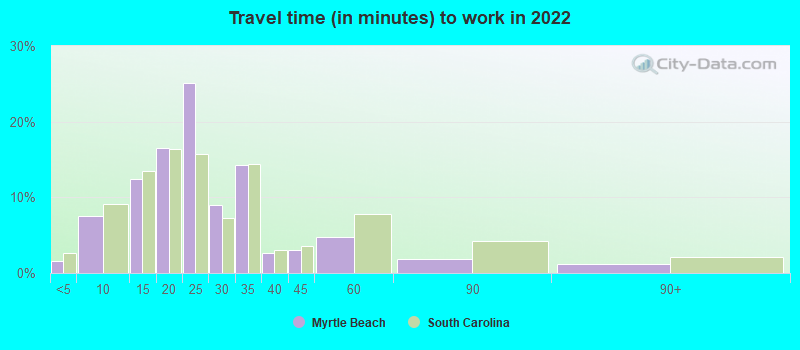
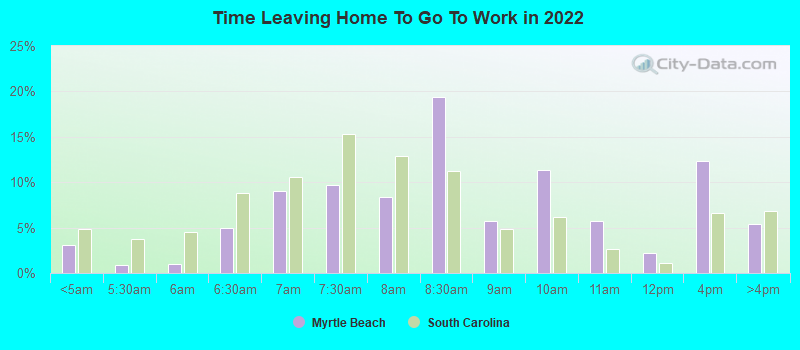
Travel time to work (commute)
- Less than 5 minutes: 565
- 5 to 9 minutes: 2,612
- 10 to 14 minutes: 3,380
- 15 to 19 minutes: 2,628
- 20 to 24 minutes: 3,434
- 25 to 29 minutes: 1,131
- 30 to 34 minutes: 1,513
- 35 to 39 minutes: 148
- 40 to 44 minutes: 213
- 45 to 59 minutes: 410
- 60 to 89 minutes: 199
- 90 or more minutes: 370
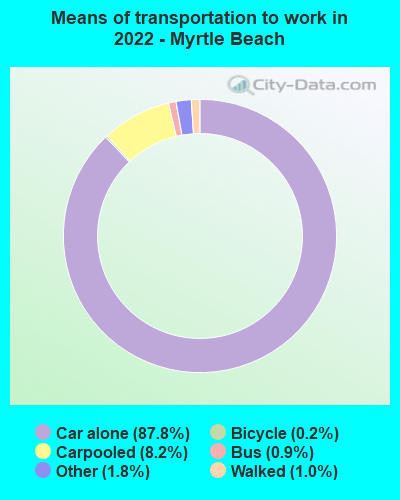
Means of transportation to work:
- Drove a car alone: 42,362 (78.6%)
- Carpooled: 4,845 (9.0%)
- Bus: 285 (0.5%)
- Subway or elevated rail: 20 (0.0%)
- Ferryboat: 31 (0.1%)
- Taxi: 1,506 (2.8%)
- Bicycle: 88 (0.2%)
- Walked: 503 (0.9%)
- Worked at home: 2,679 (5.0%)
- Unemployment by race in 2022
- Unemployment rate for White non-Hispanic residents
- 3.3%Males
- 1.3%Females
- Unemployment rate for Black residents
- 3.7%Males
- 3.9%Females
- Unemployment rate for two or more race residents
- 0.7%Males
- 7.1%Females
- Unemployment rate for Hispanic or Latino residents
- 0.6%Males
- 9.9%Females
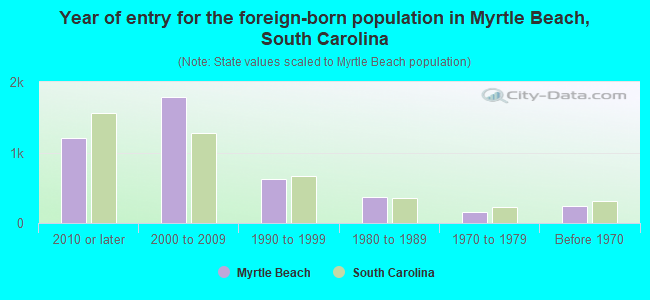
- Year of entry for the foreign-born population in Myrtle Beach, South Carolina
- 1,2052010 or later
- 1,7822000 to 2009
- 6181990 to 1999
- 3751980 to 1989
- 1571970 to 1979
- 246Before 1970
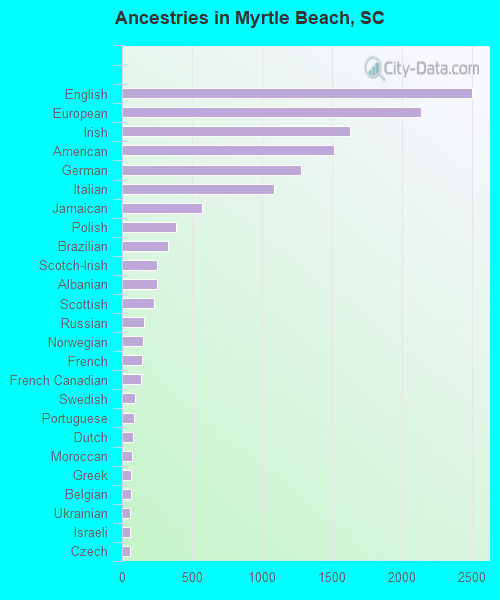
First ancestries reported:
- English: 2,500 (11.5%)
- European: 2,142 (9.8%)
- Irish: 1,630 (7.5%)
- American: 1,516 (7.0%)
- German: 1,279 (5.9%)
- Italian: 1,085 (5.0%)
- Jamaican: 570 (2.6%)
- Polish: 385 (1.8%)
- Brazilian: 328 (1.5%)
- Scotch-Irish: 251 (1.2%)
- Albanian: 247 (1.1%)
- Scottish: 226 (1.0%)
- Russian: 157 (0.7%)
- Norwegian: 150 (0.7%)
- French: 145 (0.7%)
- French Canadian: 137 (0.6%)
- Swedish: 93 (0.4%)
- Portuguese: 84 (0.4%)
- Dutch: 77 (0.4%)
- Moroccan: 70 (0.3%)
- Greek: 65 (0.3%)
- Belgian: 62 (0.3%)
- Ukrainian: 58 (0.3%)
- Israeli: 55 (0.3%)
- Czech: 54 (0.2%)
- Eastern European: 47 (0.2%)
- British: 47 (0.2%)
- Slavic: 45 (0.2%)
- Scandinavian: 43 (0.2%)
- Canadian: 42 (0.2%)
- Armenian: 39 (0.2%)
- Bahamian: 30 (0.1%)
- Hungarian: 28 (0.1%)
- Afghan: 28 (0.1%)
- Welsh: 22 (0.1%)
- Danish: 21 (0.10%)
- African: 21 (0.10%)
- Northern European: 18 (0.08%)
- Pennsylvania German: 12 (0.06%)
- Austrian: 10 (0.05%)
- Czechoslovakian: 9 (0.04%)
- Egyptian: 2 (0.01%)
Most common places of birth for foreign-born residents (%):
| Myrtle Beach: | 32.9% (1,337) |
| South Carolina: | 22.5% (60,774) |
| Myrtle Beach: | 13.1% (532) |
| South Carolina: | 2.6% (7,073) |
| Myrtle Beach: | 7.6% (310) |
| South Carolina: | 3.4% (9,058) |
| Myrtle Beach: | 4.8% (195) |
| South Carolina: | 0.2% (495) |
| Myrtle Beach: | 4.3% (173) |
| South Carolina: | 2.0% (5,344) |
| Myrtle Beach: | 3.9% (160) |
| South Carolina: | 3.7% (9,982) |
| Myrtle Beach: | 3.3% (135) |
| South Carolina: | 3.0% (8,193) |
| Myrtle Beach: | 3.1% (127) |
| South Carolina: | 0.3% (687) |
| Myrtle Beach: | 2.8% (114) |
| South Carolina: | 0.1% (322) |
| Myrtle Beach: | 1.8% (72) |
| South Carolina: | 1.2% (3,296) |
| Myrtle Beach: | 1.6% (67) |
| South Carolina: | 0.5% (1,444) |
| Myrtle Beach: | 1.6% (66) |
| South Carolina: | 0.6% (1,691) |
| Myrtle Beach: | 1.5% (63) |
| South Carolina: | 0.9% (2,502) |
Place of birth for U.S.-born residents:
- This state: 11,251
- Other state: 22,507
- Northeast: 8,667
- Midwest: 3,425
- South: 9,418
- West: 891
84.0% of Myrtle Beach residents lived in the same house 1 years ago.
Out of people who lived in different houses, 27.7% lived in this county.
Out of people who lived in different counties, 12.6% lived in South Carolina.
| Myrtle Beach: | 84.0% |
| State average: | 86.5% |
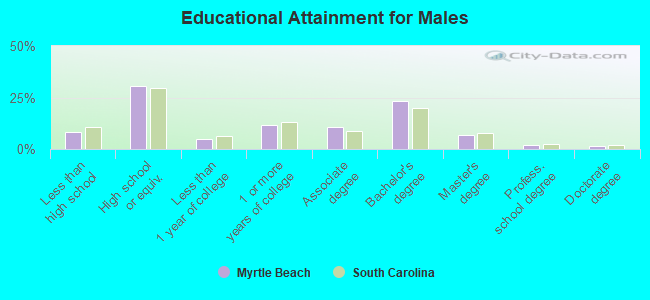
Education attainment for males 25 years and older:
- No schooling: 267
- Nursery to 4th grade: 0
- 5th and 6th grade: 62
- 7th and 8th grade: 108
- 9th grade: 171
- 10th grade: 156
- 11th grade: 185
- 12th grade, no diploma: 278
- High school graduate (or equivalency): 4,466
- Less than 1 year of college: 691
- Some college more than 1 year, no degree: 1,706
- Associate degree: 1,522
- Bachelor's degree: 3,388
- Master's degree: 984
- Professional school degree: 264
- Doctorate degree: 245
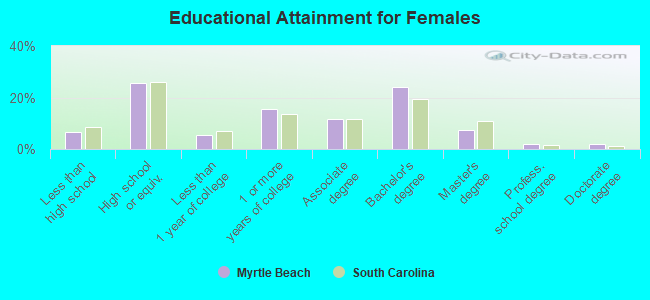
Education attainment for females 25 years and older:
- No schooling: 94
- Nursery to 4th grade: 10
- 5th and 6th grade: 28
- 7th and 8th grade: 109
- 9th grade: 182
- 10th grade: 248
- 11th grade: 163
- 12th grade, no diploma: 218
- High school graduate (or equivalency): 4,014
- Less than 1 year of college: 867
- Some college more than 1 year, no degree: 2,413
- Associate degree: 1,819
- Bachelor's degree: 3,761
- Master's degree: 1,167
- Professional school degree: 283
- Doctorate degree: 302
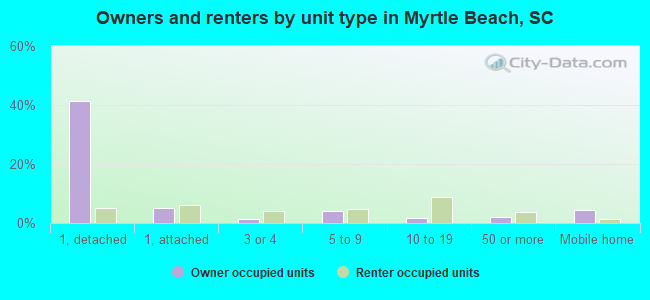
Housing units in structures:
- One, detached: 9,626
- One, attached: 2,023
- Two: 449
- 3 or 4: 1,464
- 5 to 9: 2,446
- 10 to 19: 2,165
- 20 to 49: 1,834
- 50 or more: 4,102
- Mobile homes: 1,307
Median worth of mobile homes: $132,690
Housing units lacking complete kitchen facilities in 2022: 1.8%
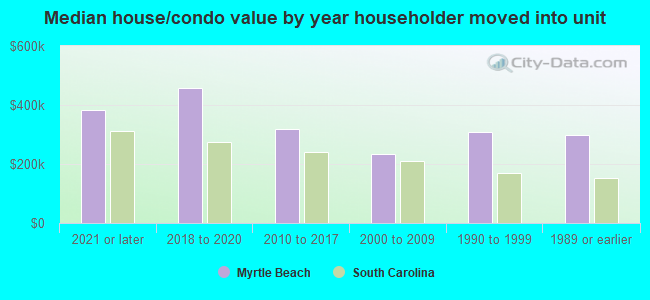
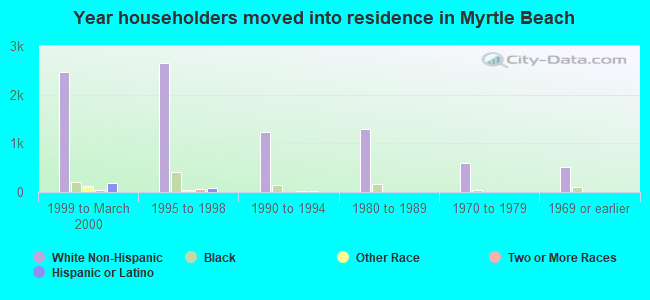
House/condo owner moved in on average 4 years ago
Renter moved in on average 2 years ago
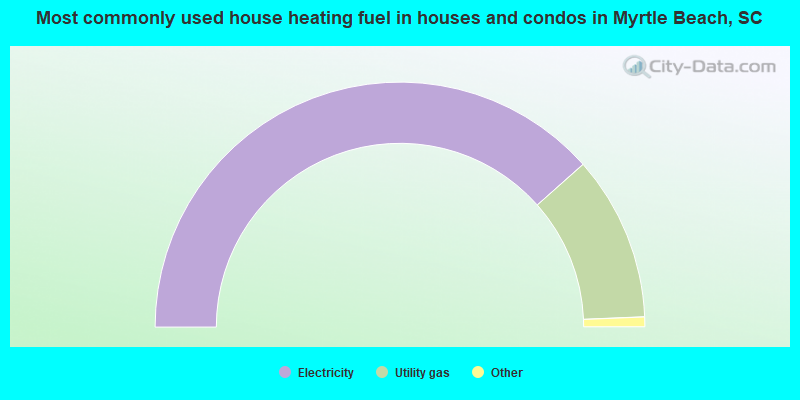
- 76.9%Electricity
- 21.8%Utility gas
- 0.7%Bottled, tank, or LP gas
- 0.4%No fuel used
- 0.1%Other fuel
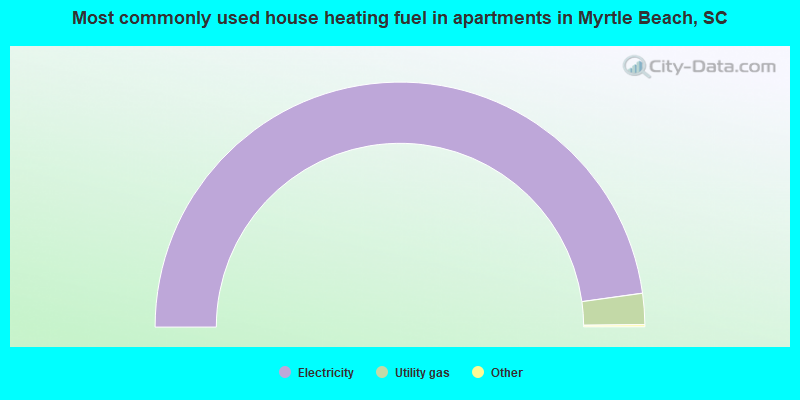
- 95.6%Electricity
- 4.1%Utility gas
- 0.1%No fuel used
- 0.1%Bottled, tank, or LP gas
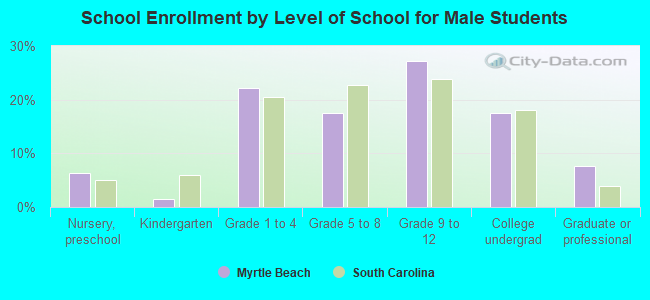
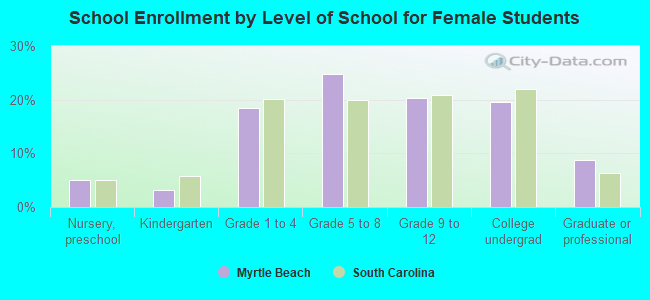
Private vs. public school enrollment:
| Here: | 9.9% |
| South Carolina: | 14.4% |
| Here: | 10.9% |
| South Carolina: | 11.1% |
| Here: | 9.0% |
| South Carolina: | 21.9% |