New Albany, MS (Mississippi) Houses and Residents
| New Albany: | $149,801 |
| Mississippi: | $162,500 |
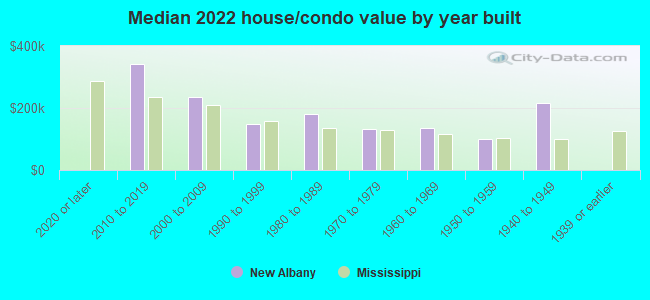
Mean price in 2022:
Detached houses: $189,212
Here: $189,212 State: $226,494 Mobile homes: $111,737
Here: $111,737 State: $73,695
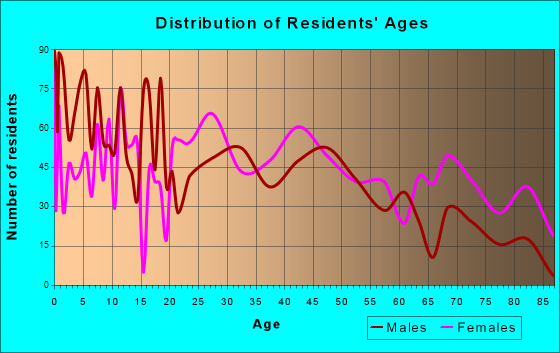
Total population: 8,708 (Urban population: 5,879 (all inside urban clusters), Rural population: 1,631 (26 farm, 1,605 nonfarm))
Houses: 3,493 (3,038 occupied: 1,659 owner occupied, 1,411 renter occupied)
| % of renters here: | 46% |
| State: | 30% |
Housing density: 205 houses/condos per square mile
Median price asked for vacant for-sale houses and condos in 2022 in this county: $92,547.
Median contract rent in 2022: $659 (lower quartile is $541, upper quartile is $847)
Median rent asked for vacant for-rent units in 2022: $651
Median gross rent in New Albany, MS in 2022: $863
Housing units in New Albany with a mortgage: 710 (27 second mortgage, 0 home equity loan, 17 both second mortgage and home equity loan)
Houses without a mortgage: 100
Median household income for houses/condos with a mortgage: $82,598
Median household income for apartments without a mortgage: $44,743
Median monthly housing costs: $803
Compare current foreclosures in New Albany, MS:
| Photo | Address | Area | Beds / Baths | Price | Details |
|---|---|---|---|---|---|

|
#1
County Road 238
New Albany, MS 38652
|
1,012 sq. feet
|
- baths - beds |
$4,900
|
show details |

|
#2
County Road 64 S
New Albany, MS 38652
|
1,056 sq. feet
|
1 baths 3 beds |
show details | |

|
#3
Cherry Tree Ln
New Albany, MS 38652
|
1,674 sq. feet
|
1 baths 3 beds |
show details | |

|
#4
County Road 339
New Albany, MS 38652
|
1,433 sq. feet
|
2 baths 4 beds |
show details | |

|
#5
Monticello St
New Albany, MS 38652
|
1,892 sq. feet
|
2 baths 3 beds |
show details | |

|
#6
Oak St
New Albany, MS 38652
|
1,647 sq. feet
|
1 baths - beds |
show details | |

|
#7
Woodland Dr
New Albany, MS 38652
|
1,552 sq. feet
|
1 baths - beds |
show details | |

|
#8
County Road 64 S
New Albany, MS 38652
|
1,161 sq. feet
|
1 baths - beds |
show details | |

|
#9
County Road 140
New Albany, MS 38652
|
2,172 sq. feet
|
1 baths - beds |
show details | |

|
#10
Cherry Blvd
New Albany, MS 38652
|
1,675 sq. feet
|
1 baths - beds |
show details |
| Photo | Address | Area | Beds / Baths | Price | Details |
|---|---|---|---|---|---|

|
#11
Rolling Hills Dr
New Albany, MS 38652
|
1,220 sq. feet
|
1 baths - beds |
show details | |

|
#12
County Road 152
New Albany, MS 38652
|
1,380 sq. feet
|
1 baths - beds |
show details | |

|
#13
County Road 64 S
New Albany, MS 38652
|
962 sq. feet
|
- baths 3 beds |
show details | |

|
#14
Meadow Ln
New Albany, MS 38652
|
1,559 sq. feet
|
1 baths - beds |
show details | |

|
#15
James St
New Albany, MS 38652
|
910 sq. feet
|
1 baths - beds |
show details | |

|
#16
County Road 90
New Albany, MS 38652
|
1,187 sq. feet
|
- baths - beds |
show details | |

|
#17
County Road 81
New Albany, MS 38652
|
2,546 sq. feet
|
1 baths - beds |
show details | |

|
#18
Byrne St
New Albany, MS 38652
|
1,566 sq. feet
|
1 baths - beds |
show details | |

|
#19
State Highway 178 W, Lot 127
New Albany, MS 38652
|
- sq. feet
|
- baths - beds |
show details | |

|
#20
Honeysuckle Dr
New Albany, MS 38652
|
- sq. feet
|
- baths - beds |
show details |
| Photo | Address | Area | Beds / Baths | Price | Details |
|---|---|---|---|---|---|

|
#21
County Road 121
New Albany, MS 38652
|
- sq. feet
|
- baths - beds |
show details | |

|
#22
State Highway 178 E
New Albany, MS 38652
|
- sq. feet
|
- baths - beds |
show details | |

|
#23
State Highway 30 E
New Albany, MS 38652
|
- sq. feet
|
- baths - beds |
show details | |

|
#24
Wilkins Loop, # A
New Albany, MS 38652
|
- sq. feet
|
- baths - beds |
show details | |

|
#25
County Road 62
New Albany, MS 38652
|
- sq. feet
|
- baths - beds |
show details | |

|
#26
State Highway 348, Lot 2
New Albany, MS 38652
|
- sq. feet
|
- baths - beds |
show details | |

|
#27
Reed St
New Albany, MS 38652
|
- sq. feet
|
- baths - beds |
show details | |

|
#28
County Road 150
New Albany, MS 38652
|
- sq. feet
|
- baths - beds |
show details | |

|
#29
Brookwood St
New Albany, MS 38652
|
978 sq. feet
|
- baths - beds |
show details | |

|
#30
County Road 100
New Albany, MS 38652
|
- sq. feet
|
- baths - beds |
show details |
| Photo | Address | Area | Beds / Baths | Price | Details |
|---|---|---|---|---|---|

|
#31
Glade St
New Albany, MS 38652
|
- sq. feet
|
- baths - beds |
show details | |

|
#32
Mill St
New Albany, MS 38652
|
1,092 sq. feet
|
- baths - beds |
show details | |

|
#33
County Road 145
New Albany, MS 38652
|
- sq. feet
|
- baths - beds |
show details | |

|
#34
County Road 50
New Albany, MS 38652
|
- sq. feet
|
- baths - beds |
show details | |

|
#35
Shady Grove Rd
New Albany, MS 38652
|
1,092 sq. feet
|
- baths - beds |
show details | |

|
#36
S Camp Ave
New Albany, MS 38652
|
- sq. feet
|
- baths - beds |
show details | |

|
#37
Kings Creek Rd Apt 12
New Albany, MS 38652
|
- sq. feet
|
- baths - beds |
show details | |

|
#38
State Highway 30 W
New Albany, MS 38652
|
1,336 sq. feet
|
- baths - beds |
show details | |

|
#39
State Highway 30 W
New Albany, MS 38652
|
- sq. feet
|
- baths - beds |
show details | |

|
#40
Farris Circle
New Albany, MS 38652
|
- sq. feet
|
- baths - beds |
show details |
| Photo | Address | Area | Beds / Baths | Price | Details |
|---|---|---|---|---|---|

|
#41
Bratton Rd Apt 307
New Albany, MS 38652
|
- sq. feet
|
- baths - beds |
show details | |

|
#42
Standish St
New Albany, MS 38652
|
- sq. feet
|
- baths - beds |
show details | |

|
#43
County Road 47
New Albany, MS 38652
|
- sq. feet
|
- baths - beds |
show details | |

|
#44
County Road 278
New Albany, MS 38652
|
1,164 sq. feet
|
- baths - beds |
show details | |

|
#45
State Highway 30 E
New Albany, MS 38652
|
- sq. feet
|
- baths - beds |
show details | |

|
#46
County Road 107 Lot 4
New Albany, MS 38652
|
- sq. feet
|
- baths - beds |
show details | |

|
#47
Brittany Dr
New Albany, MS 38652
|
- sq. feet
|
- baths - beds |
show details | |

|
#48
State Highway 30 W
New Albany, MS 38652
|
- sq. feet
|
- baths - beds |
show details | |

|
#49
County Road 127
New Albany, MS 38652
|
- sq. feet
|
- baths - beds |
show details | |

|
Check over 1 million property listings on Foreclosure.com!
|
browse all offers | |||


 | Upscale but not snobby, impressive downtown, very safe, no college (30 replies) |
| Bucolic Mississippi (22 replies) |
| Apartments in Tupelo, MS (and surrounding areas) (1 reply) |
| America's best coastal towns are in Mississippi (8 replies) |
| Google picks Southaven (22 replies) |
| Ole Miss or Miss State? (24 replies) |
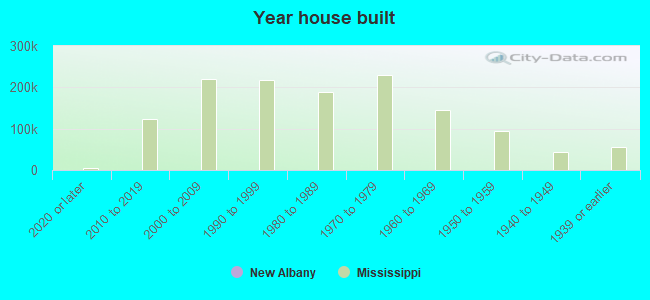
Median year apartment built: 1976
Household type by relationship:
Households: 7,608- Male householders: 1,461 (389 living alone), Female householders: 1,517 (529 living alone)
1,152 spouses (1,152 opposite-sex spouses), 135 unmarried partners, (127 opposite-sex unmarried partners), 2,386 children (2,182 natural, 54 adopted, 150 stepchildren), 344 grandchildren, 48 brothers or sisters, 26 parents, 0 foster children, 48 other relatives, 171 non-relatives
- In group quarters: 313
Size of family households: 787 2-persons, 494 3-persons, 496 4-persons, 152 5-persons, 8 7-or-more-persons.
Size of nonfamily households: 963 1-person, 159 2-persons.
822 married couples with children.
827 single-parent households (145 men, 682 women).
91.9% of residents of New Albany speak English at home.
7.5% of residents speak Spanish at home (46% speak English very well, 35% speak English well, 5% speak English not well, 13% don't speak English at all).
Foreign born population: 468 (6.2%)
(10.0% of them are naturalized citizens)
| Here: | 6.4 |
| State: | 6.3 |
| Here: | 4.8 |
| State: | 4.8 |
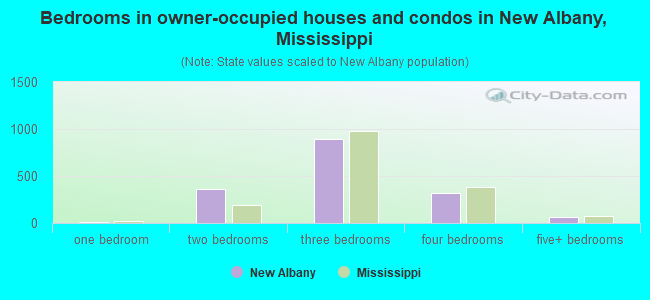
- Bedrooms in owner-occupied houses and condos in New Albany, Mississippi
- 0no bedroom
- 121 bedroom
- 3672 bedrooms
- 8923 bedrooms
- 3244 bedrooms
- 655+ bedrooms
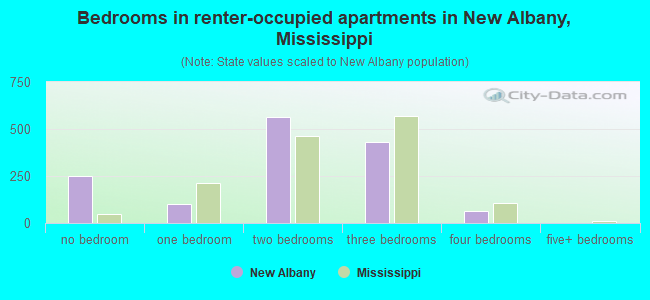
- Bedrooms in renter-occupied apartments in New Albany, Mississippi
- 251no bedroom
- 1001 bedroom
- 5642 bedrooms
- 4313 bedrooms
- 654 bedrooms
- 05+ bedrooms
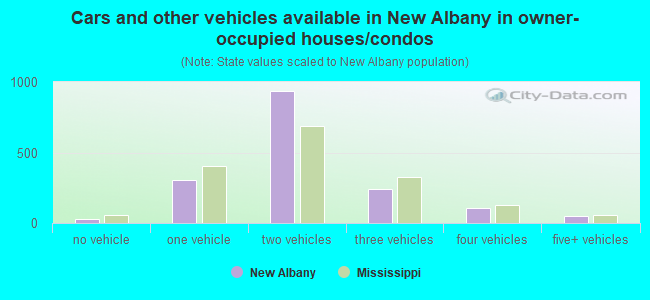
- Cars and other vehicles available in New Albany in owner-occupied houses/condos
- 30no vehicle
- 3031 vehicle
- 9352 vehicles
- 2383 vehicles
- 1054 vehicles
- 485+ vehicles
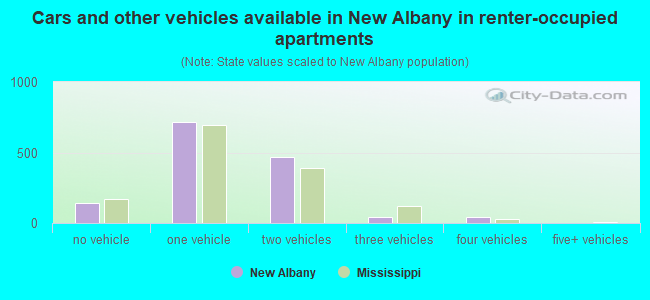
- Cars and other vehicles available in New Albany in renter-occupied apartments
- 145no vehicle
- 7171 vehicle
- 4662 vehicles
- 433 vehicles
- 404 vehicles
- 05+ vehicles
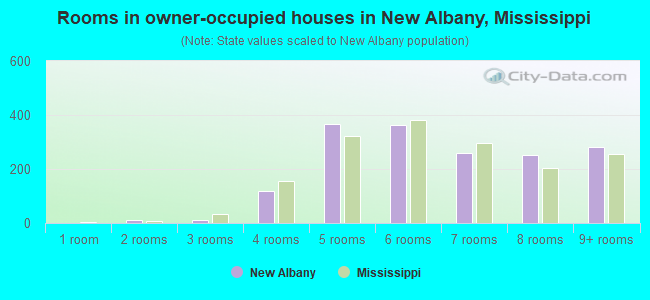
- Rooms in owner-occupied houses in New Albany, Mississippi
- 01 room
- 122 rooms
- 113 rooms
- 1204 rooms
- 3655 rooms
- 3626 rooms
- 2597 rooms
- 2518 rooms
- 2809+ rooms
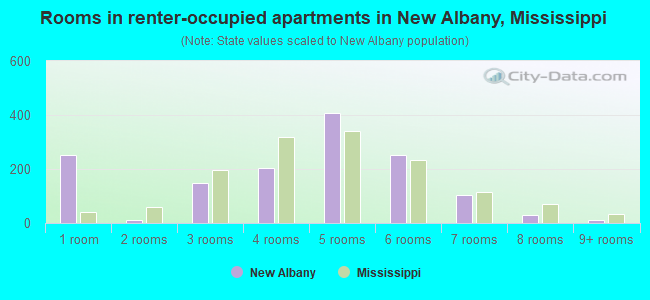
- Rooms in renter-occupied apartments in New Albany, Mississippi
- 2511 room
- 102 rooms
- 1473 rooms
- 2044 rooms
- 4065 rooms
- 2516 rooms
- 1027 rooms
- 308 rooms
- 109+ rooms
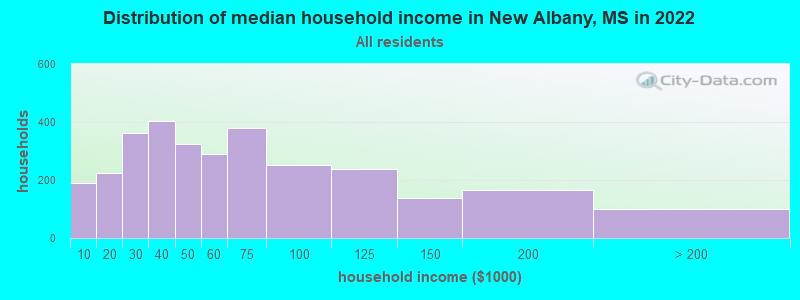
New Albany, MS household income distribution

- 191Less than $10,000
- 223$10,000 to $19,999
- 361$20,000 to $29,999
- 404$30,000 to $39,999
- 323$40,000 to $49,999
- 290$50,000 to $59,999
- 380$60,000 to $74,999
- 253$75,000 to $99,999
- 238$100,000 to $124,999
- 138$125,000 to $149,999
- 166$150,000 to $199,999
- 100$200,000 or more
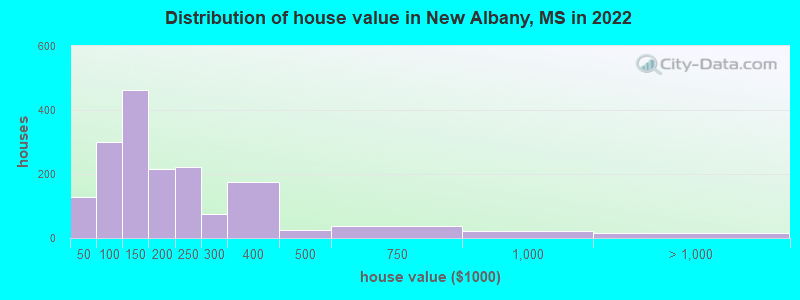
Home value of owner - occupied houses in 2022 in New Albany, MS
-
- 11Less than $10,000
- 10$15,000 to $19,999
- 44$30,000 to $34,999
- 15$35,000 to $39,999
- 46$40,000 to $49,999
- 96$50,000 to $59,999
- 4$60,000 to $69,999
- 63$70,000 to $79,999
- 61$80,000 to $89,999
- 28$90,000 to $99,999
- 279$100,000 to $124,999
- 181$125,000 to $149,999
- 135$150,000 to $174,999
- 81$175,000 to $199,999
- 222$200,000 to $249,999
- 76$250,000 to $299,999
- 174$300,000 to $399,999
- 23$400,000 to $499,999
- 36$500,000 to $749,999
- 21$750,000 to $999,999
- 15$1,000,000 to $1,499,999
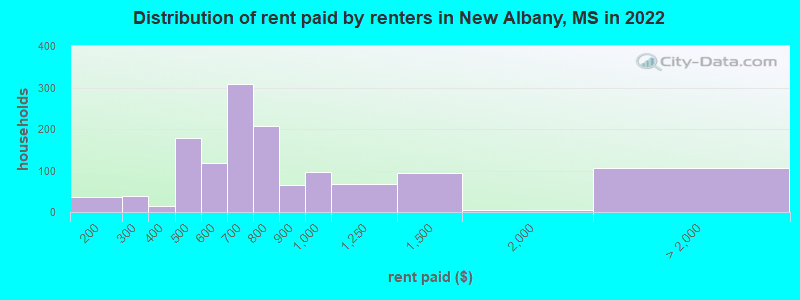
Rent paid by renters in 2022 in New Albany, MS
-
- 35$150 to $199
- 38$250 to $299
- 15$350 to $399
- 104$400 to $449
- 73$450 to $499
- 39$500 to $549
- 79$550 to $599
- 162$600 to $649
- 145$650 to $699
- 120$700 to $749
- 86$750 to $799
- 63$800 to $899
- 96$900 to $999
- 66$1,000 to $1,249
- 92$1,250 to $1,499
- 5$1,500 to $1,999
- 104No cash rent
Percentage of workers working in this county: 64.5%
Number of people working at home: 52 (1.6% of all workers)
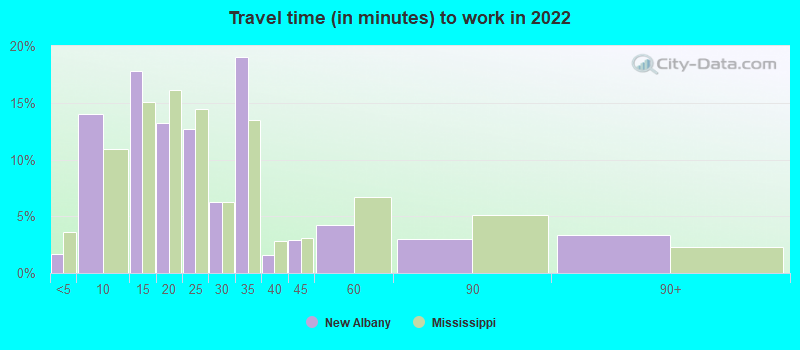
Travel time to work (commute)
- Less than 5 minutes: 158
- 5 to 9 minutes: 770
- 10 to 14 minutes: 738
- 15 to 19 minutes: 152
- 20 to 24 minutes: 527
- 25 to 29 minutes: 129
- 30 to 34 minutes: 329
- 35 to 39 minutes: 14
- 40 to 44 minutes: 32
- 45 to 59 minutes: 242
- 60 to 89 minutes: 74
- 90 or more minutes: 10
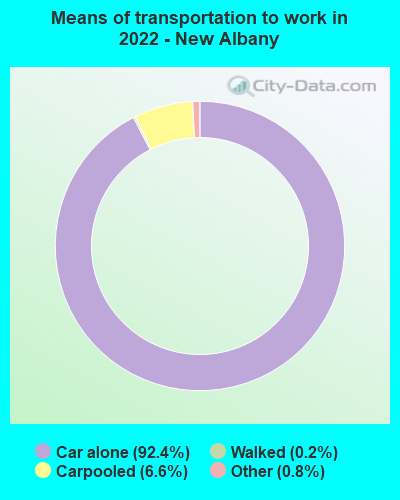
Means of transportation to work:
- Drove a car alone: 5,814 (89.7%)
- Carpooled: 462 (7.1%)
- Taxi: 40 (0.6%)
- Walked: 17 (0.3%)
- Worked at home: 52 (0.8%)
- Unemployment by race in 2022
- Unemployment rate for White non-Hispanic residents
- 1.1%Males
- Unemployment rate for Black residents
- 3.7%Males
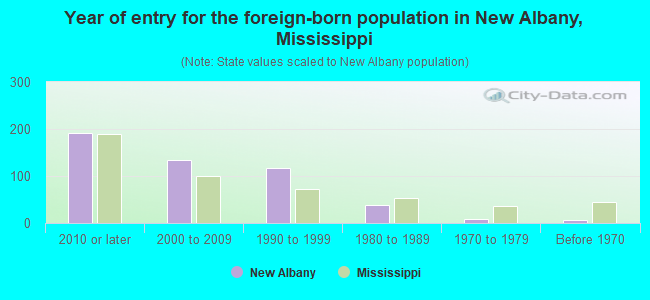
- Year of entry for the foreign-born population in New Albany, Mississippi
- 1912010 or later
- 1352000 to 2009
- 1161990 to 1999
- 391980 to 1989
- 91970 to 1979
- 6Before 1970
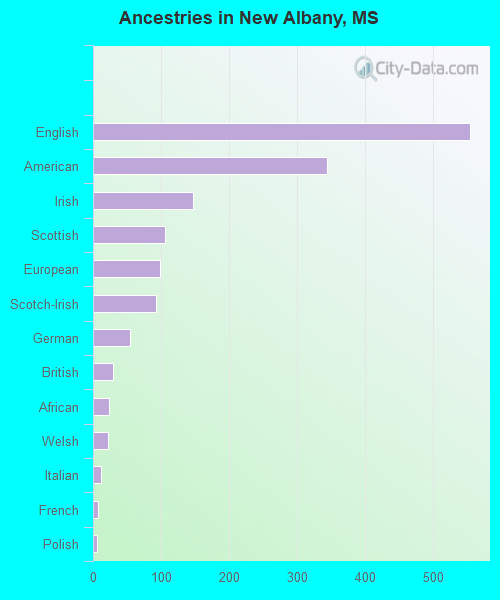
First ancestries reported:
- English: 554 (15.5%)
- American: 344 (9.6%)
- Irish: 147 (4.1%)
- Scottish: 106 (3.0%)
- European: 99 (2.8%)
- Scotch-Irish: 92 (2.6%)
- German: 54 (1.5%)
- British: 29 (0.8%)
- African: 24 (0.7%)
- Welsh: 22 (0.6%)
- Italian: 12 (0.3%)
- French: 8 (0.2%)
- Polish: 6 (0.2%)
Most common places of birth for foreign-born residents (%):
| New Albany: | 76.3% (380) |
| Mississippi: | 25.4% (17,354) |
| New Albany: | 9.0% (45) |
| Mississippi: | 2.0% (1,390) |
| New Albany: | 7.8% (39) |
| Mississippi: | 5.1% (3,475) |
| New Albany: | 4.4% (22) |
| Mississippi: | 4.7% (3,211) |
Place of birth for U.S.-born residents:
- This state: 5,777
- Other state: 1,270
- Northeast: 110
- Midwest: 354
- South: 567
- West: 252
85.0% of New Albany residents lived in the same house 1 years ago.
Out of people who lived in different houses, 36.1% lived in this county.
Out of people who lived in different counties, 89.1% lived in Mississippi.
| New Albany: | 85.0% |
| State average: | 88.9% |
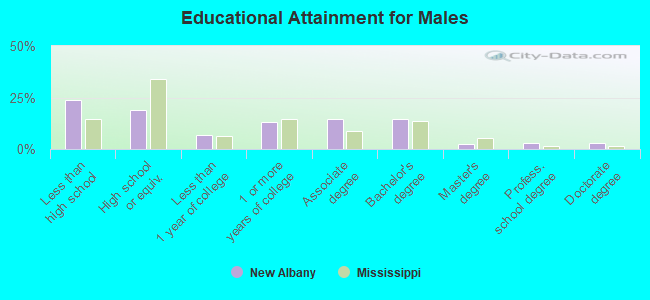
Education attainment for males 25 years and older:
- No schooling: 62
- Nursery to 4th grade: 26
- 5th and 6th grade: 54
- 7th and 8th grade: 45
- 9th grade: 38
- 10th grade: 53
- 11th grade: 135
- 12th grade, no diploma: 119
- High school graduate (or equivalency): 425
- Less than 1 year of college: 146
- Some college more than 1 year, no degree: 288
- Associate degree: 322
- Bachelor's degree: 327
- Master's degree: 50
- Professional school degree: 64
- Doctorate degree: 67
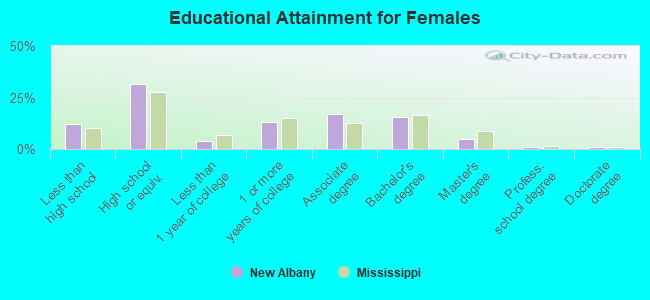
Education attainment for females 25 years and older:
- No schooling: 5
- Nursery to 4th grade: 12
- 5th and 6th grade: 39
- 7th and 8th grade: 72
- 9th grade: 49
- 10th grade: 79
- 11th grade: 57
- 12th grade, no diploma: 17
- High school graduate (or equivalency): 858
- Less than 1 year of college: 109
- Some college more than 1 year, no degree: 357
- Associate degree: 461
- Bachelor's degree: 418
- Master's degree: 132
- Professional school degree: 26
- Doctorate degree: 31
Housing units in structures:
- One, detached: 2,542
- One, attached: 80
- Two: 294
- 3 or 4: 122
- 5 to 9: 119
- 10 to 19: 72
- 20 to 49: 24
- 50 or more: 89
- Mobile homes: 146
Housing units lacking complete kitchen facilities in 2022: 2.1%
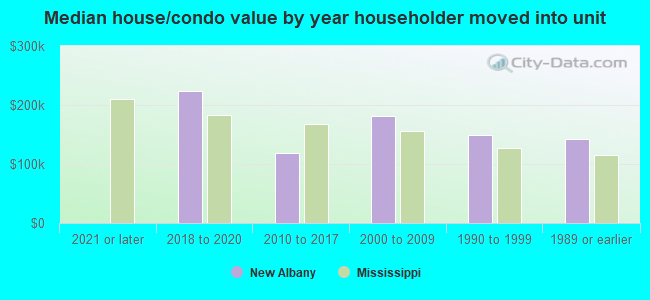
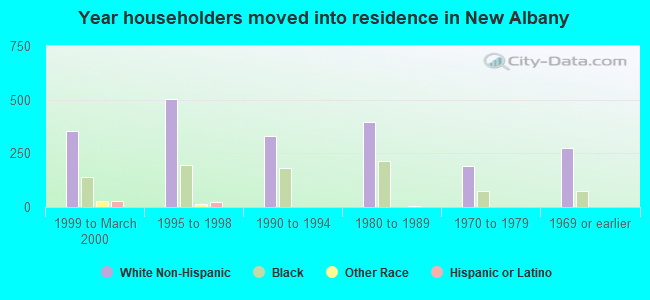
House/condo owner moved in on average 12 years ago
Renter moved in on average 5 years ago
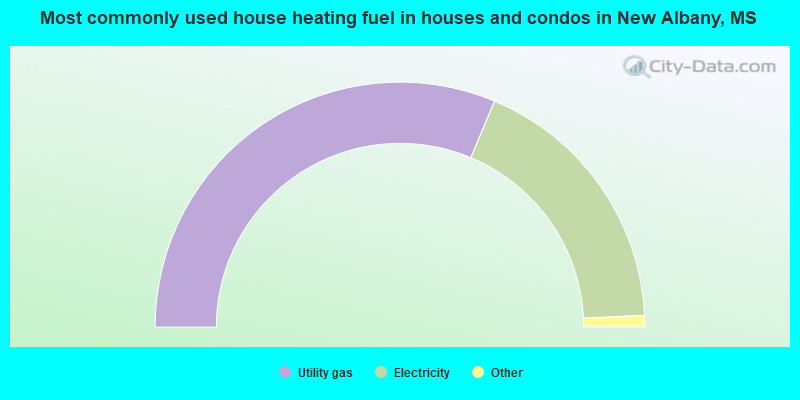
- 62.7%Utility gas
- 35.9%Electricity
- 0.9%Fuel oil, kerosene, etc.
- 0.5%No fuel used
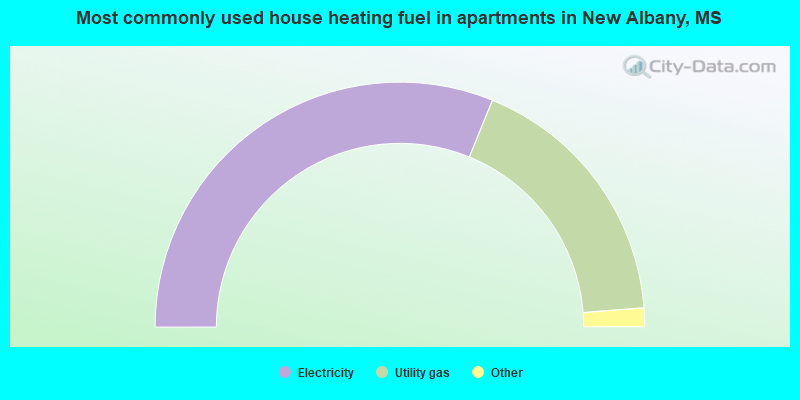
- 62.4%Electricity
- 35.2%Utility gas
- 1.4%Bottled, tank, or LP gas
- 1.0%Fuel oil, kerosene, etc.
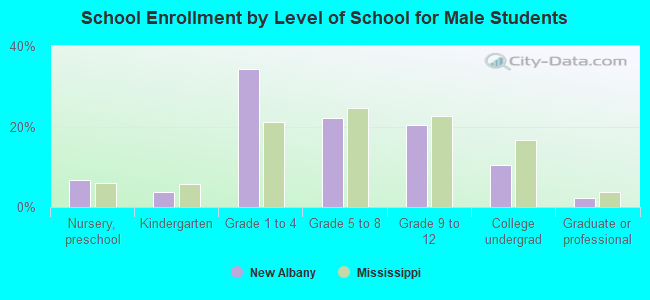
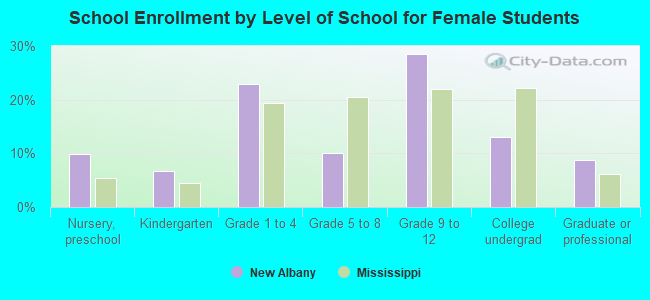
Private vs. public school enrollment:
| Here: | 2.9% |
| Mississippi: | 16.1% |
| Here: | 0.0% |
| Mississippi: | 14.6% |
| Here: | 16.2% |
| Mississippi: | 12.8% |