Housing density: 12,130 houses/condos per square mile
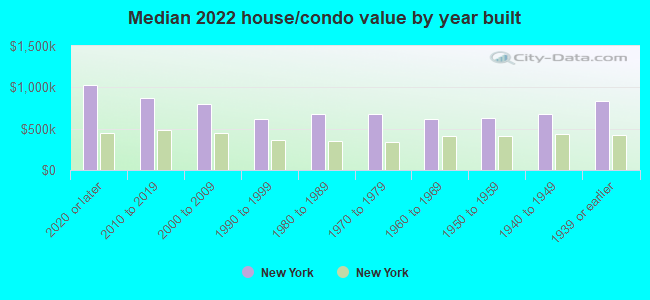
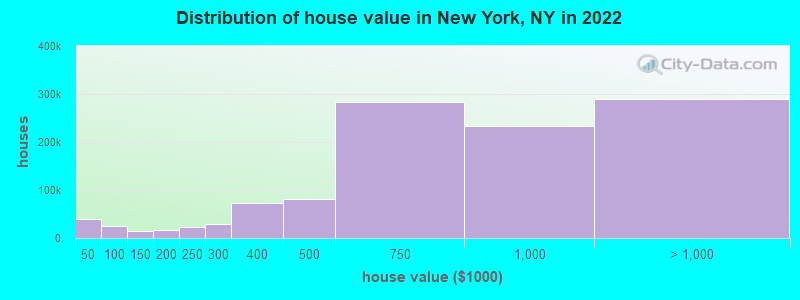
Median price asked for vacant for-sale houses and condos in 2022: $1,532,599.
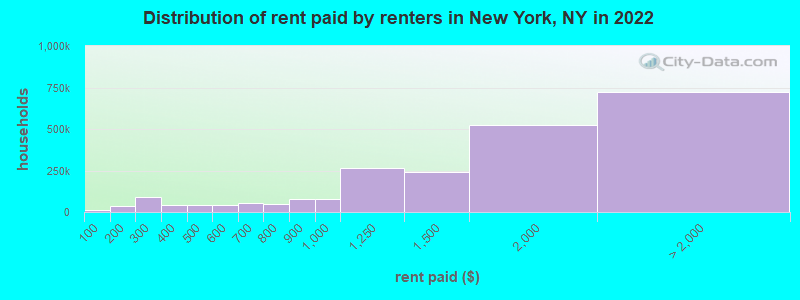
Median contract rent in 2022: $1,573 (lower quartile is $1,025, upper quartile is over $2,000)
Median rent asked for vacant for-rent units in 2022: $1,910
Median gross rent in New York, NY in 2022: $1,688
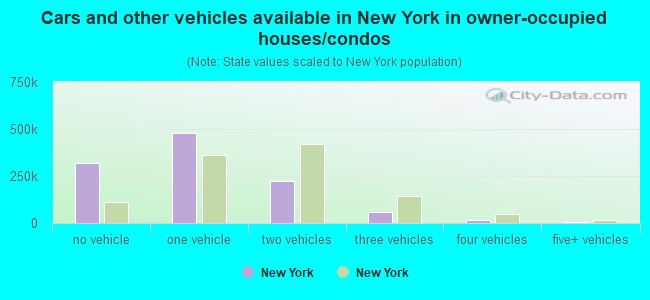
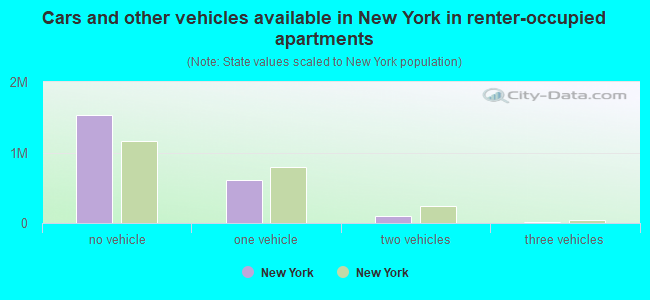
Housing units in New York with a mortgage: 619,055 (50,156 second mortgage, 2,680 home equity loan, 37,526 both second mortgage and home equity loan) Houses without a mortgage: 16,407
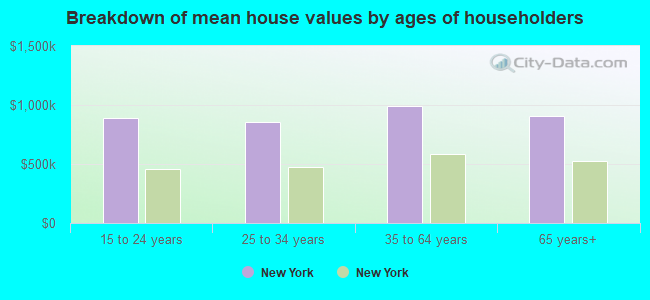
Median household income for houses/condos with a mortgage: $133,864
Median household income for apartments without a mortgage: $89,465
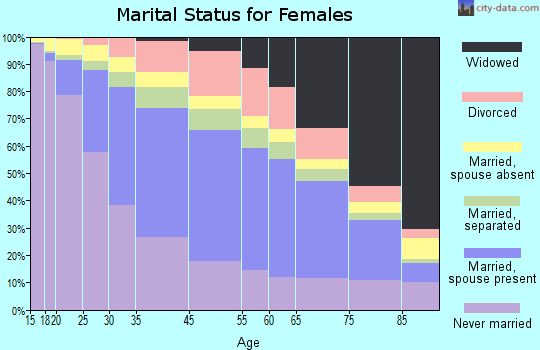
902,048 married couples with children.
505,016 single-parent households (96,380 men, 408,636 women).
52.0% of residents of New York speak English at home.
23.1% of residents speak Spanish at home (53% speak English very well, 19% speak English well, 19% speak English not well, 9% don't speak English at all).
12.8% of residents speak other Indo-European language at home (58% speak English very well, 26% speak English well, 13% speak English not well, 3% don't speak English at all).
9.0% of residents speak Asian or Pacific Island language at home (40% speak English very well, 23% speak English well, 25% speak English not well, 12% don't speak English at all).
3.1% of residents speak other language at home (68% speak English very well, 22% speak English well, 8% speak English not well, 2% don't speak English at all).
Foreign born population: 3,065,136 (36.8%)
(60.3% of them are naturalized citizens)
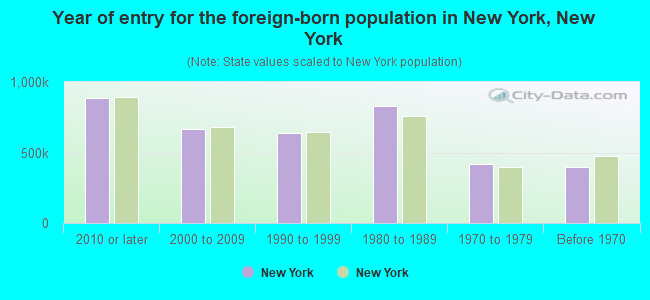
Year of entry for the foreign-born population in New York, New York
887,1272010 or later
668,8502000 to 2009
641,8221990 to 1999
831,7581980 to 1989
417,3481970 to 1979
397,402Before 1970
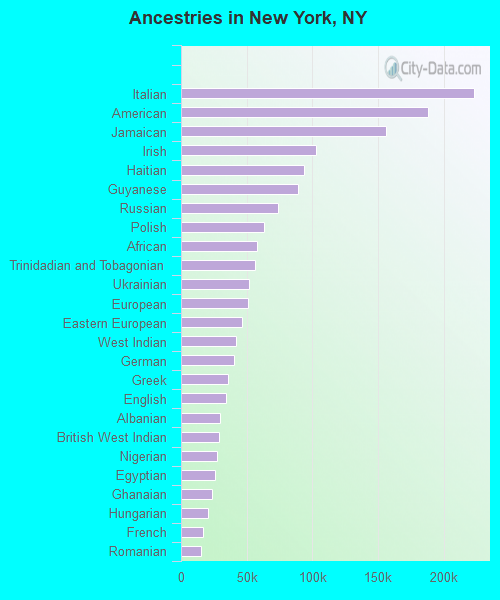
First ancestries reported:
Italian: 223,388 (4.2%)
American: 188,027 (3.6%)
Jamaican: 156,460 (3.0%)
Irish: 102,652 (1.9%)
Haitian: 93,599 (1.8%)
Guyanese: 89,335 (1.7%)
Russian: 74,078 (1.4%)
Polish: 62,917 (1.2%)
African: 57,919 (1.1%)
Trinidadian and Tobagonian: 56,578 (1.1%)
Ukrainian: 51,853 (1.0%)
European: 50,810 (1.0%)
Eastern European: 46,340 (0.9%)
West Indian: 42,170 (0.8%)
German: 40,255 (0.8%)
Greek: 36,007 (0.7%)
English: 34,425 (0.7%)
Albanian: 30,026 (0.6%)
British West Indian: 29,005 (0.5%)
Nigerian: 27,269 (0.5%)
Egyptian: 25,797 (0.5%)
Ghanaian: 23,808 (0.5%)
Hungarian: 20,900 (0.4%)
French: 16,797 (0.3%)
Romanian: 15,322 (0.3%)
Barbadian: 13,546 (0.3%)
Turkish: 13,006 (0.2%)
Israeli: 10,524 (0.2%)
Iranian: 9,240 (0.2%)
British: 9,029 (0.2%)
Armenian: 8,693 (0.2%)
Moroccan: 7,926 (0.2%)
Scottish: 7,724 (0.1%)
Lebanese: 7,570 (0.1%)
Brazilian: 7,130 (0.1%)
Syrian: 7,115 (0.1%)
Macedonian: 6,582 (0.1%)
Belizean: 6,381 (0.1%)
Arab: 5,368 (0.1%)
Norwegian: 5,171 (0.10%)
Ethiopian: 5,073 (0.10%)
Senegalese: 4,891 (0.09%)
Palestinian: 4,771 (0.09%)
Lithuanian: 4,710 (0.09%)
Afghan: 4,629 (0.09%)
Portuguese: 4,531 (0.09%)
Slavic: 4,264 (0.08%)
Liberian: 4,156 (0.08%)
Croatian: 3,952 (0.07%)
Dutch: 3,787 (0.07%)
Swedish: 3,525 (0.07%)
Bulgarian: 3,519 (0.07%)
Danish: 3,055 (0.06%)
Slovak: 3,032 (0.06%)
South African: 2,936 (0.06%)
Serbian: 2,915 (0.06%)
Austrian: 2,905 (0.06%)
French Canadian: 2,802 (0.05%)
Northern European: 2,474 (0.05%)
Scotch-Irish: 2,207 (0.04%)
Czech: 1,953 (0.04%)
Yugoslavian: 1,927 (0.04%)
Swiss: 1,894 (0.04%)
Scandinavian: 1,686 (0.03%)
Canadian: 1,679 (0.03%)
Maltese: 1,626 (0.03%)
Australian: 1,500 (0.03%)
Belgian: 1,310 (0.02%)
Kenyan: 1,299 (0.02%)
U.S. Virgin Islander: 1,296 (0.02%)
Latvian: 1,160 (0.02%)
Jordanian: 1,098 (0.02%)
Iraqi: 1,064 (0.02%)
Welsh: 1,059 (0.02%)
Sudanese: 1,045 (0.02%)
Cape Verdean: 971 (0.02%)
Sierra Leonean: 911 (0.02%)
Icelander: 898 (0.02%)
Dutch West Indian: 885 (0.02%)
Czechoslovakian: 799 (0.02%)
Finnish: 786 (0.01%)
Cypriot: 785 (0.01%)
Soviet Union: 518 (0.01%)
Somali: 496 (0.01%)
Bahamian: 468 (0.01%)
Zimbabwean: 428 (0.01%)
Assyrian: 366 (0.01%)
Celtic: 328 (0.01%)
Estonian: 301 (0.01%)
Basque: 275 (0.01%)
Most common places of birth for foreign-born residents (%):
Dominican Republic
New York:
13.7% (419,526)
New York:
11.3% (502,381)
China, excluding Hong Kong and Taiwan
New York:
11.3% (347,231)
New York:
9.5% (423,118)
Mexico
New York:
5.4% (166,670)
New York:
4.9% (219,146)
Jamaica
New York:
4.9% (151,559)
New York:
5.0% (224,376)
Guyana
New York:
4.5% (137,769)
New York:
3.7% (165,926)
Ecuador
New York:
4.0% (121,999)
New York:
4.0% (177,976)
Bangladesh
New York:
3.2% (97,506)
New York:
2.6% (118,181)
Haiti
New York:
2.6% (78,316)
New York:
2.7% (119,938)
Colombia
New York:
2.5% (78,001)
New York:
2.7% (122,494)
Trinidad and Tobago
New York:
2.4% (72,125)
New York:
2.0% (88,108)
India
New York:
2.2% (68,805)
New York:
3.3% (146,955)
Ukraine
New York:
2.1% (65,719)
New York:
1.9% (83,376)
Philippines
New York:
1.8% (53,997)
New York:
2.0% (88,656)
Korea
New York:
1.7% (50,825)
New York:
1.9% (82,663)
Russia
New York:
1.6% (48,411)
New York:
1.4% (63,022)
Place of birth for U.S.-born residents:
This state: 3,998,613
Other state: 974,492
Northeast: 318,620
Midwest: 162,571
South: 323,719
West: 169,582
89.3% of New York residents lived in the same house 1 years ago. Out of people who lived in different houses, 37.2% lived in this county. Out of people who lived in different counties, 27.2% lived in New York.
New York:
89.3%
State average:
89.6%
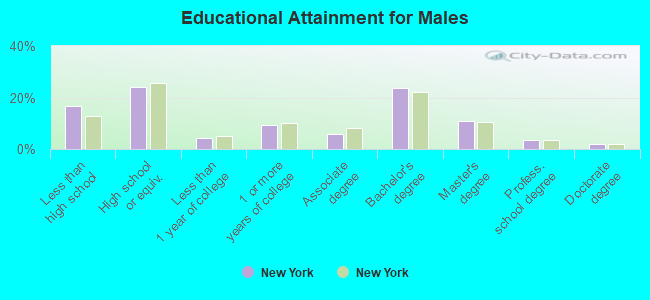
Education attainment for males 25 years and older:
No schooling: 106,767
Nursery to 4th grade: 22,162
5th and 6th grade: 58,032
7th and 8th grade: 54,880
9th grade: 44,097
10th grade: 43,582
11th grade: 41,386
12th grade, no diploma: 93,630
High school graduate (or equivalency): 681,630
Less than 1 year of college: 115,987
Some college more than 1 year, no degree: 262,444
Associate degree: 159,096
Bachelor's degree: 665,967
Master's degree: 304,555
Professional school degree: 103,379
Doctorate degree: 53,367
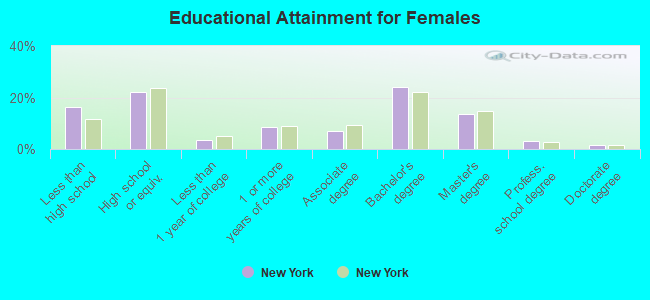
Education attainment for females 25 years and older:
No schooling: 122,527
Nursery to 4th grade: 28,958
5th and 6th grade: 74,216
7th and 8th grade: 61,456
9th grade: 50,062
10th grade: 43,719
11th grade: 46,730
12th grade, no diploma: 86,872
High school graduate (or equivalency): 699,247
Less than 1 year of college: 115,116
Some college more than 1 year, no degree: 266,701
Associate degree: 216,267
Bachelor's degree: 758,774
Master's degree: 431,724
Professional school degree: 95,078
Doctorate degree: 52,605
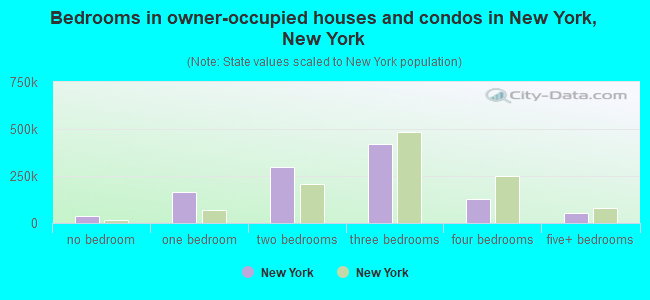
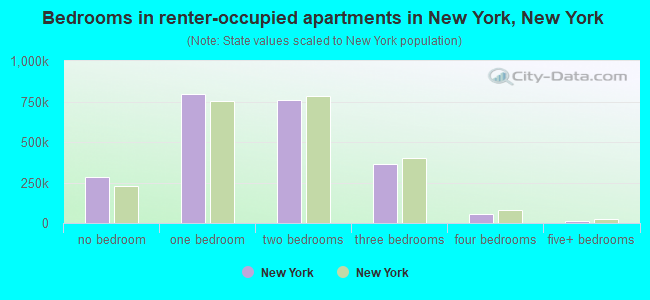
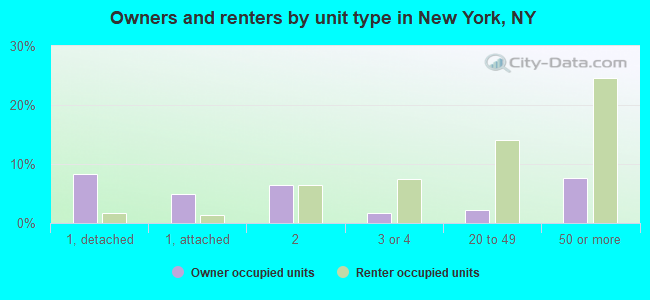
Housing units in structures:
One, detached: 339,417
One, attached: 257,428
Two: 448,188
3 or 4: 332,899
5 to 9: 246,495
10 to 19: 245,587
20 to 49: 593,019
50 or more: 1,207,779
Mobile homes: 7,079
Boats, RVs, vans, etc.: 1,172
Median worth of mobile homes: $105,100
Housing units lacking complete plumbing facilities in 2022: 0.9%
Housing units lacking complete kitchen facilities in 2022: 1.6%
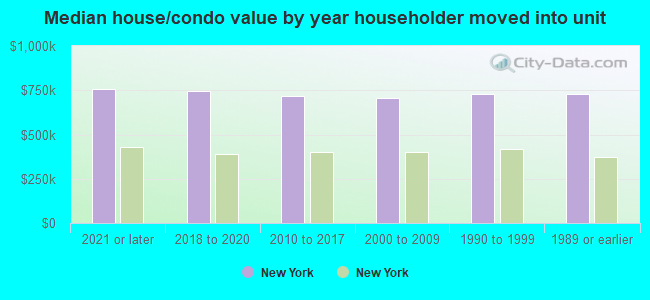
House/condo owner moved in on average 15 years ago