Races in New York, New York (NY) Detailed Stats
Data:
Races - White alone (%)
Races - White alone (% change since 2000)
Races - Black alone (%)
Races - Black alone (% change since 2000)
Races - American Indian alone (%)
Races - American Indian alone (% change since 2000)
Races - Asian alone (%)
Races - Asian alone (% change since 2000)
Races - Hispanic (%)
Races - Hispanic (% change since 2000)
Races - Native Hawaiian and Other Pacific Islander alone (%)
Races - Native Hawaiian and Other Pacific Islander alone (% change since 2000)
Races - Two or more races(%)
Races - Two or more races(% change since 2000)
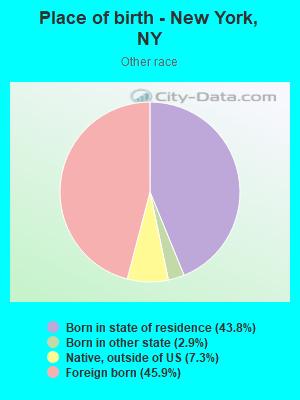
Races - Other race alone (%)
Races - Other race alone (% change since 2000)
Racial diversity
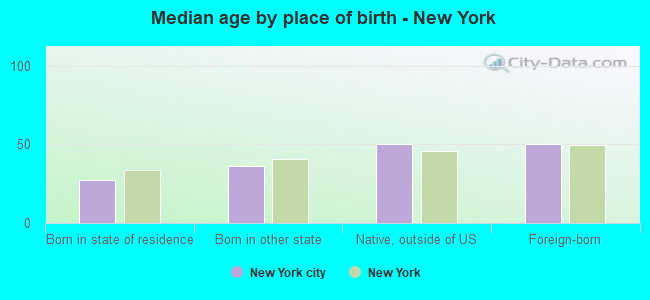
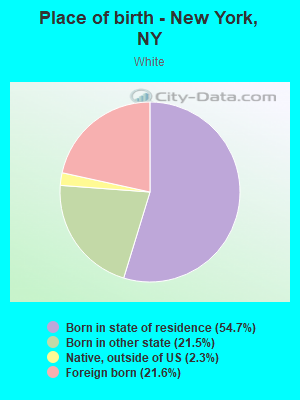
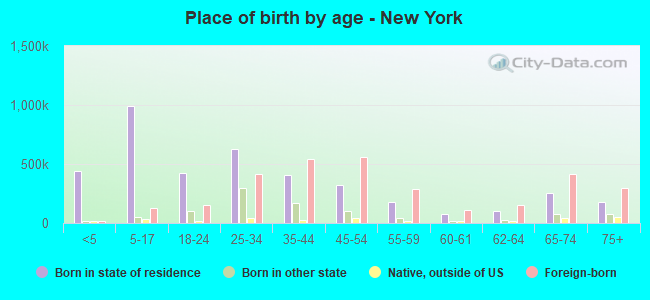
Place of birth - Born in state of residence (%)
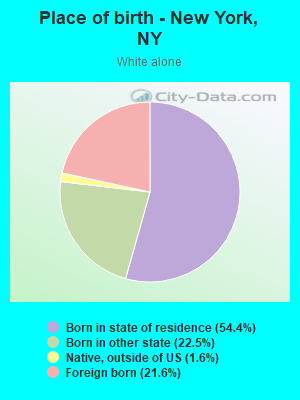
Place of birth - Born in state of residence (%) - White
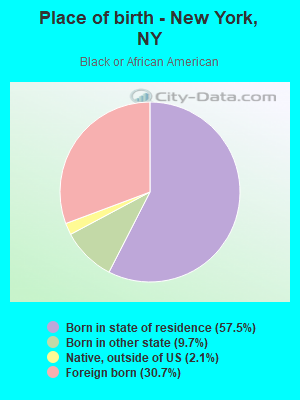
Place of birth - Born in state of residence (%) - Black or African American
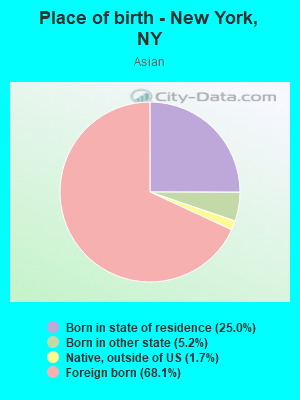
Place of birth - Born in state of residence (%) - Asian
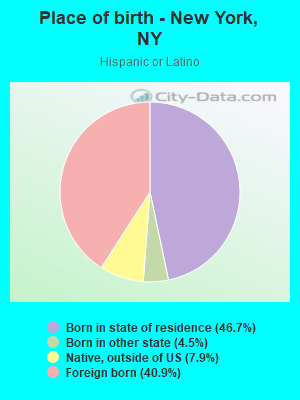
Place of birth - Born in state of residence (%) - Hispanic or Latino
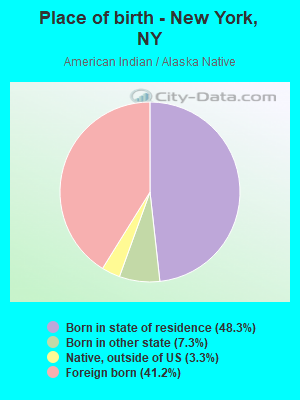
Place of birth - Born in state of residence (%) - American Indian and Alaska Native
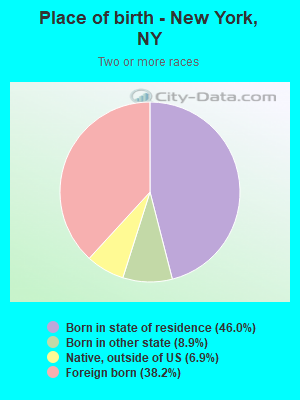
Place of birth - Born in state of residence (%) - Multirace
Place of birth - Born in state of residence (%) - Other Race
Place of birth - Born in other state (%)
Place of birth - Born in other state (%) - White
Place of birth - Born in other state (%) - Black or African American
Place of birth - Born in other state (%) - Asian
Place of birth - Born in other state (%) - Hispanic or Latino
Place of birth - Born in other state (%) - American Indian and Alaska Native
Place of birth - Born in other state (%) - Multirace
Place of birth - Born in other state (%) - Other Race
Place of birth - Native, outside of US (%)
Place of birth - Native, outside of US (%) - White
Place of birth - Native, outside of US (%) - Black or African American
Place of birth - Native, outside of US (%) - Asian
Place of birth - Native, outside of US (%) - Hispanic or Latino
Place of birth - Native, outside of US (%) - American Indian and Alaska Native
Place of birth - Native, outside of US (%) - Multirace
Place of birth - Native, outside of US (%) - Other Race
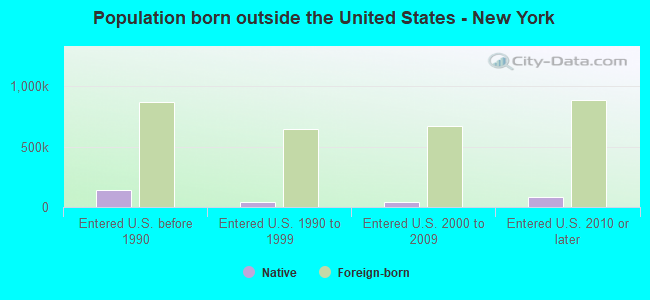
Place of birth - Foreign born (%)
Place of birth - Foreign born (%) - White
Place of birth - Foreign born (%) - Black or African American
Place of birth - Foreign born (%) - Asian
Place of birth - Foreign born (%) - Hispanic or Latino
Place of birth - Foreign born (%) - American Indian and Alaska Native
Place of birth - Foreign born (%) - Multirace
Place of birth - Foreign born (%) - Other Race
Residents speaking English at home (%)
Residents speaking English at home - Born in the United States (%)
Residents speaking English at home - Native, born elsewhere (%)
Residents speaking English at home - Foreign born (%)
Residents speaking Spanish at home (%)
Residents speaking Spanish at home - Born in the United States (%)
Residents speaking Spanish at home - Native, born elsewhere (%)
Residents speaking Spanish at home - Foreign born (%)
Residents speaking other language at home (%)
Residents speaking other language at home - Born in the United States (%)
Residents speaking other language at home - Native, born elsewhere (%)
Residents speaking other language at home - Foreign born (%)
Marital status - Never married (%)
Marital status - Now married (%)
Marital status - Separated (%)
Marital status - Widowed (%)
Marital status - Divorced (%)
Ancestries Reported - Arab (%)
Ancestries Reported - Czech (%)
Ancestries Reported - Danish (%)
Ancestries Reported - Dutch (%)
Ancestries Reported - English (%)
Ancestries Reported - French (%)
Ancestries Reported - French Canadian (%)
Ancestries Reported - German (%)
Ancestries Reported - Greek (%)
Ancestries Reported - Hungarian (%)
Ancestries Reported - Irish (%)
Ancestries Reported - Italian (%)
Ancestries Reported - Lithuanian (%)
Ancestries Reported - Norwegian (%)
Ancestries Reported - Polish (%)
Ancestries Reported - Portuguese (%)
Ancestries Reported - Russian (%)
Ancestries Reported - Scotch-Irish (%)
Ancestries Reported - Scottish (%)
Ancestries Reported - Slovak (%)
Ancestries Reported - Subsaharan African (%)
Ancestries Reported - Swedish (%)
Ancestries Reported - Swiss (%)
Ancestries Reported - Ukrainian (%)
Ancestries Reported - United States (%)
Ancestries Reported - Welsh (%)
Ancestries Reported - West Indian (%)
Ancestries Reported - Other (%)
Geographical mobility - Same house 1 year ago (%)
Geographical mobility - Same house 1 year ago (%) - White
Geographical mobility - Same house 1 year ago (%) - Black or African American
Geographical mobility - Same house 1 year ago (%) - Asian
Geographical mobility - Same house 1 year ago (%) - Hispanic or Latino
Geographical mobility - Same house 1 year ago (%) - American Indian and Alaska Native
Geographical mobility - Same house 1 year ago (%) - Multirace
Geographical mobility - Same house 1 year ago (%) - Other Race
Geographical mobility - Moved within same county (%)
Geographical mobility - Moved within same county (%) - White
Geographical mobility - Moved within same county (%) - Black or African American
Geographical mobility - Moved within same county (%) - Asian
Geographical mobility - Moved within same county (%) - Hispanic or Latino
Geographical mobility - Moved within same county (%) - American Indian and Alaska Native
Geographical mobility - Moved within same county (%) - Multirace
Geographical mobility - Moved within same county (%) - Other Race
Geographical mobility - Moved from different county within same state (%)
Geographical mobility - Moved from different county within same state (%) - White
Geographical mobility - Moved from different county within same state (%) - Black or African American
Geographical mobility - Moved from different county within same state (%) - Asian
Geographical mobility - Moved from different county within same state (%) - Hispanic or Latino
Geographical mobility - Moved from different county within same state (%) - American Indian and Alaska Native
Geographical mobility - Moved from different county within same state (%) - Multirace
Geographical mobility - Moved from different county within same state (%) - Other Race
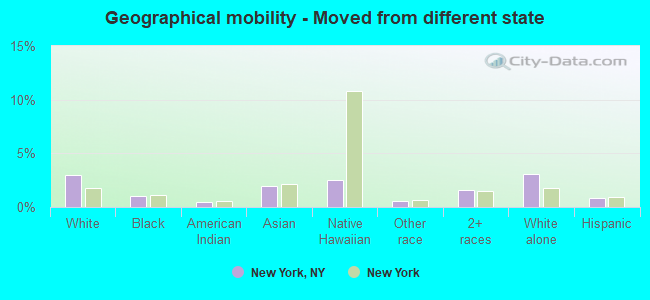
Geographical mobility - Moved from different state (%)
Geographical mobility - Moved from different state (%) - White
Geographical mobility - Moved from different state (%) - Black or African American
Geographical mobility - Moved from different state (%) - Asian
Geographical mobility - Moved from different state (%) - Hispanic or Latino
Geographical mobility - Moved from different state (%) - American Indian and Alaska Native
Geographical mobility - Moved from different state (%) - Multirace
Geographical mobility - Moved from different state (%) - Other Race
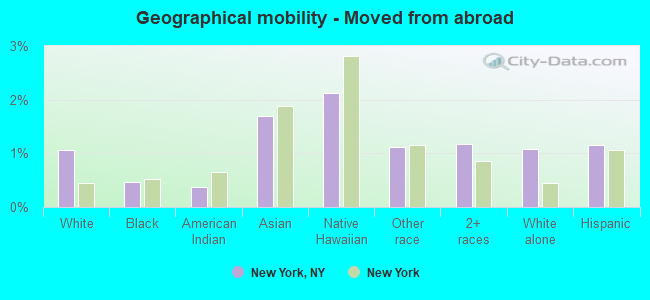
Geographical mobility - Moved from abroad (%)
Geographical mobility - Moved from abroad (%) - White
Geographical mobility - Moved from abroad (%) - Black or African American
Geographical mobility - Moved from abroad (%) - Asian
Geographical mobility - Moved from abroad (%) - Hispanic or Latino
Geographical mobility - Moved from abroad (%) - American Indian and Alaska Native
Geographical mobility - Moved from abroad (%) - Multirace
Geographical mobility - Moved from abroad (%) - Other Race
Place of birth for the foreign-born population - Ireland (%)
Place of birth for the foreign-born population - Denmark (%)
Place of birth for the foreign-born population - Norway (%)
Place of birth for the foreign-born population - Sweden (%)
Place of birth for the foreign-born population - United Kingdom (%)
Place of birth for the foreign-born population - England (%)
Place of birth for the foreign-born population - Scotland (%)
Place of birth for the foreign-born population - Other Northern Europe (%)
Place of birth for the foreign-born population - Austria (%)
Place of birth for the foreign-born population - Belgium (%)
Place of birth for the foreign-born population - France (%)
Place of birth for the foreign-born population - Germany (%)
Place of birth for the foreign-born population - Netherlands (%)
Place of birth for the foreign-born population - Switzerland (%)
Place of birth for the foreign-born population - Other Western Europe (%)
Place of birth for the foreign-born population - Greece (%)
Place of birth for the foreign-born population - Italy (%)
Place of birth for the foreign-born population - Portugal (%)
Place of birth for the foreign-born population - Spain (%)
Place of birth for the foreign-born population - Other Southern Europe (%)
Place of birth for the foreign-born population - Albania (%)
Place of birth for the foreign-born population - Belarus (%)
Place of birth for the foreign-born population - Bosnia and Herzegovina (%)
Place of birth for the foreign-born population - Bulgaria (%)
Place of birth for the foreign-born population - Croatia (%)
Place of birth for the foreign-born population - Czechoslovakia (%)
Place of birth for the foreign-born population - Hungary (%)
Place of birth for the foreign-born population - Latvia (%)
Place of birth for the foreign-born population - Lithuania (%)
Place of birth for the foreign-born population - North Macedonia (Macedonia) (%)
Place of birth for the foreign-born population - Moldova (%)
Place of birth for the foreign-born population - Poland (%)
Place of birth for the foreign-born population - Romania (%)
Place of birth for the foreign-born population - Russia (%)
Place of birth for the foreign-born population - Serbia (%)
Place of birth for the foreign-born population - Ukraine (%)
Place of birth for the foreign-born population - Other Eastern Europe (%)
Place of birth for the foreign-born population - China (%)
Place of birth for the foreign-born population - Hong Kong (%)
Place of birth for the foreign-born population - Taiwan (%)
Place of birth for the foreign-born population - Japan (%)
Place of birth for the foreign-born population - Korea (%)
Place of birth for the foreign-born population - Other Eastern Asia (%)
Place of birth for the foreign-born population - Afghanistan (%)
Place of birth for the foreign-born population - Bangladesh (%)
Place of birth for the foreign-born population - India (%)
Place of birth for the foreign-born population - Iran (%)
Place of birth for the foreign-born population - Kazakhstan (%)
Place of birth for the foreign-born population - Nepal (%)
Place of birth for the foreign-born population - Pakistan (%)
Place of birth for the foreign-born population - Sri Lanka (%)
Place of birth for the foreign-born population - Uzbekistan (%)
Place of birth for the foreign-born population - Other South Central Asia (%)
Place of birth for the foreign-born population - Burma (%)
Place of birth for the foreign-born population - Cambodia (%)
Place of birth for the foreign-born population - Indonesia (%)
Place of birth for the foreign-born population - Laos (%)
Place of birth for the foreign-born population - Malaysia (%)
Place of birth for the foreign-born population - Philippines (%)
Place of birth for the foreign-born population - Singapore (%)
Place of birth for the foreign-born population - Thailand (%)
Place of birth for the foreign-born population - Vietnam (%)
Place of birth for the foreign-born population - Other South Eastern Asia (%)
Place of birth for the foreign-born population - Armenia (%)
Place of birth for the foreign-born population - Iraq (%)
Place of birth for the foreign-born population - Israel (%)
Place of birth for the foreign-born population - Jordan (%)
Place of birth for the foreign-born population - Kuwait (%)
Place of birth for the foreign-born population - Lebanon (%)
Place of birth for the foreign-born population - Saudi Arabia (%)
Place of birth for the foreign-born population - Syria (%)
Place of birth for the foreign-born population - Turkey (%)
Place of birth for the foreign-born population - Yemen (%)
Place of birth for the foreign-born population - Other Western Asia (%)
Place of birth for the foreign-born population - Eritrea (%)
Place of birth for the foreign-born population - Ethiopia (%)
Place of birth for the foreign-born population - Kenya (%)
Place of birth for the foreign-born population - Somalia (%)
Place of birth for the foreign-born population - Uganda (%)
Place of birth for the foreign-born population - Zimbabwe (%)
Place of birth for the foreign-born population - Other Eastern Africa (%)
Place of birth for the foreign-born population - Cameroon (%)
Place of birth for the foreign-born population - Congo (%)
Place of birth for the foreign-born population - Democratic Republic of Congo (Zaire) (%)
Place of birth for the foreign-born population - Other Middle Africa (%)
Place of birth for the foreign-born population - Egypt (%)
Place of birth for the foreign-born population - Morocco (%)
Place of birth for the foreign-born population - Sudan (%)
Place of birth for the foreign-born population - Other Northern Africa (%)
Place of birth for the foreign-born population - South Africa (%)
Place of birth for the foreign-born population - Other Southern Africa (%)
Place of birth for the foreign-born population - Cabo Verde (%)
Place of birth for the foreign-born population - Ghana (%)
Place of birth for the foreign-born population - Liberia (%)
Place of birth for the foreign-born population - Nigeria (%)
Place of birth for the foreign-born population - Senegal (%)
Place of birth for the foreign-born population - Sierra Leone (%)
Place of birth for the foreign-born population - Other Western Africa (%)
Place of birth for the foreign-born population - Australia (%)
Place of birth for the foreign-born population - New Zealand (%)
Place of birth for the foreign-born population - Fiji (%)
Place of birth for the foreign-born population - Micronesia (%)
Place of birth for the foreign-born population - Bahamas (%)
Place of birth for the foreign-born population - Barbados (%)
Place of birth for the foreign-born population - Cuba (%)
Place of birth for the foreign-born population - Dominica (%)
Place of birth for the foreign-born population - Dominican Republic (%)
Place of birth for the foreign-born population - Grenada (%)
Place of birth for the foreign-born population - Haiti (%)
Place of birth for the foreign-born population - Jamaica (%)
Place of birth for the foreign-born population - St. Vincent and the Grenadines (%)
Place of birth for the foreign-born population - Trinidad and Tobago (%)
Place of birth for the foreign-born population - West Indies (%)
Place of birth for the foreign-born population - Other Caribbean (%)
Place of birth for the foreign-born population - Belize (%)
Place of birth for the foreign-born population - Costa Rica (%)
Place of birth for the foreign-born population - El Salvador (%)
Place of birth for the foreign-born population - Guatemala (%)
Place of birth for the foreign-born population - Honduras (%)
Place of birth for the foreign-born population - Mexico (%)
Place of birth for the foreign-born population - Nicaragua (%)
Place of birth for the foreign-born population - Panama (%)
Place of birth for the foreign-born population - Other Central America (%)
Place of birth for the foreign-born population - Argentina (%)
Place of birth for the foreign-born population - Bolivia (%)
Place of birth for the foreign-born population - Brazil (%)
Place of birth for the foreign-born population - Chile (%)
Place of birth for the foreign-born population - Colombia (%)
Place of birth for the foreign-born population - Ecuador (%)
Place of birth for the foreign-born population - Guyana (%)
Place of birth for the foreign-born population - Peru (%)
Place of birth for the foreign-born population - Uruguay (%)
Place of birth for the foreign-born population - Venezuela (%)
Place of birth for the foreign-born population - Other South America (%)
Place of birth for the foreign-born population - Canada (%)
Place of birth for the foreign-born population - Other Northern America (%)
Place of birth for the foreign-born population - Other (%)
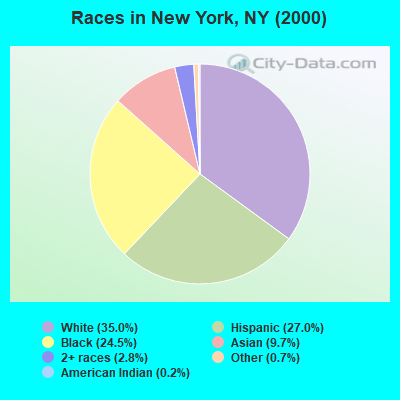
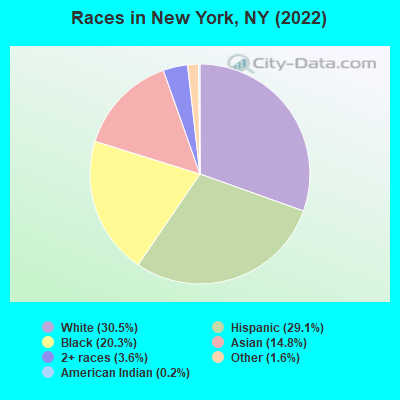
According to 2022 data, the most numerous races in New York, NY are White alone (2,545,189 residents), Hispanic (2,423,203 residents), and Black alone (1,690,068 residents). 52.0% of New York residents speak English at home. 36.8% of New York, NY residents are foreign-born (18.2% born in Latin America, 11.1% born in Asia, 4.9% born in Europe), which is 40.2% greater than the foreign-born rate of 22.0% across the entire state of New York.
Race distribution in New York
2000 2022
2,801,267 35.0% White alone 2,160,554 27.0% Hispanic 1,962,154 24.5% Black alone 780,229 9.7% Asian alone 225,149 2.8% Two or more races 58,775 0.7% Other race alone 17,321 0.2% American Indian alone 2,829 0.04% Native Hawaiian and Other
2,545,189 30.5% White alone 2,423,203 29.1% Hispanic 1,690,068 20.3% Black alone 1,229,699 14.8% Asian alone 298,145 3.6% Two or more races 130,651 1.6% Other race alone 15,208 0.2% American Indian alone 3,734 0.04% Native Hawaiian and Other
2000 2022
11,760,981 62.0% White alone 2,867,583 15.1% Hispanic 2,812,623 14.8% Black alone 1,035,926 5.5% Asian alone 366,116 1.9% Two or more races 75,499 0.4% Other race alone 52,499 0.3% American Indian alone 5,230 0.03% Native Hawaiian and Other
10,408,933 52.9% White alone 3,867,299 19.7% Hispanic 2,633,840 13.4% Black alone 1,776,286 9.0% Asian alone 732,670 3.7% Two or more races 216,110 1.1% Other race alone 35,082 0.2% American Indian alone 6,931 0.04% Native Hawaiian and Other
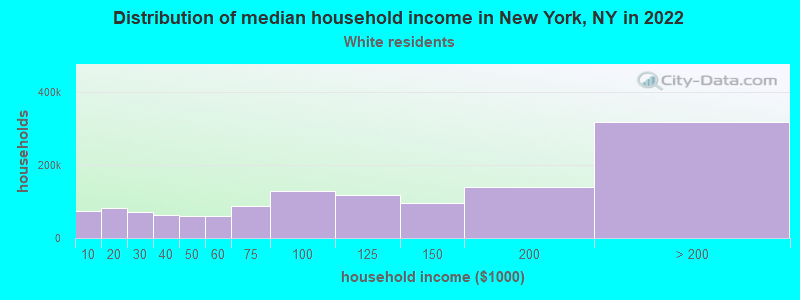
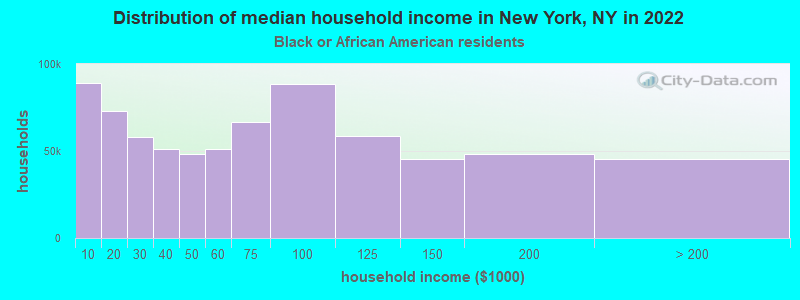
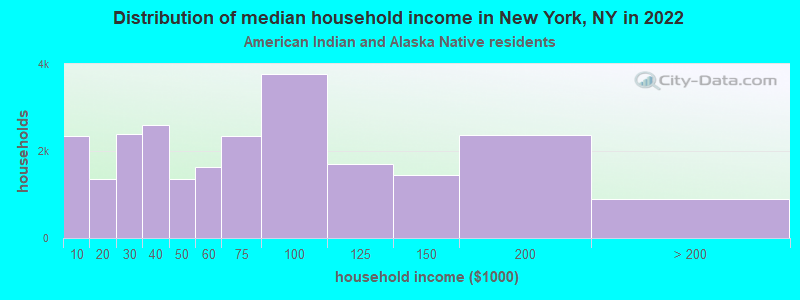
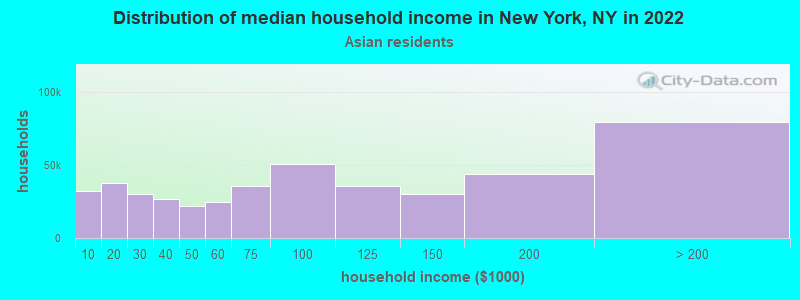
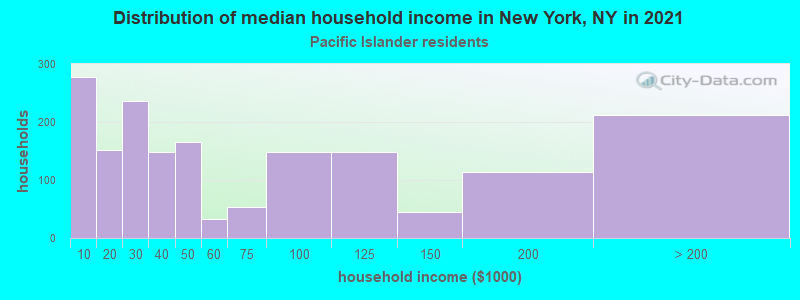
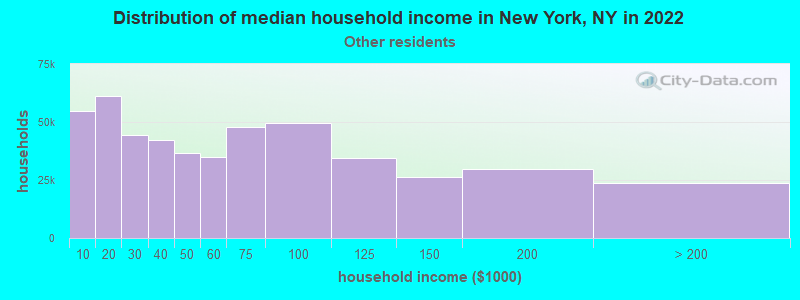
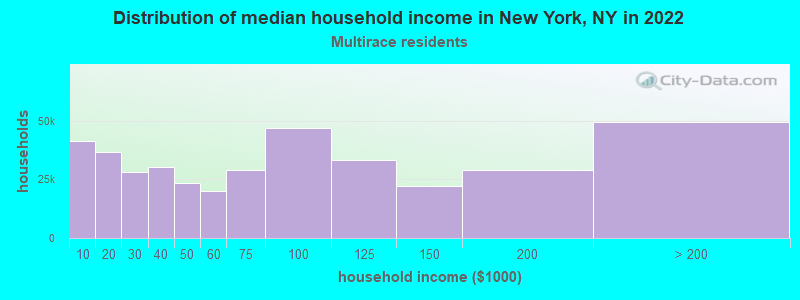
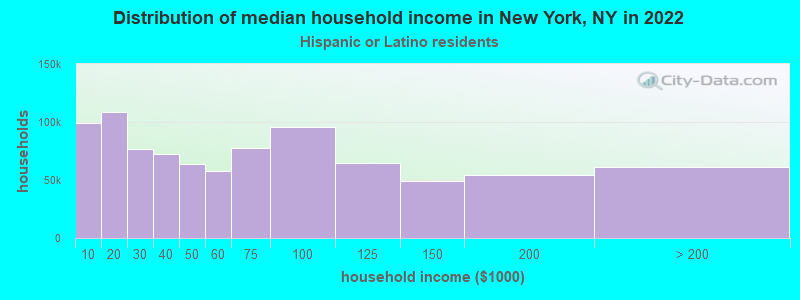
Income and house value in New York Median household income in 2022 $106,649 White non-Hispanic householders$58,073 Black householders$62,584 American Indian and Alaska Native householders$82,101 Asian householders$60,951 Native Hawaiian and other Pacific Islander householders$50,872 Some other race householders$67,835 Two or more races householders$53,025 Hispanic or Latino race householdersMedian 2022 house value $784,657 White Non-Hispanic householders$581,615 Black or African American householders$587,183 American Indian or Alaska Native householders $742,084 Asian householders$620,259 Native Hawaiian and other Pacific Islander householders$628,118 Some other race householders$638,926 Two or more races householders$635,323 Hispanic or Latino householders
Median age by race in New York
39.7 Median age for White residents38.9 40.4 38.7 Median age for Black or African American residents35.7 40.9 33.2 Median age for American Indian / Alaska Native residents34.5 31.2 40.4 Median age for Asian residents39.5 41.1 25.4 Median age for Native Hawaiian / Pacific Islander residents25.1 25.8 35.8 Median age for Other race residents34.8 37.3 35.6 Median age for Two or more races residents34.4 36.8 40.2 Median age for White alone residents39.5 40.9 35.4 Median age for Hispanic or Latino residents34.1 36.8
Owner/renter occupied households by race in New York
House owners and renters - White residents 517,051 39.8% Owner occupied780,854 60.2% Renter occupiedHouse owners and renters - Black or African American residents 194,870 26.9% Owner occupied529,404 73.1% Renter occupiedHouse owners and renters - American Indian / Alaska Native residents 6,110 25.2% Owner occupied18,139 74.8% Renter occupiedHouse owners and renters - Asian residents 206,805 46.0% Owner occupied243,151 54.0% Renter occupiedHouse owners and renters - Native Hawaiian / Pacific Islander residents 507 38.7% Owner occupied803 61.3% Renter occupiedHouse owners and renters - Other race residents 83,349 17.1% Owner occupied403,130 82.9% Renter occupiedHouse owners and renters - Two or more races residents 93,310 24.0% Owner occupied295,556 76.0% Renter occupiedHouse owners and renters - White alone residents 497,123 41.5% Owner occupied701,156 58.5% Renter occupiedHouse owners and renters - Hispanic or Latino residents 149,959 17.0% Owner occupied731,050 83.0% Renter occupied
Language usage in New York
English speakers - Total 52.0% of residents of New York speak English at home.
23.1% of residents speak Spanish at home 960,770 53.0% Speak English very well852,421 47.0% Speak English less than very well24.9% of residents speak other language at home 1,028,845 52.6% Speak English very well928,601 47.4% Speak English less than very well
English speakers - Born in the United States 87.6% of residents of New York speak English at home.
5.8% of residents speak Spanish at home 47,674 85.7% Speak English very well7,958 14.3% Speak English less than very well6.7% of residents speak other language at home 58,312 90.9% Speak English very well5,808 9.1% Speak English less than very well
English speakers - Native, born elsewhere 29.1% of residents of New York speak English at home.
57.1% of residents speak Spanish at home 86,020 52.6% Speak English very well77,482 47.4% Speak English less than very well13.8% of residents speak other language at home 29,177 73.8% Speak English very well10,342 26.2% Speak English less than very well
English speakers - Foreign-born 23.4% of residents of New York speak English at home.
30.6% of residents speak Spanish at home 264,769 28.4% Speak English very well668,932 71.6% Speak English less than very well46.0% of residents speak other language at home 600,146 42.8% Speak English very well803,291 57.2% Speak English less than very well
White (Caucasian) - Speak only English Native:
82.5% (1,677,695)Foreign-born:
20.4% (121,834)
White (Caucasian) - Speak another language Native:
17.5% (356,717)Foreign-born:
79.6% (474,366)
Black or African American - Speak only English Native:
90.1% (1,048,560)Foreign-born:
59.5% (331,603)
Black or African American - Speak another language Native:
9.9% (114,611)Foreign-born:
40.5% (225,786)
American Indian / Alaska Native - Speak only English Native:
45.0% (17,574)Foreign-born:
11.7% (3,375)
American Indian / Alaska Native - Speak another language Native:
55.0% (21,487)Foreign-born:
88.3% (25,373)
Asian - Speak only English Native:
41.2% (139,994)Foreign-born:
12.0% (101,014)
Asian - Speak another language Native:
58.8% (199,721)Foreign-born:
88.0% (739,967)
Native Hawaiian / Pacific Islander - Speak only English Native:
82.2% (2,563)Foreign-born:
36.1% (683)
Native Hawaiian / Pacific Islander - Speak another language Native:
14.4% (449)Foreign-born:
61.6% (1,167)
Other race - Speak only English Native:
27.6% (184,782)Foreign-born:
10.8% (69,176)
Other race - Speak another language Native:
72.4% (484,774)Foreign-born:
89.2% (569,373)
Two or more races - Speak only English Native:
54.5% (306,823)Foreign-born:
22.5% (87,355)
Two or more races - Speak another language Native:
45.5% (255,723)Foreign-born:
77.5% (300,874)
White alone - Speak only English Native:
85.5% (1,595,480)Foreign-born:
21.4% (116,786)
White alone - Speak another language Native:
14.5% (271,319)Foreign-born:
78.6% (429,284)
Hispanic or Latino - Speak only English Native:
34.4% (440,700)Foreign-born:
6.6% (64,969)
Hispanic or Latino - Speak another language Native:
65.6% (841,006)Foreign-born:
93.4% (921,384)
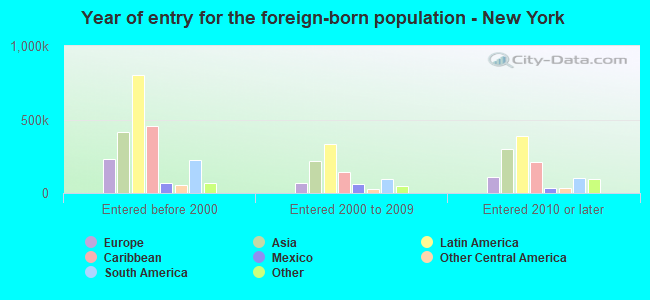
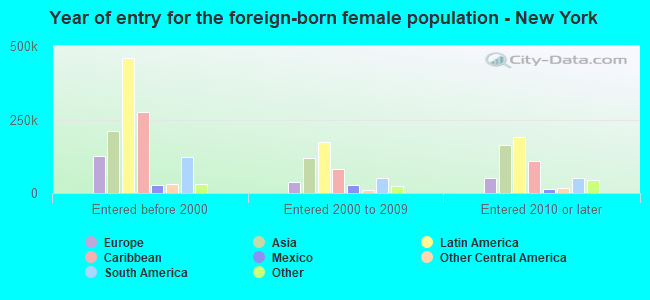
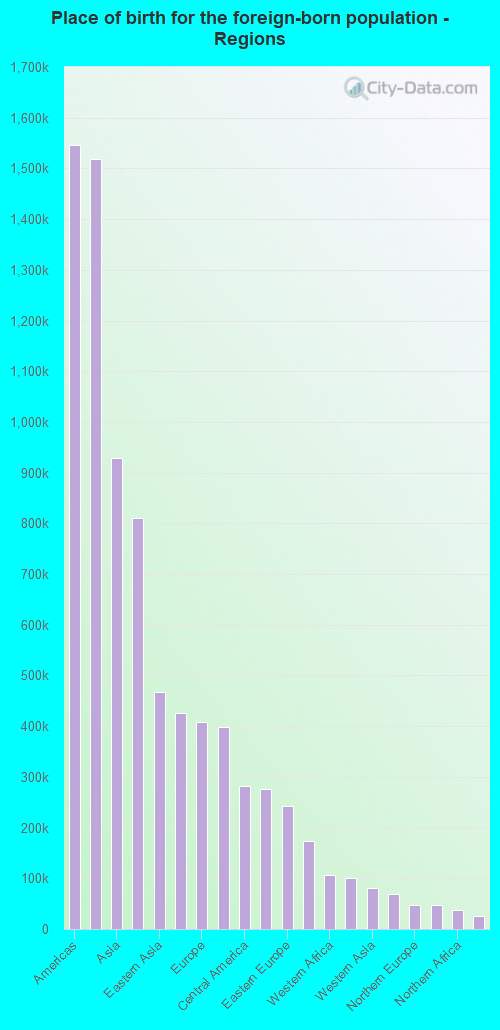
Foreign-born residents in New York 3,065,136 residents are foreign born (18.2% Latin America , 11.1% Asia , 4.9% Europe ).
This city:
36.8%New York:
22.7%
Marital status for residents in New York Marital status - White (Caucasian) population 15 years and over
Males 42.1% Never married47.8% Now married1.4% Separated2.1% Widowed6.5% DivorcedFemales 39.4% Never married41.4% Now married1.8% Separated8.4% Widowed9.0% DivorcedWomen who gave birth in the past 12 months Now married:
84.9% (28,459)Unmarried:
15.1% (5,061)
Women who did not give birth in the past 12 months Now married:
34.7% (223,490)Unmarried:
65.3% (421,012)
Marital status - Black or African American population 15 years and over
Males 54.3% Never married32.5% Now married3.2% Separated2.5% Widowed7.5% DivorcedFemales 52.7% Never married23.9% Now married4.0% Separated8.2% Widowed11.2% DivorcedWomen who gave birth in the past 12 months Now married:
37.5% (7,977)Unmarried:
62.5% (13,297)
Women who did not give birth in the past 12 months Now married:
22.6% (98,864)Unmarried:
77.4% (338,430)
Marital status - American Indian / Alaska Native population 15 years and over
Males 52.9% Never married37.0% Now married1.4% Separated0.1% Widowed8.5% DivorcedFemales 45.5% Never married30.0% Now married5.6% Separated6.5% Widowed12.4% DivorcedWomen who gave birth in the past 12 months Now married:
69.4% (708)Unmarried:
30.6% (312)
Women who did not give birth in the past 12 months Now married:
33.7% (6,536)Unmarried:
66.3% (12,851)
Marital status - Asian population 15 years and over
Males 34.5% Never married58.1% Now married1.1% Separated1.8% Widowed4.6% DivorcedFemales 30.7% Never married52.8% Now married1.7% Separated7.9% Widowed6.8% DivorcedWomen who gave birth in the past 12 months Now married:
90.0% (14,435)Unmarried:
10.0% (1,606)
Women who did not give birth in the past 12 months Now married:
46.7% (145,841)Unmarried:
53.3% (166,349)
Marital status - Native Hawaiian / Pacific Islander population 15 years and over
Males 52.9% Never married40.0% Now married1.9% Separated0.7% Widowed4.6% DivorcedFemales 53.3% Never married25.8% Now married4.0% Separated9.1% Widowed7.7% DivorcedWomen who gave birth in the past 12 months Now married:
47.6% (106)Unmarried:
52.4% (117)
Women who did not give birth in the past 12 months Now married:
28.0% (418)Unmarried:
72.0% (1,072)
Marital status - Other race population 15 years and over
Males 49.0% Never married39.0% Now married3.1% Separated1.8% Widowed7.0% DivorcedFemales 44.4% Never married31.3% Now married6.3% Separated6.7% Widowed11.3% DivorcedWomen who gave birth in the past 12 months Now married:
48.1% (7,793)Unmarried:
51.9% (8,407)
Women who did not give birth in the past 12 months Now married:
31.7% (105,104)Unmarried:
68.3% (226,438)
Marital status - Two or more races population 15 years and over
Males 49.8% Never married39.0% Now married3.1% Separated1.9% Widowed6.2% DivorcedFemales 45.1% Never married32.2% Now married4.1% Separated7.0% Widowed11.6% DivorcedWomen who gave birth in the past 12 months Now married:
53.0% (8,099)Unmarried:
47.0% (7,186)
Women who did not give birth in the past 12 months Now married:
29.0% (69,094)Unmarried:
71.0% (168,801)
Marital status - White alone, not Hispanic / Latino population 15 years and over
Males 41.3% Never married48.9% Now married1.3% Separated2.1% Widowed6.4% DivorcedFemales 38.5% Never married42.7% Now married1.5% Separated8.5% Widowed8.8% DivorcedWomen who gave birth in the past 12 months Now married:
87.8% (26,878)Unmarried:
12.2% (3,749)
Women who did not give birth in the past 12 months Now married:
36.0% (209,900)Unmarried:
64.0% (373,921)
Marital status - Hispanic or Latino population 15 years and over
Males 50.7% Never married37.2% Now married3.1% Separated2.0% Widowed7.0% DivorcedFemales 45.3% Never married30.1% Now married5.7% Separated7.0% Widowed11.8% DivorcedWomen who gave birth in the past 12 months Now married:
48.1% (15,490)Unmarried:
51.9% (16,685)
Women who did not give birth in the past 12 months Now married:
29.5% (171,831)Unmarried:
70.5% (410,380)
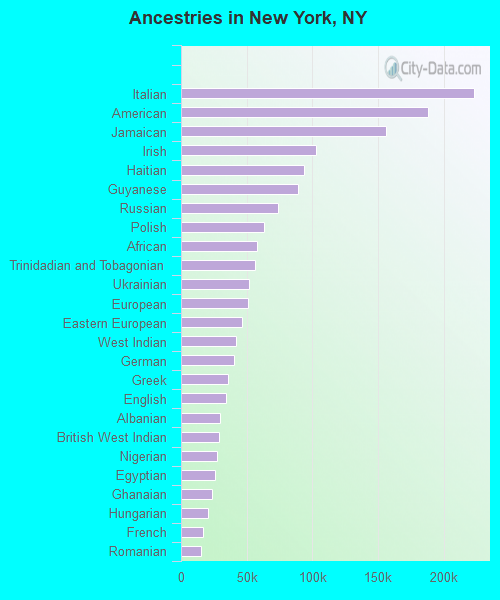
Ancestries in New York
223,388 4.2% Italian188,027 3.6% American156,460 3.0% Jamaican102,652 1.9% Irish93,599 1.8% Haitian89,335 1.7% Guyanese74,078 1.4% Russian62,917 1.2% Polish57,919 1.1% African56,578 1.1% Trinidadian and Tobagonian51,853 1.0% Ukrainian50,810 1.0% European46,340 0.9% Eastern European42,170 0.8% West Indian40,255 0.8% German36,007 0.7% Greek34,425 0.7% English30,026 0.6% Albanian29,005 0.5% British West Indian27,269 0.5% Nigerian25,797 0.5% Egyptian23,808 0.5% Ghanaian20,900 0.4% Hungarian16,797 0.3% French15,322 0.3% Romanian13,546 0.3% Barbadian13,006 0.2% Turkish10,524 0.2% Israeli9,240 0.2% Iranian9,029 0.2% British8,693 0.2% Armenian7,926 0.2% Moroccan7,724 0.1% Scottish7,570 0.1% Lebanese7,130 0.1% Brazilian7,115 0.1% Syrian6,582 0.1% Macedonian6,381 0.1% Belizean5,368 0.1% Arab5,171 0.10% Norwegian5,073 0.10% Ethiopian4,891 0.09% Senegalese4,771 0.09% Palestinian4,710 0.09% Lithuanian4,629 0.09% Afghan4,531 0.09% Portuguese4,264 0.08% Slavic4,156 0.08% Liberian3,952 0.07% Croatian3,787 0.07% Dutch3,525 0.07% Swedish3,519 0.07% Bulgarian3,055 0.06% Danish3,032 0.06% Slovak2,936 0.06% South African2,915 0.06% Serbian2,905 0.06% Austrian2,802 0.05% French Canadian2,474 0.05% Northern European2,207 0.04% Scotch-Irish1,953 0.04% Czech1,927 0.04% Yugoslavian1,894 0.04% Swiss1,686 0.03% Scandinavian1,679 0.03% Canadian1,626 0.03% Maltese1,500 0.03% Australian1,310 0.02% Belgian1,299 0.02% Kenyan1,296 0.02% U.S. Virgin Islander1,160 0.02% Latvian1,098 0.02% Jordanian1,064 0.02% Iraqi1,059 0.02% Welsh1,045 0.02% Sudanese971 0.02% Cape Verdean911 0.02% Sierra Leonean898 0.02% Icelander885 0.02% Dutch West Indian799 0.02% Czechoslovakian786 0.01% Finnish785 0.01% Cypriot518 0.01% Soviet Union496 0.01% Somali468 0.01% Bahamian428 0.01% Zimbabwean366 0.01% Assyrian328 0.01% Celtic301 0.01% Estonian275 0.01% Basque
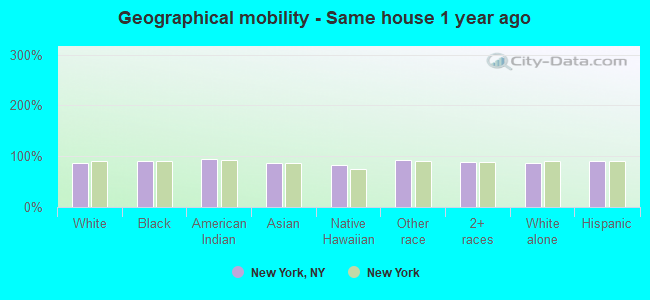
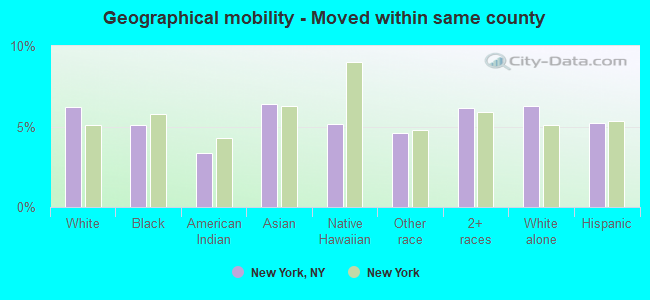
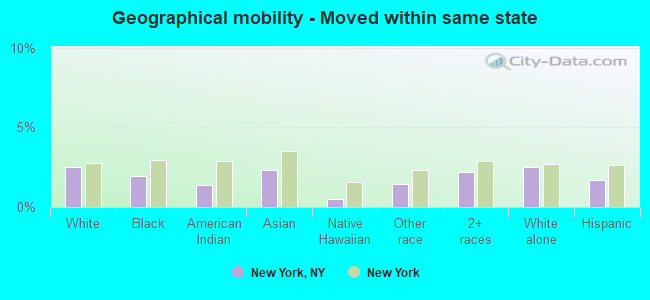
Geographical mobility in New York Same house 1 year ago 2,396,458 87.2% White (Caucasian)1,651,643 91.4% Black or African American66,496 94.5% American Indian / Alaska Native1,076,939 87.6% Asian4,269 82.0% Native Hawaiian / Pacific Islander1,272,560 92.3% Other race893,987 88.9% Two or more races2,187,710 87.0% White alone, not Hispanic / Latino2,179,989 91.1% Hispanic or LatinoMoved within same county 171,032 6.2% White / Caucasian92,374 5.1% Black or African American2,345 3.3% American Indian / Alaska Native78,786 6.4% Asian268 5.1% Native Hawaiian / Pacific Islander62,980 4.6% Other race61,686 6.1% Two or more races157,147 6.3% White alone, not Hispanic / Latino124,311 5.2% Hispanic or LatinoMoved within same state 68,415 2.5% White / Caucasian35,464 2.0% Black or African American957 1.4% American Indian / Alaska Native28,655 2.3% Asian25 0.5% Native Hawaiian / Pacific Islander20,000 1.5% Other race22,324 2.2% Two or more races63,809 2.5% White alone, not Hispanic / Latino39,813 1.7% Hispanic or LatinoMoved from different state 81,959 3.0% White / Caucasian18,529 1.0% Black or African American327 0.5% American Indian / Alaska Native23,917 1.9% Asian129 2.5% Native Hawaiian / Pacific Islander7,576 0.5% Other race15,692 1.6% Two or more races78,363 3.1% White alone, not Hispanic / Latino19,852 0.8% Hispanic or LatinoMoved from abroad 28,959 1.1% White8,390 0.5% Black or African American268 0.4% American Indian / Alaska Native20,806 1.7% Asian110 2.1% Native Hawaiian / Pacific Islander15,488 1.1% Other race11,823 1.2% Two or more races27,191 1.1% White alone, not Hispanic / Latino27,726 1.2% Hispanic or Latino
Children Nativity (place of birth) in New York
Children under 6 years - Living with two parents Both parents native 138,726 100.0% NativeBoth parents foreign-born 117,341 93.5% Native8,121 6.5% Foreign-bornOne native, one foreign-born parent 64,184 99.9% Native92 0.1% Foreign-bornChildren under 6 years - Living with one parent Native parent 121,195 99.5% Native555 0.5% Foreign-bornForeign-born parent 73,132 92.9% Native5,551 7.1% Foreign-bornChildren 6 to 17 years - Living with two parents Both parents native 208,440 99.8% Native396 0.2% Foreign-bornBoth parents foreign-born 233,805 80.2% Native57,648 19.8% Foreign-bornOne native, one foreign-born parent 96,828 96.8% Native3,212 3.2% Foreign-bornChildren 6 to 17 years - Living with one parent Native parent 173,843 100.0% NativeForeign-born parent 234,898 56.2% Native183,365 43.8% Foreign-born
Place of birth for residents in New York 1,545,741 Americas1,519,424 Latin America928,100 Asia811,465 Caribbean467,044 Eastern Asia426,304 South America408,648 Europe397,894 China281,655 Central America275,405 South Central Asia242,759 Eastern Europe173,224 Africa105,597 Western Africa100,586 South Eastern Asia80,285 Western Asia69,416 Southern Europe47,054 Northern Europe46,350 Western Europe36,723 Northern Africa26,317 Northern America13,264 Eastern Africa9,423 Oceania8,046 Australia and New Zealand Subregion5,251 Middle Africa4,927 Southern Africa419,526 Dominican Republic347,231 China166,670 Mexico151,559 Jamaica137,769 Guyana121,999 Ecuador97,506 Bangladesh78,316 Haiti78,001 Colombia72,125 Trinidad and Tobago68,805 India65,719 Ukraine53,997 Philippines50,825 Korea48,411 Russia37,156 Pakistan36,874 Italy33,683 Ghana31,507 Poland31,390 Hong Kong30,874 Guatemala28,644 Peru28,516 Uzbekistan27,886 Honduras27,014 El Salvador26,110 Canada23,187 Nigeria20,677 Egypt20,054 France19,273 Taiwan19,250 Israel18,451 Albania18,207 Japan17,663 Greece17,565 Barbados17,537 Venezuela16,939 United Kingdom16,716 Grenada15,640 Germany14,479 Vietnam14,318 Brazil13,813 Belarus12,865 Georgia12,802 Nepal12,527 Panama11,683 Spain11,215 Ireland10,541 Turkey10,288 England10,176 St. Vincent and the Grenadines10,072 Cuba10,049 Yemen9,734 Argentina9,570 St. Lucia8,753 Senegal8,331 Romania8,307 Ivory Coast7,792 Kazakhstan7,297 Morocco7,276 Australia7,120 Malaysia7,014 Indonesia6,816 Syria6,728 Burma (Myanmar)6,517 Belize6,306 West Indies6,212 Thailand5,848 Lebanon5,794 Hungary5,772 Iran5,727 Chile5,603 Nicaragua5,471 Dominica5,130 Moldova4,927 South Africa4,693 Sri Lanka4,564 Costa Rica4,546 Afghanistan4,398 Bulgaria4,397 Togo4,364 Ethiopia4,228 Armenia3,806 Czechoslovakia3,786 Uruguay3,140 Azerbaijan3,092 Netherlands2,985 Algeria2,956 Liberia2,913 Croatia2,834 Switzerland2,796 Sierra Leone2,694 Norway2,684 Serbia2,410 Singapore2,409 Sudan2,332 Belgium2,264 Austria2,183 Cambodia2,072 Bolivia2,063 Portugal2,050 Sweden2,041 Congo1,945 Bosnia and Herzegovina1,832 Jordan1,817 Denmark1,782 Lithuania1,760 Kenya1,704 Cameroon1,583 North Macedonia (Macedonia)1,317 Democratic Republic of Congo (Zaire)1,289 Kuwait1,178 Saudi Arabia1,172 Latvia1,131 Bahamas988 United Arab Emirates810 Eritrea779 Scotland770 New Zealand737 Tanzania583 Zimbabwe556 Somalia422 Bhutan391 Iraq353 Cabo Verde225 Uganda181 Laos
Grandparents responsible for own grandchildren in New York
Grandparents (30 to 59 years) White / Caucasian 2,305 32.2% Responsible for grandchildren4,855 67.8% Not responsible for grandchildrenBlack or African American 4,787 31.4% Responsible for grandchildren10,446 68.6% Not responsible for grandchildrenAmerican Indian / Alaska Native 901 46.7% Responsible for grandchildren1,029 53.3% Not responsible for grandchildrenAsian 1,350 17.6% Responsible for grandchildren6,334 82.4% Not responsible for grandchildrenNative Hawaiian / Pacific Islander 68 49.3% Responsible for grandchildren70 50.7% Not responsible for grandchildrenOther race 6,248 29.6% Responsible for grandchildren14,856 70.4% Not responsible for grandchildrenTwo or more races 1,371 24.0% Responsible for grandchildren4,350 76.0% Not responsible for grandchildrenWhite alone, not Hispanic / Latino 1,565 29.5% Responsible for grandchildren3,734 70.5% Not responsible for grandchildrenHispanic or Latino 9,221 31.8% Responsible for grandchildren19,751 68.2% Not responsible for grandchildrenGrandparents (60 years and over) White / Caucasian 2,999 13.0% Responsible for grandchildren20,076 87.0% Not responsible for grandchildrenBlack or African American 7,956 23.2% Responsible for grandchildren26,302 76.8% Not responsible for grandchildrenAmerican Indian / Alaska Native 1,055 100.0% Not responsible for grandchildrenAsian 4,389 14.3% Responsible for grandchildren26,393 85.7% Not responsible for grandchildrenNative Hawaiian / Pacific Islander 11 100.0% Not responsible for grandchildrenOther race 3,322 13.7% Responsible for grandchildren20,916 86.3% Not responsible for grandchildrenTwo or more races 5,015 31.4% Responsible for grandchildren10,941 68.6% Not responsible for grandchildrenWhite alone, not Hispanic / Latino 2,610 13.4% Responsible for grandchildren16,887 86.6% Not responsible for grandchildrenHispanic or Latino 6,824 17.3% Responsible for grandchildren32,694 82.7% Not responsible for grandchildren
Zip codes: 10001 , 10002 , 10003 , 10004 , 10005 , 10006 , 10007 , 10009 , 10010 , 10011 , 10012 , 10013 , 10014 , 10016 , 10017 , 10018 , 10019 , 10020, 10021 , 10022 , 10023 , 10024 , 10025 , 10026 , 10027 , 10028 , 10029 , 10030 , 10031 , 10032 , 10033 , 10034 , 10035 , 10036 , 10037 , 10038 , 10039 , 10040 , 10044 , 10065 , 10069 , 10075 , 10103, 10110, 10111, 10112, 10115, 10119, 10128 , 10152, 10153, 10154, 10162 , 10165, 10167, 10168, 10169, 10170, 10171, 10172, 10173, 10174, 10177, 10199, 10271, 10278, 10279, 10280 , 10282 , 10301 , 10302 , 10303 , 10304 , 10305 , 10306 , 10307 , 10308 , 10309 , 10310 , 10311, 10312 , 10314 , 10451 , 10452 , 10453 , 10454 , 10455 , 10456 , 10457 , 10458 , 10459 , 10460 , 10461 , 10462 , 10463 , 10464 , 10465 , 10466 , 10467 , 10468 , 10469 , 10470 , 10471 , 10472 , 10473 , 10474 , 10475 , 11004 , 11005 , 11101 , 11102 , 11103 , 11104 , 11105 , 11106 , 11109 , 11201 , 11203 , 11204 , 11205 , 11206 , 11207 , 11208 , 11209 , 11210 , 11211 , 11212 , 11213 , 11214 , 11215 , 11216 , 11217 , 11218 , 11219 , 11220 , 11221 , 11222 , 11223 , 11224 , 11225 , 11226 , 11228 , 11229 , 11230 , 11231 , 11232 , 11233 , 11234 , 11235 , 11236 , 11237 , 11238 , 11239 , 11351, 11354 , 11355 , 11356 , 11357 , 11358 , 11359, 11360 , 11361 , 11362 , 11363 , 11364 , 11365 , 11366 , 11367 , 11368 , 11369 , 11370 , 11371, 11372 , 11373 , 11374 , 11375 , 11377 , 11378 , 11379 , 11385 , 11411 , 11412 , 11413 , 11414 , 11415 , 11416 , 11417 , 11418 , 11419 , 11420 , 11421 , 11422 , 11423 , 11424, 11425, 11426 , 11427 , 11428 , 11429 , 11430 , 11432 , 11433 , 11434 , 11435 , 11436 , 11451, 11691 , 11692 , 11693 , 11694 , 11697 .