Estimated zip code population in 2022: 61,778 Zip code population in 2010: 59,283 Zip code population in 2000: 61,414
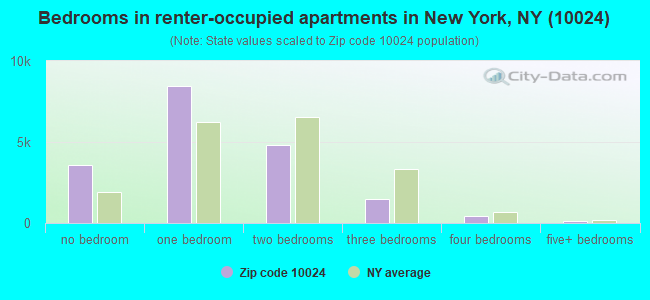
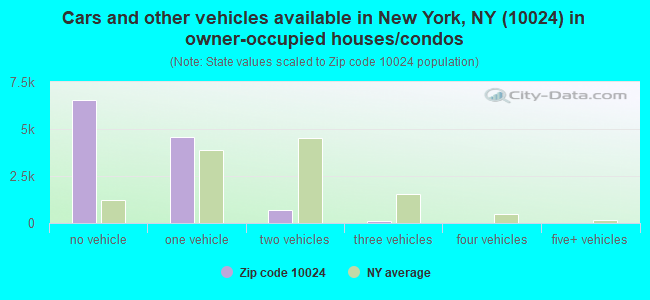
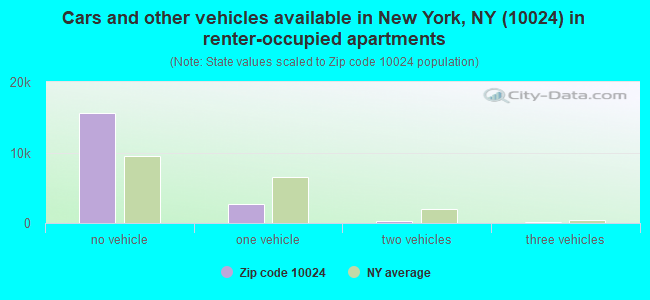
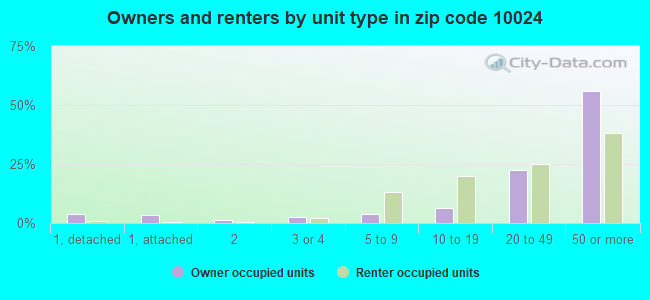
Houses and condos: 36,714 Renter-occupied apartments: 18,667
% of renters here:
62%
State:
46%
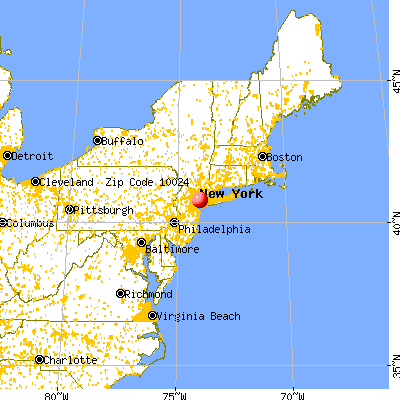
March 2022 cost of living index in zip code 10024: 157.8 (very high, U.S. average is 100)
Land area: 0.9 sq. mi. Water area: 0.0 sq. mi.
Population density: 72,015 people per square mile
(very high).
OSM Map
General Map
Google Map
MSN Map
OSM Map
General Map
Google Map
MSN Map
OSM Map
General Map
Google Map
MSN Map
OSM Map
General Map
Google Map
MSN Map
Please wait while loading the map...
Real estate property taxes paid for housing units in 2022:
This zip code:
0.5% ($9,805)
New York:
1.5% ($6,180)
Median real estate property taxes paid for housing units with mortgages in 2022: $9,858 (0.5%) Median real estate property taxes paid for housing units with no mortgage in 2022: $9,755 (0.6%)
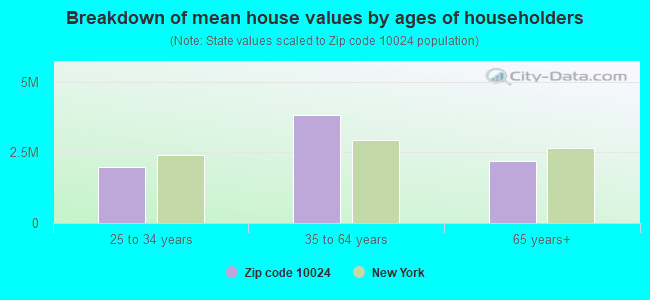
Estimated median house/condo value in 2022: $1,817,697
10024:
$1,817,697
New York:
$400,400
According to our research of New York and other state lists, there were 2 registered sex offenders living in 10024 zip code as of April 27, 2024. The ratio of all residents to sex offenders in zip code 10024 is 29,678 to 1. The ratio of registered sex offenders to all residents in this zip code is much lower than the state average.
Median resident age:
This zip code:
43.9 years
New York median age:
40.0 years
Average household size:
This zip code:
2.0 people
New York:
2.5 people
Averages for the 2020 tax year for zip code 10024, filed in 2021:
Average Adjusted Gross Income (AGI) in 2020: $395,409 (Individual Income Tax Returns)
Here:
$395,409
State:
$90,930
Salary/wage: $247,674 (reported on 74.4% of returns)
Here:
$247,674
State:
$72,104
(% of AGI for various income ranges: 916.8% for AGIs below $25k, 3600.5% for AGIs $25k-50k, 6680.5% for AGIs $50k-75k, 10657.2% for AGIs $75k-100k, 20855.2% for AGIs $100k-200k, 252514.6% for AGIs over 200k)
Taxable interest for individuals: $14,915 (reported on 58.3% of returns)
This zip code:
$14,915
New York:
$3,075
(% of AGI for various income ranges: 63.6% for AGIs below $25k, 78.0% for AGIs $25k-50k, 83.1% for AGIs $50k-75k, 218.7% for AGIs $75k-100k, 360.9% for AGIs $100k-200k, 13461.9% for AGIs over 200k)
Ordinary dividends: $34,812 (reported on 57.5% of returns)
Here:
$34,812
State:
$11,095
(% of AGI for various income ranges: 253.3% for AGIs below $25k, 339.5% for AGIs $25k-50k, 451.2% for AGIs $50k-75k, 787.7% for AGIs $75k-100k, 1622.0% for AGIs $100k-200k, 28919.9% for AGIs over 200k)
Net capital gain/loss in AGI: +$169,065 (reported on 53.8% of returns)
Here:
+$169,065
State:
+$44,925
(% of AGI for various income ranges: 112.4% for AGIs below $25k, 242.5% for AGIs $25k-50k, 457.2% for AGIs $50k-75k, 612.3% for AGIs $75k-100k, 1599.8% for AGIs $100k-200k, 147764.6% for AGIs over 200k)
Profit/loss from business: +$43,965 (reported on 24.1% of returns)
Here:
+$43,965
State:
+$14,940
(% of AGI for various income ranges: 230.2% for AGIs below $25k, 395.1% for AGIs $25k-50k, 545.1% for AGIs $50k-75k, 713.2% for AGIs $75k-100k, 1475.5% for AGIs $100k-200k, 13305.2% for AGIs over 200k)
Taxable individual retirement arrangement distribution: $38,646 (reported on 12.3% of returns)
10024:
$38,646
New York:
$19,609
(% of AGI for various income ranges: 93.1% for AGIs below $25k, 195.4% for AGIs $25k-50k, 313.9% for AGIs $50k-75k, 488.4% for AGIs $75k-100k, 1129.8% for AGIs $100k-200k, 5001.5% for AGIs over 200k)
Self-employed (Keogh) retirement plans: $43,676 (reported on 5.6% of returns)
10024:
$43,676
New York:
$32,497
(% of AGI for various income ranges: 8.2% for AGIs below $25k, 16.0% for AGIs $25k-50k, 47.8% for AGIs $50k-75k, 88.6% for AGIs $75k-100k, 206.3% for AGIs $100k-200k, 3576.8% for AGIs over 200k)
Total itemized deductions: $98,870 (reported on 28.0% of returns)
Here:
$98,870
State:
$39,326
(% of AGI for various income ranges: 306.4% for AGIs below $25k, 488.8% for AGIs $25k-50k, 592.1% for AGIs $50k-75k, 948.3% for AGIs $75k-100k, 1991.7% for AGIs $100k-200k, 40600.6% for AGIs over 200k)
Charity contributions: $71,097 (reported on 25.5% of returns)
Here:
$71,097
State:
$15,420
(% of AGI for various income ranges: 16.7% for AGIs below $25k, 48.3% for AGIs $25k-50k, 74.6% for AGIs $50k-75k, 166.8% for AGIs $75k-100k, 422.6% for AGIs $100k-200k, 29229.6% for AGIs over 200k)
Taxes paid: $10,052 (reported on 28.0% of returns)
10024:
$10,052
State:
$9,183
(% of AGI for various income ranges: 76.8% for AGIs below $25k, 132.6% for AGIs $25k-50k, 159.0% for AGIs $50k-75k, 282.9% for AGIs $75k-100k, 589.5% for AGIs $100k-200k, 3079.7% for AGIs over 200k)
Earned income credit: $1,190 (reported on 4.1% of returns)
Here:
$1,190
State:
$2,138
(% of AGI for various income ranges: 39.2% for AGIs below $25k, 19.0% for AGIs $25k-50k)
Percentage of individuals using paid preparers for their 2020 taxes: 94.6%
Here:
95%
State:
95%
(% for various income ranges: 91.5% for AGIs below $25k, 93.5% for AGIs $25k-50k, 94.8% for AGIs $50k-75k, 95.6% for AGIs $75k-100k, 95.1% for AGIs $100k-200k, 96.2% for AGIs over 200k)
Averages for the 2012 tax year for zip code 10024, filed in 2013:
Average Adjusted Gross Income (AGI) in 2012: $303,191 (Individual Income Tax Returns)
Here:
$303,191
State:
$77,088
Salary/wage: $201,194 (reported on 76.4% of returns)
Here:
$201,194
State:
$60,593
(% of AGI for various income ranges: 56.0% for AGIs below $25k, 70.4% for AGIs $25k-50k, 72.3% for AGIs $50k-75k, 71.4% for AGIs $75k-100k, 69.9% for AGIs $100k-200k, 47.0% for AGIs over 200k)
Taxable interest for individuals: $10,219 (reported on 62.5% of returns)
This zip code:
$10,219
New York:
$3,125
(% of AGI for various income ranges: 4.2% for AGIs below $25k, 1.7% for AGIs $25k-50k, 1.3% for AGIs $50k-75k, 1.2% for AGIs $75k-100k, 1.3% for AGIs $100k-200k, 2.2% for AGIs over 200k)
Ordinary dividends: $29,351 (reported on 53.5% of returns)
Here:
$29,351
State:
$10,299
(% of AGI for various income ranges: 11.9% for AGIs below $25k, 4.7% for AGIs $25k-50k, 4.0% for AGIs $50k-75k, 3.8% for AGIs $75k-100k, 4.5% for AGIs $100k-200k, 5.3% for AGIs over 200k)
Net capital gain/loss in AGI: +$116,866 (reported on 48.5% of returns)
Here:
+$116,866
State:
+$42,474
(% of AGI for various income ranges: 1.5% for AGIs below $25k, 1.6% for AGIs $25k-50k, 1.5% for AGIs $50k-75k, 1.6% for AGIs $75k-100k, 2.8% for AGIs $100k-200k, 21.9% for AGIs over 200k)
Profit/loss from business: +$39,859 (reported on 25.5% of returns)
Here:
+$39,859
State:
+$16,168
(% of AGI for various income ranges: 17.4% for AGIs below $25k, 9.6% for AGIs $25k-50k, 7.6% for AGIs $50k-75k, 6.1% for AGIs $75k-100k, 6.1% for AGIs $100k-200k, 2.6% for AGIs over 200k)
Taxable individual retirement arrangement distribution: $41,362 (reported on 13.5% of returns)
10024:
$41,362
New York:
$17,621
(% of AGI for various income ranges: 5.6% for AGIs below $25k, 3.3% for AGIs $25k-50k, 2.9% for AGIs $50k-75k, 3.4% for AGIs $75k-100k, 4.0% for AGIs $100k-200k, 1.5% for AGIs over 200k)
Self-employment retirement plans: $36,667 (reported on 5.9% of returns)
10024:
$36,667
New York:
$27,330
(% of AGI for various income ranges: 0.7% for AGIs $25k-50k, 0.6% for AGIs $50k-75k, 0.8% for AGIs $75k-100k, 0.8% for AGIs $100k-200k, 0.7% for AGIs over 200k)
Total itemized deductions: $93,558 (20% of AGI, reported on 62.2% of returns)
Here:
$93,558
State:
$34,985
Here:
20.1% of AGI
State:
21.3% of AGI
(% of AGI for various income ranges: 25.0% for AGIs below $25k, 15.2% for AGIs $25k-50k, 15.3% for AGIs $50k-75k, 17.7% for AGIs $75k-100k, 19.6% for AGIs $100k-200k, 19.4% for AGIs over 200k)
Charity contributions: $22,972 (reported on 53.5% of returns)
Here:
$22,972
State:
$5,572
(% of AGI for various income ranges: 1.4% for AGIs below $25k, 1.5% for AGIs $25k-50k, 1.6% for AGIs $50k-75k, 1.8% for AGIs $75k-100k, 2.1% for AGIs $100k-200k, 4.5% for AGIs over 200k)
Taxes paid: $57,499 (reported on 62.0% of returns)
10024:
$57,499
State:
$18,656
(% of AGI for various income ranges: 7.9% for AGIs below $25k, 4.9% for AGIs $25k-50k, 6.7% for AGIs $50k-75k, 9.2% for AGIs $75k-100k, 11.1% for AGIs $100k-200k, 12.2% for AGIs over 200k)
Earned income credit: $1,321 (reported on 5.3% of returns)
Here:
$1,321
State:
$2,230
(% of AGI for various income ranges: 2.5% for AGIs below $25k, 0.2% for AGIs $25k-50k)
Percentage of individuals using paid preparers for their 2012 taxes: 69.9%
Here:
70%
State:
66%
(% for various income ranges: 65.4% for AGIs below $25k, 63.3% for AGIs $25k-50k, 62.4% for AGIs $50k-75k, 65.0% for AGIs $75k-100k, 71.0% for AGIs $100k-200k, 82.9% for AGIs over 200k)
Averages for the 2004 tax year for zip code 10024, filed in 2005:
Average Adjusted Gross Income (AGI) in 2004: $205,859 (Individual Income Tax Returns)
Here:
$205,859
State:
$59,519
Salary/wage: $160,544 (reported on 77.0% of returns)
Here:
$160,544
State:
$50,673
(% of AGI for various income ranges: 62.2% for AGIs $10k-25k, 77.3% for AGIs $25k-50k, 77.1% for AGIs $50k-75k, 75.0% for AGIs $75k-100k, 57.0% for AGIs over 100k)
Taxable interest for individuals: $8,556 (reported on 69.8% of returns)
This zip code:
$8,556
New York:
$2,377
(% of AGI for various income ranges: 5.5% for AGIs $10k-25k, 2.4% for AGIs $25k-50k, 2.1% for AGIs $50k-75k, 2.0% for AGIs $75k-100k, 2.8% for AGIs over 100k)
Taxable dividends: $13,717 (reported on 55.4% of returns)
Here:
$13,717
State:
$5,394
(% of AGI for various income ranges: 6.0% for AGIs $10k-25k, 3.6% for AGIs $25k-50k, 3.1% for AGIs $50k-75k, 3.3% for AGIs $75k-100k, 3.6% for AGIs over 100k)
Net capital gain/loss: +$73,533 (reported on 49.5% of returns)
Here:
+$73,533
State:
+$23,581
(% of AGI for various income ranges: 1.3% for AGIs $10k-25k, 1.2% for AGIs $25k-50k, 1.4% for AGIs $50k-75k, 1.9% for AGIs $75k-100k, 19.5% for AGIs over 100k)
Profit/loss from business: +$29,838 (reported on 25.7% of returns)
Here:
+$29,838
State:
+$13,809
(% of AGI for various income ranges: 15.9% for AGIs $10k-25k, 8.3% for AGIs $25k-50k, 6.1% for AGIs $50k-75k, 5.9% for AGIs $75k-100k, 3.2% for AGIs over 100k)
Profit/loss from farming: +$769 (reported on 0.0% of returns)
Here:
+$769
State:
-$2,666
IRA payment deduction: $3,242 (reported on 3.9% of returns)
10024:
$3,242
New York:
$3,115
(% of AGI for various income ranges: 0.8% for AGIs $10k-25k, 0.5% for AGIs $25k-50k, 0.2% for AGIs $50k-75k, 0.2% for AGIs $75k-100k, 0.0% for AGIs over 100k)
Self-employed pension: $23,401 (reported on 6.3% of returns)
Here:
$23,401
New York:
$19,016
(% of AGI for various income ranges: 0.6% for AGIs $10k-25k, 0.6% for AGIs $25k-50k, 0.6% for AGIs $50k-75k, 0.8% for AGIs $75k-100k, 0.7% for AGIs over 100k)
Total itemized deductions: $58,449 (18% of AGI, reported on 60.9% of returns)
Here:
$58,449
State:
$25,864
Here:
17.9% of AGI
State:
21.9% of AGI
(% of AGI for various income ranges: 22.1% for AGIs $10k-25k, 15.2% for AGIs $25k-50k, 18.0% for AGIs $50k-75k, 19.0% for AGIs $75k-100k, 16.9% for AGIs over 100k)
Charity contributions deductions: $13,306 (4% of AGI, reported on 55.7% of returns)
Here:
$13,306
State:
$4,439
Here:
3.8% of AGI
State:
3.6% of AGI
(% of AGI for various income ranges: 1.9% for AGIs $10k-25k, 1.9% for AGIs $25k-50k, 2.3% for AGIs $50k-75k, 2.4% for AGIs $75k-100k, 3.7% for AGIs over 100k)
Total tax: $52,902 (reported on 87.2% of returns)
10024:
$52,902
State:
$11,730
(% of AGI for various income ranges: 6.6% for AGIs $10k-25k, 9.9% for AGIs $25k-50k, 13.1% for AGIs $50k-75k, 14.6% for AGIs $75k-100k, 23.4% for AGIs over 100k)
Earned income credit: $1,014 (reported on 4.9% of returns)
Here:
$1,014
State:
$1,757
Percentage of individuals using paid preparers for their 2004 taxes: 72.2%
Here:
72%
State:
67%
(% for various income ranges: 70.1% for AGIs below $10k, 67.7% for AGIs $10k-25k, 64.9% for AGIs $25k-50k, 67.8% for AGIs $50k-75k, 71.9% for AGIs $75k-100k, 80.2% for AGIs over 100k)
Likely homosexual households (counted as self-reported same-sex unmarried-partner households)
Lesbian couples: 0.4% of all households
Gay men: 0.8% of all households
Household received Food Stamps/SNAP in the past 12 months: 1,235 Household did not receive Food Stamps/SNAP in the past 12 months: 28,464
Women who had a birth in the past 12 months: 1,621 (1,516 now married, 83 unmarried) Women who did not have a birth in the past 12 months: 13,849 (5,917 now married, 7,889 unmarried)
Housing units in zip code 10024 with a mortgage: 5,456 (546 second mortgage, 508 both second mortgage and home equity loan) Houses without a mortgage: 146
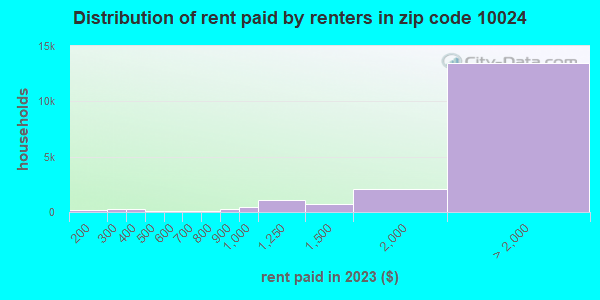
Median monthly owner costs for units with a mortgage: $3,860 Median monthly owner costs for units without a mortgage: $1,487
Residents with income below the poverty level in 2022:
This zip code:
8.9%
Whole state:
14.3%
Residents with income below 50% of the poverty level in 2022:
This zip code:
3.4%
Whole state:
6.8%
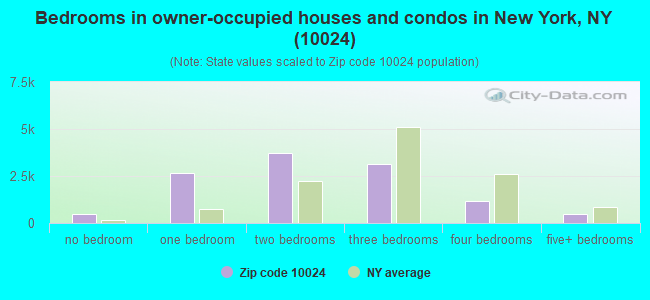
Median number of rooms in houses and condos:
Here:
4.8
State:
6.3
Median number of rooms in apartments:
Here:
3.1
State:
3.8
Notable locations in this zip code not listed on our city pages
Notable locations in zip code 10024: Henry Hudson Parkway (A), Twentieth Precinct Police Station (B), Glenn Gardens (C), Rossleigh Court (D), Astor Court Apartments (E), The Cornwall (F), The Red House (G), The Beresford (H), New York Historical Society (I), Belnord Apartments (J), The Packard (K), The Brockholst (L), Hayden House (M), Fire Department New York Ladder 25 Division 3 (N), Broadway Fashion Building (O), The Bromley (P), Endicott Apartments (Q), The Broadway (R), Phoenix House (S), Park Belvedere (T). Display/hide their locations on the map
Churches in zip code 10024 include: Congregation Rodeph Sholom (A), West - Park Presbyterian Church (B), Greek Orthodox Cathedral Church of the Annunciation (C), Congregation B'nai Jeshurun (D), Saint Ignatius Episcopal Church (E), Church of Saint Paul and Saint Andrew (F), West End Collegiate Church (G), Saints Matthew And Timothy Episcopal Church (H), Saint Volodymyr Ukrainian Orthodox Church (I). Display/hide their locations on the map
Parks in zip code 10024 include: Tecumseh Playground (1), Sailors and Soldiers Monument (2), Riverside Park (3), Theodore Roosevelt Memorial (4), Riverside-West End Historic District (5), Riverside Drive-West 80th Street Historic District (6), Saint Gregory's Park (7), Eightyninth Street Playground (8), West 87th Street Garden (9). Display/hide their locations on the map
Tourist attractions (not listed on the city page) : New-York Historical Society (Art Museums; 170 Central Park West), Culture Center (Cultural Attractions- Events- & Facilities; 410 Columbus Avenue).
8,435 married couples with children.
1,373 single-parent households (414 men, 959 women).
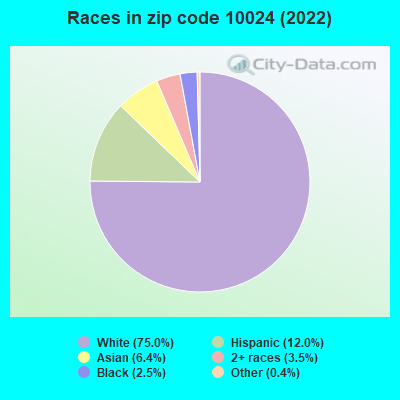
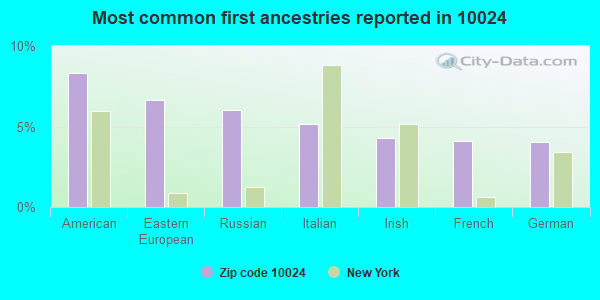
75.5% of residents of 10024 zip code speak English at home.
10.2% of residents speak Spanish at home (66% very well, 13% well, 11% not well, 10% not at all).
10.3% of residents speak other Indo-European language at home (90% very well, 8% well, 1% not well, 2% not at all).
2.7% of residents speak Asian or Pacific Island language at home (72% very well, 16% well, 11% not well, 2% not at all).
1.5% of residents speak other language at home (99% very well, 1% well).
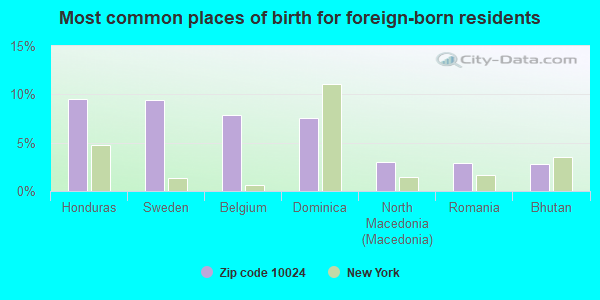
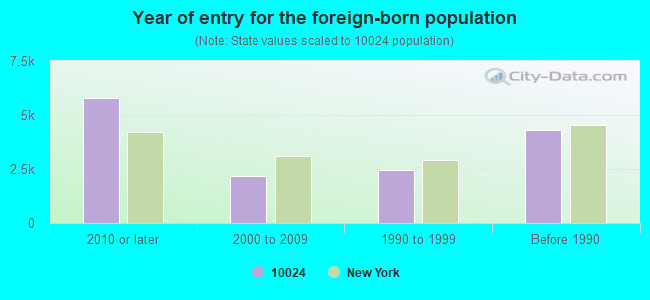
Foreign born population: 13,225 (21.4%) (46.5% of them are naturalized citizens)
Major facilities with environmental interests located in this zip code:
AMERICAN MUSEUM OF NATURAL HISTORY (CENTRAL PARK WEST AT 79TH STREET in NEW YORK, NY)
(Integrated Compliance Information System) - ICIS-02-2002-0013, FORMAL ENFORCEMENT ACTION, ICIS-02-2003-1003, HAZARDOUS WASTE BIENNIAL REPORTER (Resource Conservation and Recovery Act (tracking hazardous waste)) Large Quantity Generators, more that 1000 kg of hazardous waste/month (Resource Conservation and Recovery Act (tracking hazardous waste)) Business SIC classification: MUSEUMS AND ART GALLERIES Alternative names: AMERICAN MUSEUM OF NAT HISTORY
600 COLUMBUS AVE BUILDING (600 COLUMBUS AVENUE in NEW YORK CITY, NY)
AIR SYNTHETIC MINOR (AIRS/AFS) STATE MASTER (New York facility tracking) - AIR PROGRAM Business SIC classification: OPERATORS OF APARTMENT BUILDINGS Business NAICS classification: LESSORS OF RESIDENTIAL BUILDINGS AND DWELLINGS. Organizations: GRENADIER REALTY CORP (AIR PERMIT CONTACT)
, STARRETT SERVICE HOUSING CO (LEGALLY RESPONSIBLE PARTY)
Alternative names: COLUMBUS TOWNHOUSE ASSOCIATES
CLIFTON HOUSE OWNERS CORP (127 W 79TH ST in NEW YORK, NY)
AIR MINOR (AIRS/AFS) STATE MASTER (New York facility tracking) - AIR PROGRAM Business SIC classification: OPERATORS OF APARTMENT BUILDINGS Organizations: ARGO CORP (LEGALLY RESPONSIBLE PARTY)
CHESTERFIELD CLEANERS (409 AMSTERDAM AVE. in NEW YORK, NY)
AIR MINOR (AIRS/AFS) STATE MASTER (New York facility tracking) - AIR PROGRAM, HAZARDOUS WASTE PROGRAM Small Quantity Generators, between 100 kg and 1000 kg of hazardous waste/month (Resource Conservation and Recovery Act (tracking hazardous waste)) Business SIC classification: DRYCLEANING PLANTS, EXCEPT RUG CLEANING Business NAICS classification: DRYCLEANING AND LAUNDRY SERVICES (EXCEPT COIN-OPERATED). Organizations: CHESTERFIELD CLEANERS CO INC (LEGALLY RESPONSIBLE PARTY)
470 WEST END AVE BUILDING (470 WEST END AVE in NEW YORK, NY)
AIR MINOR (AIRS/AFS) STATE MASTER (New York facility tracking) - AIR FACILITY REGISTRATION, AIR PROGRAM Business SIC classification: OPERATORS OF APARTMENT BUILDINGS Organizations: CENTURY OPERATING CORP, 470 WEST END CORP
216 WEST 89TH STREET (216 WEST 89TH STREET in NEW YORK CITY, NY)
AIR SYNTHETIC MINOR (AIRS/AFS) STATE MASTER (New York facility tracking) - AIR PROGRAM Business SIC classification: OPERATORS OF APARTMENT BUILDINGS Business NAICS classification: LESSORS OF RESIDENTIAL BUILDINGS AND DWELLINGS. Organizations: HELMSLEY-SPEAR INC, ME & A REALTY CO LLC (LEGALLY RESPONSIBLE PARTY)
302 WEST 86TH STREET TENANTS CORP (302 WEST 86TH ST in MANHATTAN, NY)
AIR MINOR (AIRS/AFS) STATE MASTER (New York facility tracking) - AIR PROGRAM Business SIC classification: OPERATORS OF APARTMENT BUILDINGS
BERESFORD APT INC (211 CENTRAL PARK W in NEW YORK CITY, NY)
AIR SYNTHETIC MINOR (AIRS/AFS) STATE MASTER (New York facility tracking) - AIR PROGRAM CRITERIA AND HAZARDOUS AIR POLLUTANT INVENTORY (Inventory of air pollution sources) Business SIC classification: OPERATORS OF APARTMENT BUILDINGS; OPERATORS OF DWELLINGS OTHER THAN APARTMENT BUILDINGS
441 WEST END AVE BUILDING (441 WEST END AVE in NEW YORK, NY)
AIR SYNTHETIC MINOR (AIRS/AFS) STATE MASTER (New York facility tracking) - AIR PROGRAM Business SIC classification: OPERATORS OF APARTMENT BUILDINGS; OPERATORS OF DWELLINGS OTHER THAN APARTMENT BUILDINGS Organizations: LYNDONVILLE PROPERTIES, ARNAV INDUSTRIES INC
54 RIVERSIDE DRIVE BUILDING (54 RIVERSIDE DRIVE in NEW YORK CITY, NY)
AIR SYNTHETIC MINOR (AIRS/AFS) STATE MASTER (New York facility tracking) - AIR PROGRAM Business SIC classification: OPERATORS OF APARTMENT BUILDINGS Business NAICS classification: LESSORS OF RESIDENTIAL BUILDINGS AND DWELLINGS. Organizations: 54 RIVERSIDE DRIVE CORP (LEGALLY RESPONSIBLE PARTY)
Alternative names: 54 RIVERSIDE DR BUCHBINDER
225 CENTRAL PARK WEST BUILDING (225 CENTRAL PARK WEST in NEW YORK CITY, NY)
AIR SYNTHETIC MINOR (AIRS/AFS) STATE MASTER (New York facility tracking) - AIR PROGRAM Business SIC classification: OPERATORS OF APARTMENT BUILDINGS Business NAICS classification: LESSORS OF RESIDENTIAL BUILDINGS AND DWELLINGS. Organizations: ALDEN OWNERS INC (LEGALLY RESPONSIBLE PARTY)
300 CENTRAL PARK WEST APARTMENT (300 CENTRAL PARK WEST in NEW YORK CITY, NY)
AIR SYNTHETIC MINOR (AIRS/AFS) STATE MASTER (New York facility tracking) - AIR PROGRAM Business SIC classification: OPERATORS OF APARTMENT BUILDINGS Business NAICS classification: LESSORS OF RESIDENTIAL BUILDINGS AND DWELLINGS. Organizations: KREISEL COMPANY (LEGALLY RESPONSIBLE PARTY)
45 W 81ST ST BUILDING (45 W 81ST ST in NEW YORK, NY)
AIR SYNTHETIC MINOR (AIRS/AFS) STATE MASTER (New York facility tracking) - AIR FACILITY REGISTRATION, AIR PROGRAM Business SIC classification: OPERATORS OF APARTMENT BUILDINGS; OPERATORS OF DWELLINGS OTHER THAN APARTMENT BUILDINGS Organizations: EXCELSIOR SYNDICATED INC
Housing units lacking complete plumbing facilities: 0.9% Housing units lacking complete kitchen facilities: 1.6%
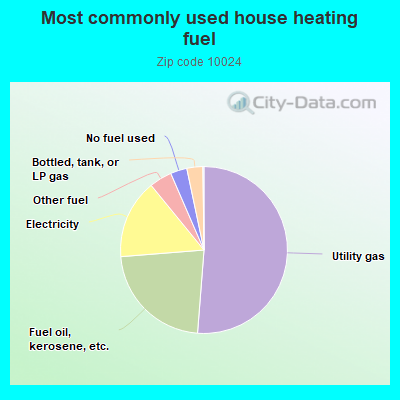
51.3%Utility gas
22.5%Fuel oil, kerosene, etc.
15.4%Electricity
4.4%Other fuel
3.2%No fuel used
3.1%Bottled, tank, or LP gas
Population in 1990: 65,141.
Place of birth for U.S.-born residents:
This state: 28,764
Northeast: 6,943
Midwest: 3,884
South: 4,553
West: 3,482
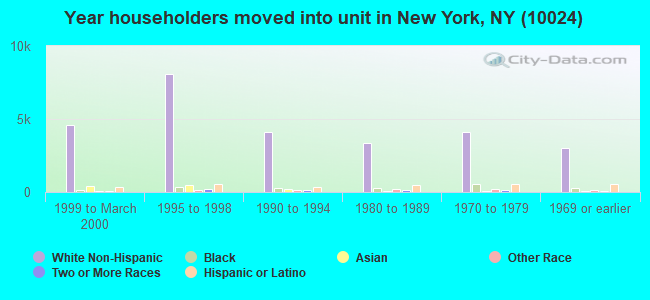
60% of the 10024 zip code residents lived in the same house 5 years ago. Out of people who lived in different houses, 52% lived in this county. Out of people who lived in different counties, 50% lived in New York.
83% of the 10024 zip code residents lived in the same house 1 year ago. Out of people who lived in different houses, 55% moved from this county. Out of people who lived in different houses, 15% moved from different county within same state. Out of people who lived in different houses, 24% moved from different state. Out of people who lived in different houses, 8% moved from abroad.
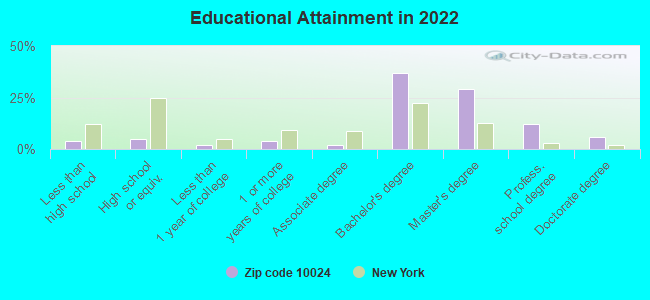
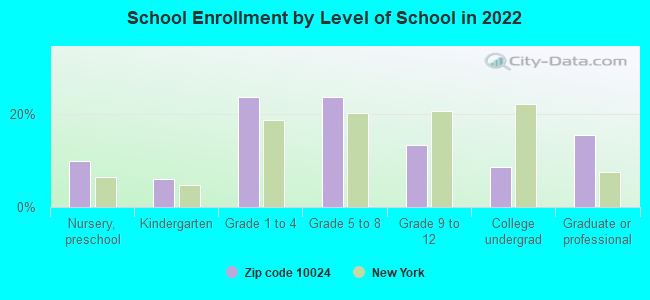
Private vs. public school enrollment:
Students in private schools in grades 1 to 8 (elementary and middle school): 2,571
Here:
55.0%
New York:
15.6%
Students in private schools in grades 9 to 12 (high school): 717
Here:
55.7%
New York:
15.0%
Students in private undergraduate colleges: 484
Here:
57.5%
New York:
39.2%
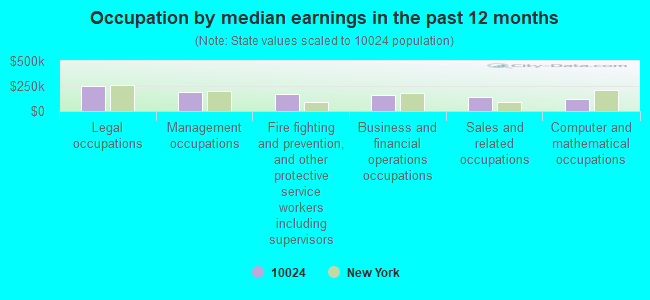
Occupation by median earnings in the past 12 months ($)
247,483Legal occupations
191,438Management occupations
169,690Fire fighting and prevention, and other protective service workers including supervisors
160,268Business and financial operations occupations
141,308Sales and related occupations
116,355Computer and mathematical occupations
Companies with biggest federal contracts located in this zip code (NEW YORK, NY):
MASS J NATHANIEL, OWNER (51 WEST 82ND STREET 1; small business)
$400,000 with Department of Defense for Other Defense -- Applied Research and Exploratory Development (R&D). Signed on 2002-09-25. Completion date: 2002-12-24.
LOORAM & ASSOCIATES (70 W 85TH ST; small business) : $231,195 in 8 contractsfrom 2005 to 2006
Contracts for Educational Services, Other Professional Services by Department of Defense, Defense Logistics Agency, Defense Information Systems Agency Signed by year:2000: $0; 2001: $0; 2002: $0; 2003: $0; 2004: $0; 2005: $113,195; 2006: $118,000.
Biggest contracts:
$50,000 with Department of Defense for Educational Services. Taking place in VA. Signed on 2005-01-14. Completion date: 2005-09-30.
$34,000 with Defense Logistics Agency for Other Professional Services. Signed on 2006-01-11. Completion date: 2006-09-22.
$32,000 with Defense Information Systems Agency for Educational Services. Taking place in VA. Signed on 2006-03-31. Completion date: 2006-06-30.
$31,400 with Defense Logistics Agency for Other Professional Services. Signed on 2005-09-22. Completion date: 2006-09-22.
THE PRINCETON REVIEW INC (2315 BROADWAY, 2ND FLOOR; small business) : $105,500 in 7 contractsfrom 2003 to 2005
Contracts for Miscellaneous Items, Miscellaneous Printed Matter, Educational Services, Newspapers and Periodicals by Peace Corps, Air Force, Army Signed by year:2000: $0; 2001: $0; 2002: $0; 2003: $82,000; 2004: $7,000; 2005: $16,500; 2006: $0.
Biggest contracts:
$75,000 with Peace Corps for Miscellaneous Items. Signed on 2003-08-15. Completion date: 2004-09-15.
$8,500 with Air Force for Miscellaneous Printed Matter. Signed on 2005-05-01. Completion date: 2005-05-05.
$8,000 with Army for Educational Services. Signed on 2005-11-04. Completion date: 2005-11-04.
$7,000, same as above.Signed on 2004-12-02. Completion date: 2004-11-30.
INTERNATIONAL ANALYSIS CENTER, (317 WEST 89TH ST; small business)
$99,393 with Army for ADP Facility Operation and Maintenance Services. Taking place in VA. Signed on 2002-05-23. Completion date: 2002-06-25.
AMERICAN MUSEUM OF NATURAL HIS (CENTRAL PARK WEST AT 79TH)
$60,000 with Indian Affairs (Assistant Secretary) for Organization/Administrative/PersonneI Studies. Signed on 2001-04-15. Completion date: 2001-10-15.
IZADY, MICHAEL (157 W 79TH ST APT 5B; small business) : $49,400 in 10 contractsfrom 2005 to 2006
Contracts for Other Professional Services, Reserve Training (Military), Other Education and Training Services by Army Signed by year:2000: $0; 2001: $0; 2002: $0; 2003: $0; 2004: $0; 2005: $21,400; 2006: $28,000.
Biggest contracts:
$10,000 with Army for Other Professional Services. Taking place in VA. Signed on 2005-09-13. Completion date: 2005-10-02.
$7,000 with Army for Reserve Training (Military). Taking place in VA. Signed on 2006-05-11. Completion date: 2006-05-19.
$6,400 with Army for Other Education and Training Services. Taking place in VA. Signed on 2006-05-26. Completion date: 2006-05-22.
$6,000 with Army for Other Education and Training Services. Taking place in DC. Signed on 2006-06-21. Completion date: 2006-06-18.
SOLIN,VICTORIA (98 RIVERSIDE DR; small business) : $49,194 in 3 contractsfrom 2004 to 2005
$24,995 with Navy for Telephone and/or Communications Services (includes Telegraph, Telex, and Cablevision Services). Signed on 2005-12-19. Completion date: 2006-01-20.
$16,000 with Navy for Miscellaneous Printed Matter. Signed on 2004-09-17. Completion date: 2004-10-18.
$8,199 with Navy for Books and Pamphlets. Signed on 2004-12-03. Completion date: 2005-01-05.
dr. michael h. stone (; small business)
$37,000 with Offices, Boards and Divisions (includes Attorney General, Deputy Attorney General, etc.) for Expert Witness. Signed on 2004-03-01. Completion date: 2005-12-31.
TECHNOLOGICAL ARTISANS INC (260 W 88TH STREET, SUITE B; small business)
$9,200 with Navy for Fiber Optic Light Sources. Signed on 2005-12-21. Completion date: 2006-01-06.
NODRUOY, INC (247 W 87TH ST APT 7J; small business)
$6,722 with Army for Lectures For Training. Taking place in AZ. Signed on 2002-10-24. Completion date: 2002-11-07.
Top industries in this zip code by the number of employees in 2005:
Real Estate and Rental and Leasing: Lessors of Residential Buildings and Dwellings (50-99: 2, 20-49: 4, 10-19: 14, 5-9: 37, 1-4: 115)
Other Services (except Public Administration): Other Similar Organizations (except Business, Professional, Labor, and Political Organizations) (20-49: 6, 10-19: 20, 5-9: 32, 1-4: 49)
Health Care and Social Assistance: Nursing Care Facilities (500-999: 1)
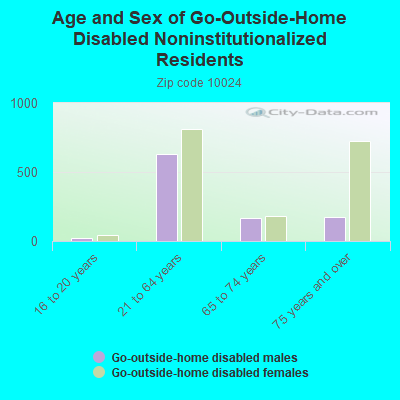
People in group quarters in 2010:
516 people in nursing facilities/skilled-nursing facilities
405 people in emergency and transitional shelters (with sleeping facilities) for people experiencing homelessness
259 people in other noninstitutional facilities
123 people in college/university student housing
28 people in group homes intended for adults
25 people in residential treatment centers for adults
4 people in workers' group living quarters and job corps centers
People in group quarters in 2000:
517 people in nursing homes
233 people in other noninstitutional group quarters
195 people in other group homes
72 people in college dormitories (includes college quarters off campus)
18 people in homes for the mentally ill
12 people in homes for the mentally retarded
9 people in religious group quarters
Fatal accident statistics in 2014:
Fatal accident count: 2
Vehicles involved in fatal accidents: 3
Fatal accidents caused by drunken drivers: 0
Fatalities: 2
Persons involved in fatal accidents: 7
Pedestrians involved in fatal accidents: 1
Fatal accident statistics in 2012:
Fatal accident count: 1
Vehicles involved in fatal accidents: 1
Fatal accidents caused by drunken drivers: 0
Fatalities: 1
Persons involved in fatal accidents: 3
Pedestrians involved in fatal accidents: 0
Home Mortgage Disclosure Act Aggregated Statistics For Year 2009 (Based on 6 full and 12 partial tracts)
A) FHA, FSA/RHS & VA Home Purchase Loans
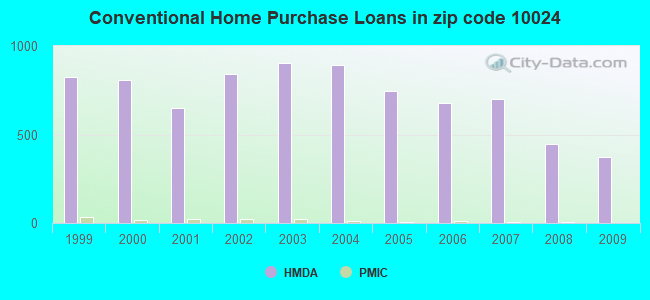
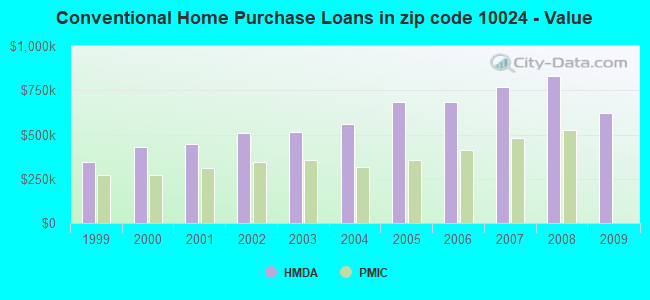
B) Conventional Home Purchase Loans
C) Refinancings
D) Home Improvement Loans
E) Loans on Dwellings For 5+ Families
F) Non-occupant Loans on < 5 Family Dwellings (A B C & D)
G) Loans On Manufactured Home Dwelling (A B C & D)
Number
Average Value
Number
Average Value
Number
Average Value
Number
Average Value
Number
Average Value
Number
Average Value
Number
Average Value
LOANS ORIGINATED
0
$0
375
$620,746
957
$484,748
27
$438,572
31
$1,246,216
109
$527,286
1
$10,000
APPLICATIONS APPROVED, NOT ACCEPTED
0
$0
64
$727,140
83
$611,307
0
$0
2
$1,331,500
16
$401,670
0
$0
APPLICATIONS DENIED
0
$0
98
$681,463
281
$554,969
10
$269,667
4
$912,500
54
$472,842
0
$0
APPLICATIONS WITHDRAWN
1
$810,170
70
$644,265
117
$550,838
2
$170,700
2
$1,061,000
34
$756,063
0
$0
FILES CLOSED FOR INCOMPLETENESS
0
$0
13
$826,507
59
$561,034
2
$272,495
0
$0
5
$511,222
0
$0
Aggregated Statistics For Year 2008 (Based on 6 full and 12 partial tracts)
A) FHA, FSA/RHS & VA Home Purchase Loans
B) Conventional Home Purchase Loans
C) Refinancings
D) Home Improvement Loans
E) Loans on Dwellings For 5+ Families
F) Non-occupant Loans on < 5 Family Dwellings (A B C & D)
Number
Average Value
Number
Average Value
Number
Average Value
Number
Average Value
Number
Average Value
Number
Average Value
LOANS ORIGINATED
0
$0
449
$827,890
327
$672,131
32
$913,099
47
$3,035,951
78
$833,209
APPLICATIONS APPROVED, NOT ACCEPTED
0
$0
91
$1,296,774
44
$533,546
5
$132,356
3
$2,365,000
17
$2,783,741
APPLICATIONS DENIED
0
$0
140
$767,158
95
$680,662
18
$336,906
5
$1,556,000
30
$731,406
APPLICATIONS WITHDRAWN
0
$0
84
$1,252,830
53
$896,515
2
$1,257,500
1
$1,725,000
19
$1,107,169
FILES CLOSED FOR INCOMPLETENESS
1
$730,000
27
$1,391,836
24
$779,712
4
$558,075
0
$0
7
$828,137
Aggregated Statistics For Year 2007 (Based on 6 full and 12 partial tracts)
A) FHA, FSA/RHS & VA Home Purchase Loans
B) Conventional Home Purchase Loans
C) Refinancings
D) Home Improvement Loans
E) Loans on Dwellings For 5+ Families
F) Non-occupant Loans on < 5 Family Dwellings (A B C & D)
Number
Average Value
Number
Average Value
Number
Average Value
Number
Average Value
Number
Average Value
Number
Average Value
LOANS ORIGINATED
0
$0
702
$768,918
261
$682,169
33
$421,960
43
$2,289,406
108
$758,574
APPLICATIONS APPROVED, NOT ACCEPTED
1
$174,000
159
$857,657
49
$561,100
14
$351,135
1
$2,126,420
31
$819,904
APPLICATIONS DENIED
0
$0
138
$741,478
87
$546,297
24
$170,640
3
$9,588,333
34
$483,157
APPLICATIONS WITHDRAWN
0
$0
106
$1,105,267
48
$743,656
5
$699,836
4
$1,475,000
23
$1,063,392
FILES CLOSED FOR INCOMPLETENESS
0
$0
28
$1,127,948
10
$600,218
7
$119,500
0
$0
4
$4,065,235
Aggregated Statistics For Year 2006 (Based on 6 full and 12 partial tracts)
B) Conventional Home Purchase Loans
C) Refinancings
D) Home Improvement Loans
E) Loans on Dwellings For 5+ Families
F) Non-occupant Loans on < 5 Family Dwellings (A B C & D)
Number
Average Value
Number
Average Value
Number
Average Value
Number
Average Value
Number
Average Value
LOANS ORIGINATED
679
$682,796
240
$622,212
40
$475,927
36
$2,492,958
138
$583,429
APPLICATIONS APPROVED, NOT ACCEPTED
117
$691,426
41
$537,872
12
$374,777
3
$67,000,000
18
$549,231
APPLICATIONS DENIED
181
$737,219
91
$633,066
26
$259,851
2
$767,500
55
$570,917
APPLICATIONS WITHDRAWN
106
$741,253
55
$554,714
5
$164,922
4
$776,250
17
$682,661
FILES CLOSED FOR INCOMPLETENESS
33
$638,334
20
$490,820
1
$592,620
0
$0
10
$540,985
Aggregated Statistics For Year 2005 (Based on 6 full and 12 partial tracts)
B) Conventional Home Purchase Loans
C) Refinancings
D) Home Improvement Loans
E) Loans on Dwellings For 5+ Families
F) Non-occupant Loans on < 5 Family Dwellings (A B C & D)
Number
Average Value
Number
Average Value
Number
Average Value
Number
Average Value
Number
Average Value
LOANS ORIGINATED
744
$684,596
436
$536,986
44
$421,679
69
$1,909,225
134
$512,474
APPLICATIONS APPROVED, NOT ACCEPTED
150
$668,923
48
$666,335
6
$261,878
0
$0
29
$575,462
APPLICATIONS DENIED
149
$669,374
100
$495,553
28
$284,292
1
$2,103,170
39
$559,824
APPLICATIONS WITHDRAWN
121
$672,371
59
$539,075
5
$713,492
4
$7,056,300
32
$458,407
FILES CLOSED FOR INCOMPLETENESS
31
$751,945
25
$817,794
5
$381,822
1
$945,000
10
$624,294
Aggregated Statistics For Year 2004 (Based on 6 full and 12 partial tracts)
B) Conventional Home Purchase Loans
C) Refinancings
D) Home Improvement Loans
E) Loans on Dwellings For 5+ Families
F) Non-occupant Loans on < 5 Family Dwellings (A B C & D)
Number
Average Value
Number
Average Value
Number
Average Value
Number
Average Value
Number
Average Value
LOANS ORIGINATED
894
$558,013
620
$474,873
30
$374,059
79
$1,183,682
125
$495,146
APPLICATIONS APPROVED, NOT ACCEPTED
159
$574,045
78
$484,860
4
$299,808
0
$0
26
$374,816
APPLICATIONS DENIED
152
$581,713
107
$429,956
19
$85,933
0
$0
26
$535,927
APPLICATIONS WITHDRAWN
121
$572,697
73
$645,478
10
$271,959
6
$6,129,010
24
$444,020
FILES CLOSED FOR INCOMPLETENESS
26
$491,221
18
$288,403
5
$168,936
0
$0
6
$217,500
Aggregated Statistics For Year 2003 (Based on 6 full and 12 partial tracts)
B) Conventional Home Purchase Loans
C) Refinancings
D) Home Improvement Loans
E) Loans on Dwellings For 5+ Families
F) Non-occupant Loans on < 5 Family Dwellings (A B C & D)
Number
Average Value
Number
Average Value
Number
Average Value
Number
Average Value
Number
Average Value
LOANS ORIGINATED
906
$516,410
2,347
$385,425
9
$332,124
56
$1,559,946
191
$404,225
APPLICATIONS APPROVED, NOT ACCEPTED
131
$583,684
244
$405,180
8
$83,564
1
$2,168,330
27
$309,504
APPLICATIONS DENIED
131
$572,494
294
$433,981
13
$42,512
4
$1,320,750
44
$370,039
APPLICATIONS WITHDRAWN
72
$633,893
118
$422,973
2
$60,965
4
$2,461,250
22
$501,779
FILES CLOSED FOR INCOMPLETENESS
30
$555,827
95
$372,177
2
$118,455
0
$0
8
$481,136
Aggregated Statistics For Year 2002 (Based on 6 full and 12 partial tracts)
B) Conventional Home Purchase Loans
C) Refinancings
D) Home Improvement Loans
E) Loans on Dwellings For 5+ Families
F) Non-occupant Loans on < 5 Family Dwellings (A B C & D)
Number
Average Value
Number
Average Value
Number
Average Value
Number
Average Value
Number
Average Value
LOANS ORIGINATED
843
$508,904
1,577
$428,352
12
$107,949
43
$3,337,025
128
$409,871
APPLICATIONS APPROVED, NOT ACCEPTED
151
$502,968
208
$402,767
4
$56,798
0
$0
17
$251,830
APPLICATIONS DENIED
100
$536,160
202
$355,817
29
$72,804
4
$2,663,645
33
$254,995
APPLICATIONS WITHDRAWN
69
$454,992
115
$413,010
4
$1,097,445
6
$1,857,502
19
$636,063
FILES CLOSED FOR INCOMPLETENESS
37
$543,717
69
$334,363
1
$50,000
2
$543,000
5
$376,236
Aggregated Statistics For Year 2001 (Based on 6 full and 12 partial tracts)
B) Conventional Home Purchase Loans
C) Refinancings
D) Home Improvement Loans
E) Loans on Dwellings For 5+ Families
F) Non-occupant Loans on < 5 Family Dwellings (A B C & D)
Number
Average Value
Number
Average Value
Number
Average Value
Number
Average Value
Number
Average Value
LOANS ORIGINATED
649
$445,910
705
$413,368
7
$315,244
43
$3,083,812
79
$380,793
APPLICATIONS APPROVED, NOT ACCEPTED
103
$491,869
113
$370,108
2
$107,930
1
$840,000
17
$276,381
APPLICATIONS DENIED
88
$437,491
126
$307,743
16
$60,134
5
$705,000
18
$270,256
APPLICATIONS WITHDRAWN
47
$515,422
77
$370,321
5
$146,180
4
$24,082,940
10
$258,016
FILES CLOSED FOR INCOMPLETENESS
22
$396,614
39
$303,920
2
$51,405
0
$0
5
$357,206
Aggregated Statistics For Year 2000 (Based on 6 full and 12 partial tracts)
B) Conventional Home Purchase Loans
C) Refinancings
D) Home Improvement Loans
E) Loans on Dwellings For 5+ Families
F) Non-occupant Loans on < 5 Family Dwellings (A B C & D)
Number
Average Value
Number
Average Value
Number
Average Value
Number
Average Value
Number
Average Value
LOANS ORIGINATED
810
$428,865
178
$342,416
26
$240,815
37
$1,082,338
58
$302,718
APPLICATIONS APPROVED, NOT ACCEPTED
168
$502,416
27
$515,784
4
$53,080
2
$367,500
14
$241,879
APPLICATIONS DENIED
126
$418,501
76
$328,487
25
$58,816
2
$550,000
22
$298,630
APPLICATIONS WITHDRAWN
78
$600,396
31
$322,780
5
$73,972
7
$3,819,783
8
$539,180
FILES CLOSED FOR INCOMPLETENESS
23
$601,357
17
$303,985
13
$62,568
0
$0
3
$702,463
Aggregated Statistics For Year 1999 (Based on 6 full and 4 partial tracts)
B) Conventional Home Purchase Loans
C) Refinancings
D) Home Improvement Loans
E) Loans on Dwellings For 5+ Families
F) Non-occupant Loans on < 5 Family Dwellings (A B C & D)
2007 - 2018 National Fire Incident Reporting System (NFIRS) incidents
Based on the data from the years 2007 - 2018 the average number of fires per year is 209. The highest number of fires - 244 took place in 2014, and the least - 126 in 2007. The data has a growing trend.
When looking into fire subcategories, the most reports belonged to: Structure Fires (72.6%), and Outside Fires (18.6%).
Fire incident types reported to NFIRS in Zip Code 10024


+$769
-$2,666
 Nearest zip codes: 10025, 10115, 10026, 10023, 10027, 07020.
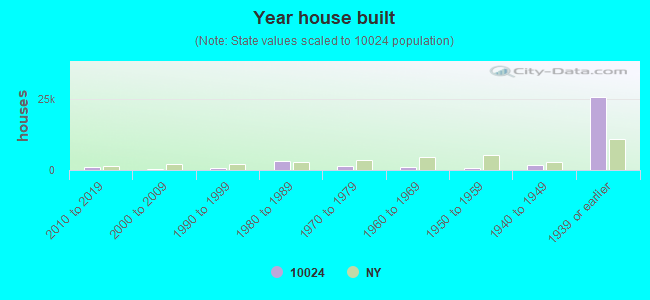


 Based on the data from the years 2007 - 2018 the average number of fires per year is 209. The highest number of fires - 244 took place in 2014, and the least - 126 in 2007. The data has a growing trend.
 When looking into fire subcategories, the most reports belonged to: Structure Fires (72.6%), and Outside Fires (18.6%).