Estimated zip code population in 2022: 64,761 Zip code population in 2010: 59,707 Zip code population in 2000: 56,168
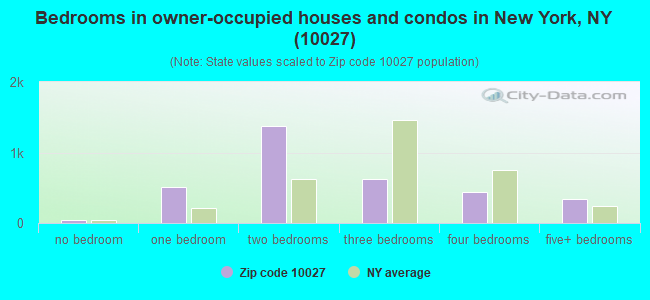
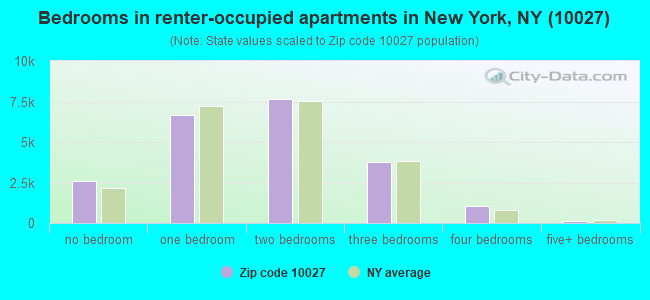
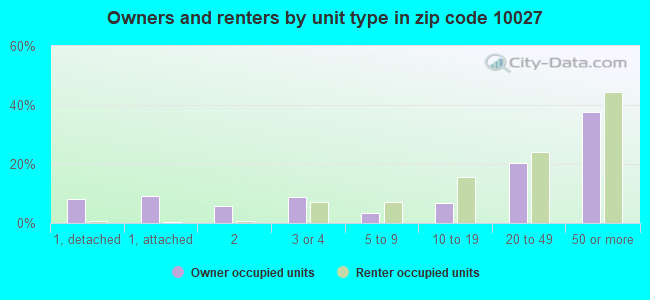
Houses and condos: 27,757 Renter-occupied apartments: 21,706
% of renters here:
87%
State:
46%
March 2022 cost of living index in zip code 10027: 158.8 (very high, U.S. average is 100)
Land area: 0.9 sq. mi. Water area: 0.0 sq. mi.
Population density: 74,313 people per square mile
(very high).
OSM Map
General Map
Google Map
MSN Map
OSM Map
General Map
Google Map
MSN Map
OSM Map
General Map
Google Map
MSN Map
OSM Map
General Map
Google Map
MSN Map
Please wait while loading the map...
Real estate property taxes paid for housing units in 2022:
This zip code:
0.5% ($4,274)
New York:
1.5% ($6,180)
Median real estate property taxes paid for housing units with mortgages in 2022: $4,312 (0.4%) Median real estate property taxes paid for housing units with no mortgage in 2022: $4,207 (0.5%)
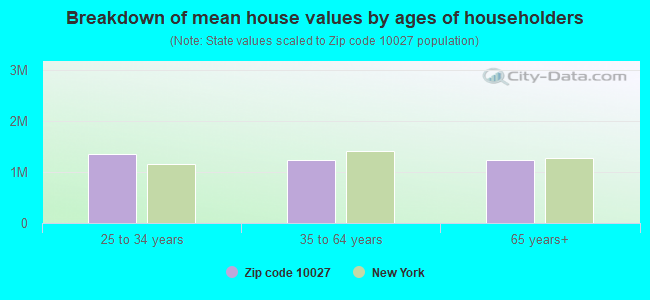
Estimated median house/condo value in 2022: $909,839
10027:
$909,839
New York:
$400,400
According to our research of New York and other state lists, there were 40 registered sex offenders living in 10027 zip code as of April 27, 2024. The ratio of all residents to sex offenders in zip code 10027 is 1,626 to 1. The ratio of registered sex offenders to all residents in this zip code is lower than the state average.
Median resident age:
This zip code:
32.0 years
New York median age:
40.0 years
Average household size:
This zip code:
2.2 people
New York:
2.5 people
Averages for the 2020 tax year for zip code 10027, filed in 2021:
Average Adjusted Gross Income (AGI) in 2020: $73,606 (Individual Income Tax Returns)
Here:
$73,606
State:
$90,930
Salary/wage: $66,725 (reported on 81.4% of returns)
Here:
$66,725
State:
$72,104
(% of AGI for various income ranges: 912.7% for AGIs below $25k, 3477.0% for AGIs $25k-50k, 6925.1% for AGIs $50k-75k, 10836.6% for AGIs $75k-100k, 20266.9% for AGIs $100k-200k, 109915.9% for AGIs over 200k)
Taxable interest for individuals: $1,458 (reported on 22.3% of returns)
This zip code:
$1,458
New York:
$3,075
(% of AGI for various income ranges: 5.2% for AGIs below $25k, 5.9% for AGIs $25k-50k, 20.5% for AGIs $50k-75k, 29.4% for AGIs $75k-100k, 103.9% for AGIs $100k-200k, 1082.4% for AGIs over 200k)
Ordinary dividends: $7,754 (reported on 16.2% of returns)
Here:
$7,754
State:
$11,095
(% of AGI for various income ranges: 12.4% for AGIs below $25k, 22.3% for AGIs $25k-50k, 57.0% for AGIs $50k-75k, 110.6% for AGIs $75k-100k, 376.1% for AGIs $100k-200k, 4504.1% for AGIs over 200k)
Net capital gain/loss in AGI: +$31,298 (reported on 15.1% of returns)
Here:
+$31,298
State:
+$44,925
(% of AGI for various income ranges: 8.9% for AGIs below $25k, 28.4% for AGIs $25k-50k, 59.1% for AGIs $50k-75k, 145.8% for AGIs $75k-100k, 540.0% for AGIs $100k-200k, 22125.3% for AGIs over 200k)
Profit/loss from business: +$12,951 (reported on 20.8% of returns)
Here:
+$12,951
State:
+$14,940
(% of AGI for various income ranges: 173.8% for AGIs below $25k, 112.1% for AGIs $25k-50k, 173.7% for AGIs $50k-75k, 311.4% for AGIs $75k-100k, 686.1% for AGIs $100k-200k, 6831.4% for AGIs over 200k)
Taxable individual retirement arrangement distribution: $22,452 (reported on 2.9% of returns)
10027:
$22,452
New York:
$19,609
(% of AGI for various income ranges: 10.0% for AGIs below $25k, 19.5% for AGIs $25k-50k, 43.5% for AGIs $50k-75k, 110.2% for AGIs $75k-100k, 296.6% for AGIs $100k-200k, 1731.0% for AGIs over 200k)
Self-employed (Keogh) retirement plans: $27,252 (reported on 0.9% of returns)
10027:
$27,252
New York:
$32,497
(% of AGI for various income ranges: 2.2% for AGIs $25k-50k, 19.4% for AGIs $50k-75k, 50.3% for AGIs $100k-200k, 1053.7% for AGIs over 200k)
Total itemized deductions: $33,158 (reported on 7.7% of returns)
Here:
$33,158
State:
$39,326
(% of AGI for various income ranges: 19.7% for AGIs below $25k, 60.0% for AGIs $25k-50k, 176.7% for AGIs $50k-75k, 434.4% for AGIs $75k-100k, 1174.7% for AGIs $100k-200k, 6981.0% for AGIs over 200k)
Charity contributions: $10,921 (reported on 6.6% of returns)
Here:
$10,921
State:
$15,420
(% of AGI for various income ranges: 1.2% for AGIs below $25k, 9.7% for AGIs $25k-50k, 33.6% for AGIs $50k-75k, 100.8% for AGIs $75k-100k, 275.9% for AGIs $100k-200k, 2412.0% for AGIs over 200k)
Taxes paid: $8,913 (reported on 7.7% of returns)
10027:
$8,913
State:
$9,183
(% of AGI for various income ranges: 3.5% for AGIs below $25k, 15.1% for AGIs $25k-50k, 52.1% for AGIs $50k-75k, 153.0% for AGIs $75k-100k, 414.7% for AGIs $100k-200k, 1502.5% for AGIs over 200k)
Earned income credit: $2,133 (reported on 21.0% of returns)
Here:
$2,133
State:
$2,138
(% of AGI for various income ranges: 116.6% for AGIs below $25k, 68.8% for AGIs $25k-50k, 0.6% for AGIs $50k-75k)
Percentage of individuals using paid preparers for their 2020 taxes: 94.0%
Here:
94%
State:
95%
(% for various income ranges: 92.7% for AGIs below $25k, 95.0% for AGIs $25k-50k, 94.2% for AGIs $50k-75k, 94.1% for AGIs $75k-100k, 94.5% for AGIs $100k-200k, 96.6% for AGIs over 200k)
Averages for the 2012 tax year for zip code 10027, filed in 2013:
Average Adjusted Gross Income (AGI) in 2012: $50,162 (Individual Income Tax Returns)
Here:
$50,162
State:
$77,088
Salary/wage: $47,983 (reported on 83.1% of returns)
Here:
$47,983
State:
$60,593
(% of AGI for various income ranges: 71.4% for AGIs below $25k, 89.0% for AGIs $25k-50k, 87.5% for AGIs $50k-75k, 85.2% for AGIs $75k-100k, 82.1% for AGIs $100k-200k, 69.0% for AGIs over 200k)
Taxable interest for individuals: $1,133 (reported on 23.1% of returns)
This zip code:
$1,133
New York:
$3,125
(% of AGI for various income ranges: 0.3% for AGIs below $25k, 0.3% for AGIs $25k-50k, 0.3% for AGIs $50k-75k, 0.3% for AGIs $75k-100k, 0.5% for AGIs $100k-200k, 0.9% for AGIs over 200k)
Ordinary dividends: $5,891 (reported on 12.8% of returns)
Here:
$5,891
State:
$10,299
(% of AGI for various income ranges: 0.8% for AGIs below $25k, 0.6% for AGIs $25k-50k, 1.0% for AGIs $50k-75k, 1.1% for AGIs $75k-100k, 1.4% for AGIs $100k-200k, 2.9% for AGIs over 200k)
Net capital gain/loss in AGI: +$11,928 (reported on 10.4% of returns)
Here:
+$11,928
State:
+$42,474
(% of AGI for various income ranges: 0.2% for AGIs below $25k, 0.2% for AGIs $25k-50k, 0.2% for AGIs $50k-75k, 0.4% for AGIs $75k-100k, 1.2% for AGIs $100k-200k, 7.5% for AGIs over 200k)
Profit/loss from business: +$11,535 (reported on 22.0% of returns)
Here:
+$11,535
State:
+$16,168
(% of AGI for various income ranges: 18.3% for AGIs below $25k, 2.4% for AGIs $25k-50k, 2.3% for AGIs $50k-75k, 2.3% for AGIs $75k-100k, 4.0% for AGIs $100k-200k, 4.4% for AGIs over 200k)
Taxable individual retirement arrangement distribution: $17,382 (reported on 3.6% of returns)
10027:
$17,382
New York:
$17,621
(% of AGI for various income ranges: 0.5% for AGIs below $25k, 0.6% for AGIs $25k-50k, 1.0% for AGIs $50k-75k, 1.2% for AGIs $75k-100k, 1.5% for AGIs $100k-200k, 1.9% for AGIs over 200k)
Self-employment retirement plans: $21,600 (reported on 0.7% of returns)
10027:
$21,600
New York:
$27,330
(% of AGI for various income ranges: 0.2% for AGIs $50k-75k, 0.3% for AGIs $100k-200k, 0.8% for AGIs over 200k)
Total itemized deductions: $24,802 (20% of AGI, reported on 26.0% of returns)
Here:
$24,802
State:
$34,985
Here:
20.2% of AGI
State:
21.3% of AGI
(% of AGI for various income ranges: 3.8% for AGIs below $25k, 8.3% for AGIs $25k-50k, 12.0% for AGIs $50k-75k, 15.1% for AGIs $75k-100k, 16.6% for AGIs $100k-200k, 16.4% for AGIs over 200k)
Charity contributions: $3,890 (reported on 21.1% of returns)
Here:
$3,890
State:
$5,572
(% of AGI for various income ranges: 0.4% for AGIs below $25k, 1.3% for AGIs $25k-50k, 1.8% for AGIs $50k-75k, 2.0% for AGIs $75k-100k, 1.8% for AGIs $100k-200k, 2.0% for AGIs over 200k)
Taxes paid: $12,710 (reported on 25.9% of returns)
10027:
$12,710
State:
$18,656
(% of AGI for various income ranges: 0.7% for AGIs below $25k, 2.1% for AGIs $25k-50k, 4.6% for AGIs $50k-75k, 7.2% for AGIs $75k-100k, 8.9% for AGIs $100k-200k, 10.9% for AGIs over 200k)
Earned income credit: $2,256 (reported on 29.0% of returns)
Here:
$2,256
State:
$2,230
(% of AGI for various income ranges: 10.0% for AGIs below $25k, 1.0% for AGIs $25k-50k)
Percentage of individuals using paid preparers for their 2012 taxes: 59.7%
Here:
60%
State:
66%
(% for various income ranges: 58.6% for AGIs below $25k, 57.8% for AGIs $25k-50k, 59.9% for AGIs $50k-75k, 60.5% for AGIs $75k-100k, 65.4% for AGIs $100k-200k, 74.7% for AGIs over 200k)
Averages for the 2004 tax year for zip code 10027, filed in 2005:
Average Adjusted Gross Income (AGI) in 2004: $36,026 (Individual Income Tax Returns)
Here:
$36,026
State:
$59,519
Salary/wage: $34,979 (reported on 85.2% of returns)
Here:
$34,979
State:
$50,673
(% of AGI for various income ranges: 77.8% for AGIs below $10k, 82.6% for AGIs $10k-25k, 92.7% for AGIs $25k-50k, 89.2% for AGIs $50k-75k, 85.3% for AGIs $75k-100k, 70.8% for AGIs over 100k)
Taxable interest for individuals: $1,033 (reported on 27.7% of returns)
This zip code:
$1,033
New York:
$2,377
(% of AGI for various income ranges: 1.3% for AGIs below $10k, 0.6% for AGIs $10k-25k, 0.4% for AGIs $25k-50k, 0.6% for AGIs $50k-75k, 0.8% for AGIs $75k-100k, 1.2% for AGIs over 100k)
Taxable dividends: $3,544 (reported on 13.1% of returns)
Here:
$3,544
State:
$5,394
(% of AGI for various income ranges: 1.4% for AGIs below $10k, 0.6% for AGIs $10k-25k, 0.4% for AGIs $25k-50k, 0.9% for AGIs $50k-75k, 1.1% for AGIs $75k-100k, 2.6% for AGIs over 100k)
Net capital gain/loss: +$10,752 (reported on 10.4% of returns)
Here:
+$10,752
State:
+$23,581
(% of AGI for various income ranges: -0.6% for AGIs below $10k, -0.0% for AGIs $10k-25k, 0.3% for AGIs $25k-50k, 0.4% for AGIs $50k-75k, 0.6% for AGIs $75k-100k, 9.2% for AGIs over 100k)
Profit/loss from business: +$8,726 (reported on 18.2% of returns)
Here:
+$8,726
State:
+$13,809
(% of AGI for various income ranges: 25.5% for AGIs below $10k, 8.2% for AGIs $10k-25k, 1.3% for AGIs $25k-50k, 1.4% for AGIs $50k-75k, 1.7% for AGIs $75k-100k, 5.5% for AGIs over 100k)
IRA payment deduction: $2,433 (reported on 1.8% of returns)
10027:
$2,433
New York:
$3,115
(% of AGI for various income ranges: 0.1% for AGIs below $10k, 0.2% for AGIs $10k-25k, 0.2% for AGIs $25k-50k, 0.1% for AGIs $50k-75k, 0.1% for AGIs $75k-100k, 0.0% for AGIs over 100k)
Self-employed pension: $11,519 (reported on 0.7% of returns)
Here:
$11,519
New York:
$19,016
(% of AGI for various income ranges: 0.1% for AGIs $25k-50k, 0.1% for AGIs $50k-75k, 0.1% for AGIs $75k-100k, 0.6% for AGIs over 100k)
Total itemized deductions: $17,153 (22% of AGI, reported on 27.4% of returns)
Here:
$17,153
State:
$25,864
Here:
22.1% of AGI
State:
21.9% of AGI
(% of AGI for various income ranges: 3.7% for AGIs below $10k, 4.9% for AGIs $10k-25k, 11.9% for AGIs $25k-50k, 16.7% for AGIs $50k-75k, 16.9% for AGIs $75k-100k, 15.5% for AGIs over 100k)
Charity contributions deductions: $3,436 (4% of AGI, reported on 23.0% of returns)
Here:
$3,436
State:
$4,439
Here:
4.1% of AGI
State:
3.6% of AGI
(% of AGI for various income ranges: 0.2% for AGIs below $10k, 0.7% for AGIs $10k-25k, 2.2% for AGIs $25k-50k, 3.1% for AGIs $50k-75k, 2.9% for AGIs $75k-100k, 2.3% for AGIs over 100k)
Total tax: $6,265 (reported on 67.2% of returns)
10027:
$6,265
State:
$11,730
(% of AGI for various income ranges: 4.6% for AGIs below $10k, 4.1% for AGIs $10k-25k, 6.6% for AGIs $25k-50k, 11.0% for AGIs $50k-75k, 12.9% for AGIs $75k-100k, 19.9% for AGIs over 100k)
Earned income credit: $1,774 (reported on 29.6% of returns)
Here:
$1,774
State:
$1,757
Percentage of individuals using paid preparers for their 2004 taxes: 62.6%
Here:
63%
State:
67%
(% for various income ranges: 56.8% for AGIs below $10k, 66.5% for AGIs $10k-25k, 62.5% for AGIs $25k-50k, 60.6% for AGIs $50k-75k, 65.7% for AGIs $75k-100k, 71.0% for AGIs over 100k)
Likely homosexual households (counted as self-reported same-sex unmarried-partner households)
Lesbian couples: 0.2% of all households
Gay men: 0.5% of all households
Household received Food Stamps/SNAP in the past 12 months: 4,564 Household did not receive Food Stamps/SNAP in the past 12 months: 20,426
Women who had a birth in the past 12 months: 599 (390 now married, 210 unmarried) Women who did not have a birth in the past 12 months: 20,163 (3,590 now married, 16,754 unmarried)
Housing units in zip code 10027 with a mortgage: 1,822 (183 second mortgage, 185 both second mortgage and home equity loan) Houses without a mortgage: 15
Median monthly owner costs for units with a mortgage: $3,051 Median monthly owner costs for units without a mortgage: $775
Residents with income below the poverty level in 2022:
This zip code:
26.0%
Whole state:
14.3%
Residents with income below 50% of the poverty level in 2022:
This zip code:
9.3%
Whole state:
6.8%
Median number of rooms in houses and condos:
Here:
4.4
State:
6.3
Median number of rooms in apartments:
Here:
3.7
State:
3.8
Notable locations in this zip code not listed on our city pages
Notable locations in zip code 10027: Buell Hall (A), Butler Hall (B), Chandler Hall (C), Dodge Hall (D), Fayerweather Hall (E), Furnald Hall (F), Hamilton Hall (G), Hartley Hall (H), Havemeyer Hall (I), James Kent Hall (J), Aaron Davis Hall for the Performing Arts (K), Lewisohn Hall (L), Pupin Hall (M), Schermerhorn Hall (N), Seth Low Hall (O), Wallach Hall (P), Wien Hall (Q), Claremont Youth Center (R), Deutsches Haus (S), Elliott Hall (T). Display/hide their locations on the map
Churches in zip code 10027 include: Saint Aloysius Roman Catholic Church (A), Williams Christian Methodist Episcopal Church (B), Salem United Methodist Church (C), Metropolitan Baptist Church (D), Baptist House of Prayer (E), Ephesus Seventh Day Adventist Church (F), Bethelite Community Baptist Church (G), Greater Bethel African Methodist Episcopal Church (H), Commandment Keepers Ethiopian Hebrew Congregation (I). Display/hide their locations on the map
Parks in zip code 10027 include: Saint Nicholas Park (1), Hancock Park (2), Mount Morris Park Historic District (3), Collyer Brothers Park (4), Unity Gardens (5), Sheltering Arms Park (6), Saint Nicholas Playground South (7), Saint Nicholas Playground North (8), Onehundredthirtysecond Street Block Association Park (9). Display/hide their locations on the map
Tourist attractions (not listed on the city page) : Studio Museum In Harlem (Art Museums; 144 West 125th), Big Apple Jazz (Tours & Charters; 2236 7 Av).
4,714 married couples with children.
4,880 single-parent households (591 men, 4,289 women).
62.2% of residents of 10027 zip code speak English at home.
18.6% of residents speak Spanish at home (72% very well, 12% well, 9% not well, 7% not at all).
8.7% of residents speak other Indo-European language at home (86% very well, 10% well, 3% not well).
5.8% of residents speak Asian or Pacific Island language at home (60% very well, 27% well, 8% not well, 5% not at all).
4.2% of residents speak other language at home (65% very well, 31% well, 4% not well).
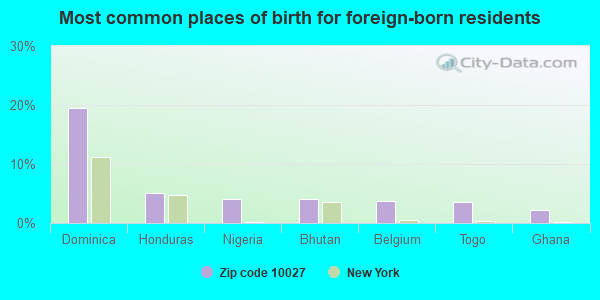
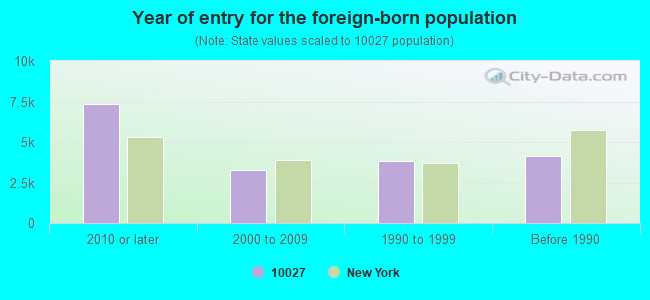
Foreign born population: 16,314 (25.2%) (45.0% of them are naturalized citizens)
Major facilities with environmental interests located in this zip code:
GORDEN CLEANERS (213 LENOX AVE in NEW YORK CITY, NY)
AIR MINOR (AIRS/AFS) STATE MASTER (New York facility tracking) - AIR PROGRAM (Integrated Compliance Information System) - ICIS-02-2002-1275, FORMAL ENFORCEMENT ACTION Conditionally Exempt Small Quantity Generators, less than 100 kg/month of hazardous waste (Resource Conservation and Recovery Act (tracking hazardous waste)) - notification Business SIC classification: DRYCLEANING PLANTS, EXCEPT RUG CLEANING Business NAICS classification: DRYCLEANING AND LAUNDRY SERVICES (EXCEPT COIN-OPERATED). Organizations: CITY OF NEW YORK (CONTACT/OWNER)
, GORDEN CLEANERS CORP (LEGALLY RESPONSIBLE PARTY)
Alternative names: GORDEN'S DRY CLEANER, GORDENS CLEANERS, GORDENS DRY CLEANER, GORDON'S CLEANERS
COLUMBIA UNIVERSITY-410 W 118TH ST (410 WEST 118TH STREET in NEW YORK, NY)
AIR MAJOR (AIRS/AFS) STATE MASTER (New York facility tracking) - AIR PROGRAM, AIR MAJOR (Integrated Compliance Information System) - ICIS-02-2002-1026, FORMAL ENFORCEMENT ACTION Business SIC classification: STEAM AND AIR-CONDITIONING SUPPLY; ELEMENTARY AND SECONDARY SCHOOLS; COLLEGES, UNIVERSITIES, AND PROFESSIONAL SCHOOLS
131ST CLEANERS (2439 8TH AVE(FREDERIC DOUGLAS in NEW YORK, NY)
AIR MINOR (AIRS/AFS) STATE MASTER (New York facility tracking) - AIR PROGRAM, HAZARDOUS WASTE PROGRAM Small Quantity Generators, between 100 kg and 1000 kg of hazardous waste/month (Resource Conservation and Recovery Act (tracking hazardous waste)) Business SIC classification: DRYCLEANING PLANTS, EXCEPT RUG CLEANING Business NAICS classification: DRYCLEANING AND LAUNDRY SERVICES (EXCEPT COIN-OPERATED). Organizations: LEE CHANG (CONTACT/OPERATOR)
, 131ST STREET CLEANERS INC (LEGALLY RESPONSIBLE PARTY)
Alternative names: 131ST STREET CLEANERS, BETTY BRITE
ALEXANDER DOLL CO INC-615 W 131ST ST (615 WEST 131 STREET in NEW YORK CITY, NY)
AIR MINOR (AIRS/AFS) STATE MASTER (New York facility tracking) - AIR PROGRAM, Small Quantity Generators, between 100 kg and 1000 kg of hazardous waste/month (Resource Conservation and Recovery Act (tracking hazardous waste)) - notification Business SIC classification: DOLLS AND STUFFED TOYS Organizations: ALEXANDER DOLL COMPANY INC (LEGALLY RESPONSIBLE PARTY)
3251 BROADWAY AUTO CENTER INC (3249 - 3251 BROADWAY in NEW YORK, NY)
AIR SYNTHETIC MINOR (AIRS/AFS) STATE MASTER (New York facility tracking) - AIR PROGRAM, Business SIC classification: TOP, BODY, AND UPHOLSTERY REPAIR SHOPS AND PAINT SHOPS Organizations: JV AUTO SHOP INC (LEGALLY RESPONSIBLE PARTY)
AMBER CHARTER SCHOOL ( in NEW YORK, NY)
(National Center for Education Statistics) - STATE ID-310500860806
HALE HOUSE (THE) ( in NEW YORK, NY)
(National Center for Education Statistics) - STATE ID-310300894061 Organizations: NEW YORK CITY PUBLIC SCHOOLS (SCHOOL DISTRICT)
IS 195 ROBERTO CLEMENTE SCHOOL ( in NEW YORK, NY)
(National Center for Education Statistics) - STATE ID-310500010195 Organizations: NEW YORK CITY PUBLIC SCHOOLS (SCHOOL DISTRICT)
IS 286 RENAISSANCE MILITARY & LEADER ( in NEW YORK, NY)
(National Center for Education Statistics) - STATE ID-310500010286 Organizations: NEW YORK CITY PUBLIC SCHOOLS (SCHOOL DISTRICT)
IS 172 POWELL SCHOOL FOR LAW & SOCIA ( in NEW YORK, NY)
(National Center for Education Statistics) - STATE ID-310500010172 Organizations: NEW YORK CITY PUBLIC SCHOOLS (SCHOOL DISTRICT)
COLUMBIA UNI - HAMILTON HALL (1130 AMSTERDAM AVE in NEW YORK CITY, NY)
(Integrated Compliance Information System) - ICIS-02-1999-1113, FORMAL ENFORCEMENT ACTION Business SIC classification: SPECIAL TRADE CONTRACTORS
COLUMBIA UNIVERSITY (116TH STREET in NEW YORK, NY)
(Integrated Compliance Information System) - ICIS-02-2002-7108, FORMAL ENFORCEMENT ACTION, Business SIC classification: COLLEGES, UNIVERSITIES, AND PROFESSIONAL SCHOOLS
COLUMBIA UNIVERSITY (500 WEST 120TH STREET in NEW YORK, NY)
CRITERIA AND HAZARDOUS AIR POLLUTANT INVENTORY (Inventory of air pollution sources) HAZARDOUS WASTE BIENNIAL REPORTER (Resource Conservation and Recovery Act (tracking hazardous waste)) Large Quantity Generators, more that 1000 kg of hazardous waste/month (Resource Conservation and Recovery Act (tracking hazardous waste)) - notification Business SIC classification: STEAM AND AIR-CONDITIONING SUPPLY; COLLEGES, UNIVERSITIES, AND PROFESSIONAL SCHOOLS Alternative names: COLUMBIA UNIVERSITY POWER HOUS
Housing units lacking complete plumbing facilities: 1.1% Housing units lacking complete kitchen facilities: 1.8%
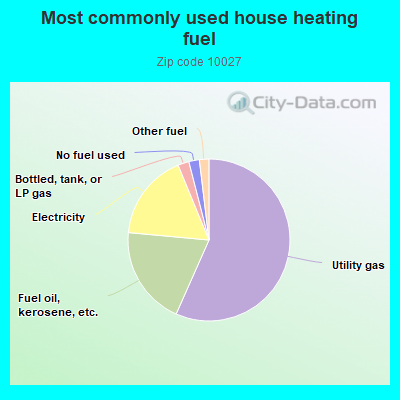
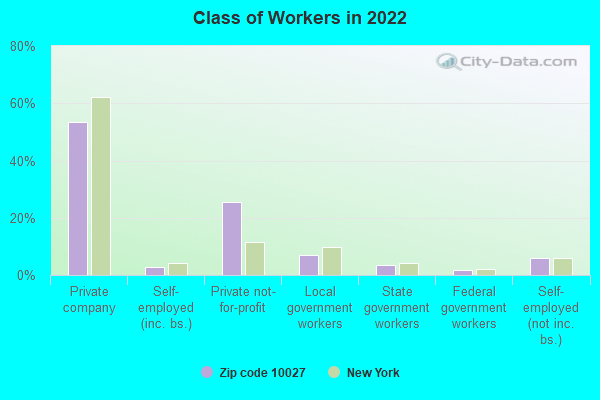
56.6%Utility gas
19.8%Fuel oil, kerosene, etc.
17.3%Electricity
2.2%Bottled, tank, or LP gas
2.1%No fuel used
1.9%Other fuel
Population in 1990: 54,631. Population change in the 1990s: +1,537 (+2.8%).
Place of birth for U.S.-born residents:
This state: 31,940
Northeast: 4,063
Midwest: 2,727
South: 4,652
West: 3,366
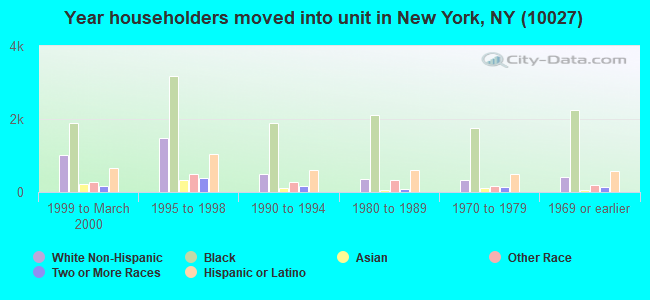
60% of the 10027 zip code residents lived in the same house 5 years ago. Out of people who lived in different houses, 44% lived in this county. Out of people who lived in different counties, 50% lived in New York.
85% of the 10027 zip code residents lived in the same house 1 year ago. Out of people who lived in different houses, 43% moved from this county. Out of people who lived in different houses, 18% moved from different county within same state. Out of people who lived in different houses, 22% moved from different state. Out of people who lived in different houses, 19% moved from abroad.
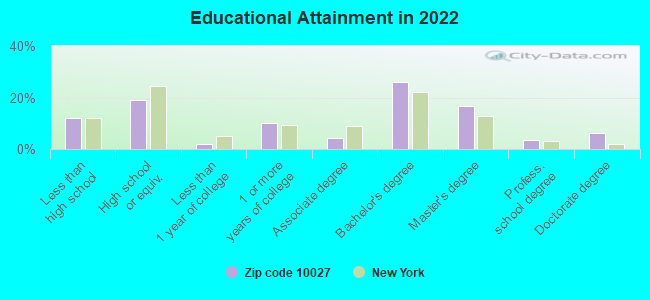
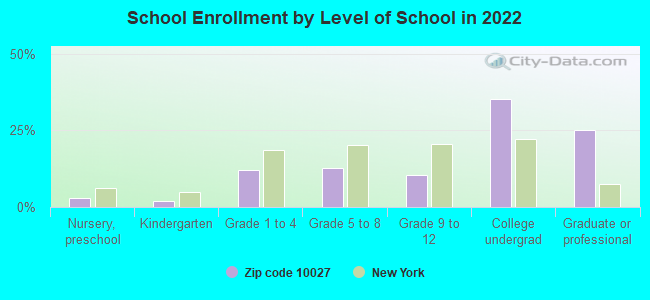
Private vs. public school enrollment:
Students in private schools in grades 1 to 8 (elementary and middle school): 819
Here:
14.7%
New York:
15.6%
Students in private schools in grades 9 to 12 (high school): 351
Here:
14.8%
New York:
15.0%
Students in private undergraduate colleges: 6,368
Here:
78.0%
New York:
39.2%
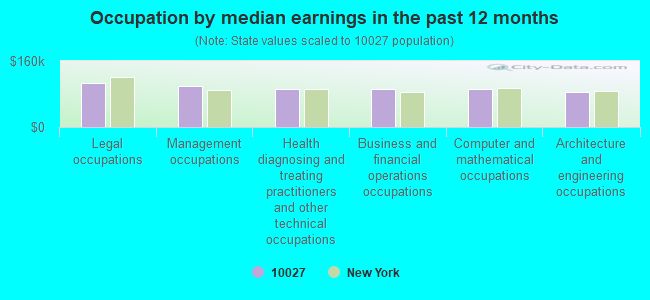
Occupation by median earnings in the past 12 months ($)
106,648Legal occupations
100,598Management occupations
93,111Health diagnosing and treating practitioners and other technical occupations
92,218Business and financial operations occupations
92,164Computer and mathematical occupations
84,335Architecture and engineering occupations
Companies with federal contracts located in this zip code:
TRUSTEES OF COLUMBIA UNIVERSIT (500 W 120TH ST in NEW YORK, NY) : $547,246 in 4 contractsfrom 2000 to 2001
$300,000 with Army for Other Research and Development -- Basic Research (R&D). Signed on 2001-01-10. Completion date: 2001-12-31.
$170,000, same as above.Signed on 2000-07-05. Completion date: 2000-08-30.
$42,796, same as above.Signed on 2000-07-20. Completion date: 2000-08-30.
$34,450, same as above.Signed on 2000-04-11. Completion date: 2000-12-31.
NEW-LIFE GROUP INC (2090 ADAM CLAYTON in NEW YORK, NY; small business) 145 employees, $1800000 revenue. 8A Firm, Small Disadvantaged Business, Veteran Owned Business: $317,000 in 15 contractsfrom 1999 to 2000
Contracts for Custodial Janitorial Services, Guard Services by Public Buildings Service, Internal Revenue Service Signed by year:2000: $250,000; 2001: $0; 2002: $0; 2003: $0; 2004: $0; 2005: $0; 2006: $0.
Biggest contracts:
$274,000 with Public Buildings Service for Custodial Janitorial Services. Signed on 2000-09-15. Completion date: 1999-08-15.
$60,000, same as above.Signed on 1999-10-15. Completion date: 1999-08-15.
$21,000 with Internal Revenue Service for Guard Services. Signed on 2000-05-15. Completion date: 2000-09-15.
$8,000 with Internal Revenue Service for Guard Services. Taking place in PA. Signed on 2000-03-15. Completion date: 2000-06-15.
GLENN HUBBARD (3022 BROADWAY in New York, ny; small business)
$280,150 with Offices, Boards and Divisions (includes Attorney General, Deputy Attorney General, etc.) for Expert Witness. Taking place in DC. Signed on 2005-08-12. Completion date: 2006-01-31.
COLUMBIA UNIVERSITY NEW YORK (107 LOW MEMORIAL LIBRARY in NEW YORK, NY) : $251,000 in 6 contractsfrom 1999 to 2005
Contracts for Equipment and Materials Testing -- Chemicals and Chemical Products, Medical and Health Studies, AIDS Research -- Applied Research and Exploratory Development (R&D) by Geological Survey, National Institutes of Health Signed by year:2000: $122,000; 2001: $79,000; 2002: $0; 2003: $0; 2004: $0; 2005: $0; 2006: $0.
Biggest contracts:
$110,000 with Geological Survey for Equipment and Materials Testing -- Chemicals and Chemical Products. Signed on 2000-07-15. Completion date: 2000-09-15.
$57,000 with National Institutes of Health for Medical and Health Studies. Signed on 2001-11-15. Completion date: 2002-05-15.
$50,000 with Geological Survey for Equipment and Materials Testing -- Chemicals and Chemical Products. Signed on 1999-10-15. Completion date: 1999-12-15.
$22,000, same as above.Signed on 2001-09-15. Completion date: 2000-09-15.
JACOAB K. THOMAS (620 URIS HL in NEW YORK, NY; small business) : $243,100 in 2 contractsfrom 2002 to 2003
$230,000 with Offices, Boards and Divisions (includes Attorney General, Deputy Attorney General, etc.) for Expert Witness. Signed on 2002-07-15. Completion date: 2003-01-15.
$13,100, same as above.Signed on 2003-02-01. Completion date: 2003-07-31.
BARNARD COLLEGE (3009 BROADWAY in NEW YORK, NY)
$8,500 with Army for Educational Services. Taking place in MO. Signed on 2003-05-30. Completion date: 2003-05-30.
Top industries in this zip code by the number of employees in 2005:
2007 - 2018 National Fire Incident Reporting System (NFIRS) incidents
Based on the data from the years 2007 - 2018 the average number of fires per year is 404. The highest number of reported fire incidents - 506 took place in 2014, and the least - 279 in 2007. The data has a rising trend.
When looking into fire subcategories, the most reports belonged to: Structure Fires (78.3%), and Outside Fires (16.1%).
Fire incident types reported to NFIRS in Zip Code 10027


 Nearest zip codes: 10026, 10115, 10030, 10031, 10037, 10025.


 Based on the data from the years 2007 - 2018 the average number of fires per year is 404. The highest number of reported fire incidents - 506 took place in 2014, and the least - 279 in 2007. The data has a rising trend.
 When looking into fire subcategories, the most reports belonged to: Structure Fires (78.3%), and Outside Fires (16.1%).